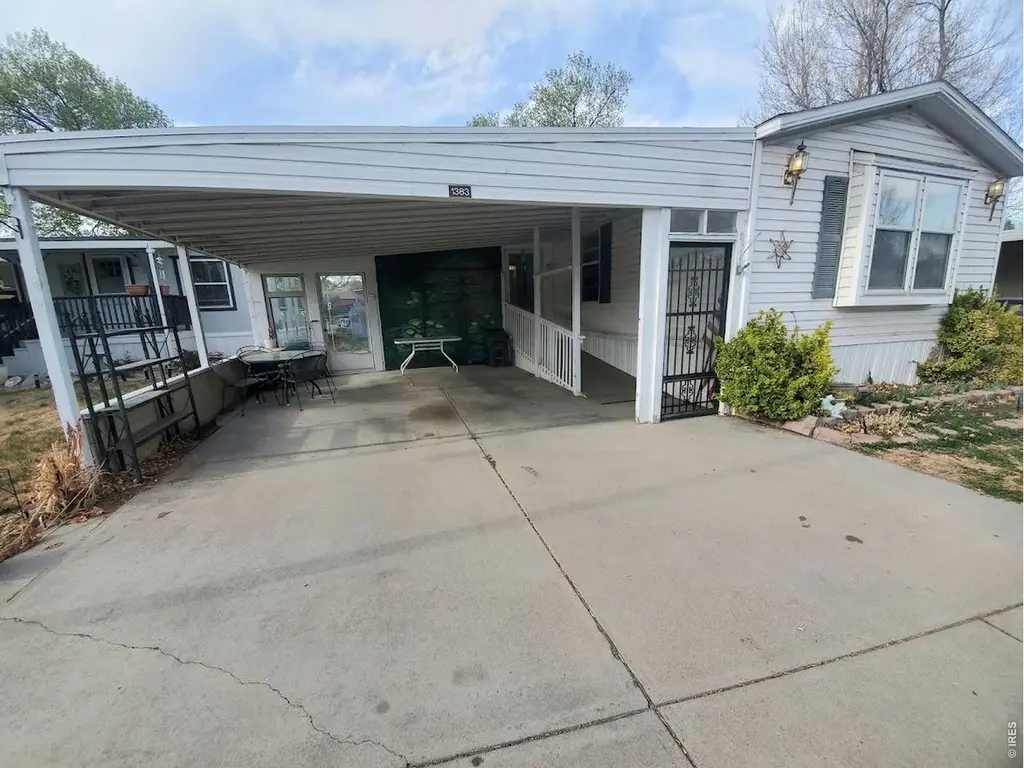
1383 Sunset Pl #9 · Loveland, CO
Flood risk 1/10 · Minimal
- FEMA flood zone
- X (unshaded)
- Chance of flooding over 30 yrs
- 0.0%
- Est. flood insurance / yr
- $507 – $1,088
Fire risk 5/10 · Moderate
- Est. fire insurance / yr
- $939 – $1,743
Heat risk 3/10 · Minor
- Hot days now (above 92°F)
- 7 days/yr
- Hot days in 30 yrs
- 18 days/yr
Wind risk 1/10 · Minimal
- Chance of severe wind over 30 yrs
- —
Air-quality risk 4/10 · Minor
- Unhealthy air days now
- 6 days/yr
- Unhealthy air days in 30 yrs
- 8 days/yr
Risk factors via First Street. Map © Google.
Why this score? — see what drove the C- grade
The composite is a weighted blend of 9 inputs, each scored 0–100. Each bar is that input's sub-score; the figure is the points it added to the 100-point composite (weight × sub-score).
- Cash flow +15.0/30.0
- ARV discount +15.0/15.0
- 1% rule +5.0/10.0
- DSCR +5.0/10.0
- Livability +3.7/5.0
- Rent growth +3.4/5.0
- Schools +3.4/10.0
- Condition / age +2.5/5.0
- Appreciation +0.0/10.0
$35,000
🖨 Deal sheet (PDF) 📄 Offer letter ✓ Due diligence
Listing remarks MLS
Mobile only- no land. Neat & Clean! Bright unit with eat in kitchen, lots of storage & breakfast bar. Master BR has 2 huge walk in closets. Master bath has separate shower and soaking tub. Newer custom window blinds and modern computer desk stay! Mostly enclosed patio area includes separate workshop with storage and plenty of room to entertain. Fully fenced backyard with trees and flowers and backs to quiet street. Double carport. Buyer to verify measurements. People and pets must be approved.
Key facts
- Carport and garage
- 2 walk-in closets
- Built 2002
Tags
Property features AI
Finance
- Other: Builder: Clayton
- HOA & community: No association fees
Exterior
- Parking: Carport
- Utilities: City water (meter installed); Public sewer; Natural gas available (Xcel); Electricity available; Cable and satellite available; High-speed internet available; Underground utilities; City trash service (City of Loveland)
- Home design: Manufactured in park; Manufactured home; House faces north; Level lot; Near bus
- Construction: Frame construction with vinyl siding; Composition roof
- Exterior features: Patio; Tandem garage; Storage structure; Chain link fenced yard; Land lease
Interior
- Kitchen: Gas range; Dishwasher; Refrigerator
- Bedrooms: 3 bedrooms
- Bathrooms: 2 full bathrooms
- Heating & cooling: Forced air heating
- Interior features: Eat-in kitchen; Window coverings
- Laundry & utility: Washer; Dryer
Neighborhood map
What this means for you Summary
Snapshot
- This is a 3-bed/2.0-bath manufactured listed at $35k.
Deal economics
- At list price, monthly cash flow is $1k ($13k/yr) — positive.
- The deal already cash-flows at list — no discount required.
- Meets the 1% rule at list price ($2k rent vs $35k).
- Recommended offer: $33k (6.0% below list) — sets the bar for market timing.
- Cap rate 43.6% vs local median 2.9% in Loveland — top-decile yield for the area; either an underpriced asset or a hidden risk that comps aren't pricing in. Stress-test before assuming the spread holds.
Location & tenants
- Location reads 73/100 on livability (#52 in CO) — a middle-class / working-renter tenant base. Strengths: housing A+, health & safety A+, amenities A; Watch: crime C-, commute F, cost of living F.
- Thompson School District R-2J (suburban): math 28% / reading 48% proficiency, ranked #28 of 86 in CO (top 33%) — families likely to look elsewhere, expect single-tenant / working-renter base with shorter leases.
- Zoned schools: Winona Elementary School (math 15% / reading 22%, grade F, #724 of 966 statewide, top 77%, 250 students, 68% FRL); Conrad Ball Middle School (math 17% / reading 22%, grade F, #207 of 270 statewide, top 79%, 294 students, 63% FRL); Mountain View High School (math 24% / reading 51%, grade F, #192 of 381 statewide, top 51%, 1,138 students, 35% FRL) — zoned schools average 55% FRL vs 29% district-wide (26 pts higher); higher-poverty schools than district average — tighter screening recommended.
- Zoned-school proficiency averages 25% at this address vs 38% district-wide (-13 pts) — the specific schools serving this property underperform the Thompson School District R-2J average; the district grade overstates school quality for this exact location.
- Market conditions: Rents rising (+3.6%/yr); 292 active listings in the ZIP; 29 comparable units currently listed for rent nearby; rentals at typical pace (median 25d on market — plan ~3-4 weeks tenant-placement turnaround); solid renter incomes; 1,786 units permitted in Larimer County in 2024 (402 in 5+ unit buildings).
Forward outlook
- Local home prices are declining (-3.0%/yr); year-one equity from $242 of loan paydown is wiped out by about $1k of value loss. Plan a longer hold.
- Larimer County population projected at +51% by 2050 — long-run rental-demand tailwind backs the buy-and-hold thesis.
- At projected returns (-3.0% appreciation + 3.6% rent growth), your $10k cash investment doubles in ~1 year — after that, you're playing with house money.
Negotiation context
- It's been on market 74 days — a 6% lower offer ($33k) is reasonable based on typical stale-listing flexibility.
- 2 sale attempts since 15y ago; this cycle's ask has dropped $14k (29%) from the opening price — seller is motivated, your offer sets the floor, not the list.
Risks & watch-outs
- Climate carrying-cost: moderate wildfire risk — expect insurance premiums to compound above CPI over the hold.
Questions for the listing agent
- It's been on market 74 days. Have you received any prior offers? Is the seller open to a 6% concession, seller financing, or rate buy-down credit?
- Why hasn't it sold? Are there any deal-killer items the seller is aware of (foundation, flood, title, zoning, code violations)?
- Is there a deadline driving the sale (1031 exchange, divorce, estate, relocation)? That informs how much negotiation room exists.
- What's the average days-on-market for RENTAL listings here right now (not sales)? A rising rental-DOM trend means longer vacancies and softer asking-rent achievability than the comps imply.
- What's the recent tenant-quality profile in this submarket — average credit score on applications, eviction rate, late-payment / NSF rate, and stable-employment percentage? A property-management company in the area should have these aggregated.
- How much new for-sale + rental construction is in the pipeline within 1–3 miles? Heavy new supply typically softens prices + rents 12–24 months out; constrained supply supports both.
Investment metrics
- 1% rule
- 4.80% ✓
- Cap rate
- 43.59%
- Cash-on-cash
- 133.20%
- DSCR
- 6.93
- GRM
- 1.7
CMA / ARV
- ARV (on-the-fly)
- $66,880
- Comps found
- 12
Show comp detail 12 sales within ~0.75 mi
| Address | Dist | Beds/Ba | Sqft | Sold | Price | $/sf | Match |
|---|---|---|---|---|---|---|---|
| 1516 Sunset Pl #30 | 0.00mi | 3/2.0 | 1,216 (0%) | 9mo | $12,000 | $10 | 92 |
| 1166 Madison Ave #244 | 0.09mi | 3/2.0 | 1,232 (+1%) | 4mo | $55,000 | $45 | 90 |
| 1641 Garnet St #49 | 0.15mi | 3/2.0 | 1,216 (0%) | 6mo | $38,000 | $31 | 88 |
| 1166 Madison Ave #136 | 0.09mi | 3/2.0 | 1,296 (+7%) | 4mo | $48,000 | $37 | 82 |
| 1375 Sunset Pl #10 | 0.00mi | 2/2.0 (-1) | 1,148 (-6%) | 8mo | $87,500 | $76 | 79 |
| 1829 Sandstone Ct #77 | 0.25mi | 3/2.0 | 1,296 (+7%) | 0mo | $71,900 | $55 | 77 |
| 1166 Madison Ave #183 | 0.09mi | 2/2.0 (-1) | 1,248 (+3%) | 12mo | $75,000 | $60 | 76 |
| 1166 Madison Ave #246 | 0.09mi | 3/2.0 | 1,080 (-11%) | 2mo | $85,000 | $79 | 76 |
| 1759 Jade Dr #146 | 0.20mi | 3/2.0 | 1,296 (+7%) | 8mo | $60,000 | $46 | 73 |
| 1500 Sylmar Pl #701 | 0.06mi | 3/2.0 | 1,064 (-12%) | 6mo | $34,000 | $32 | 71 |
| 1757 Sandstone Dr #132 | 0.20mi | 3/2.0 | 1,344 (+10%) | 10mo | $95,000 | $71 | 65 |
| 1166 Madison Ave #203 | 0.09mi | 2/1.5 (-1) | 1,072 (-12%) | 7mo | $72,500 | $68 | 63 |
Match score weights: distance 35% · size 25% · config 20% · recency 20%. Top-matched comps best support the ARV.
Projected returns pro-forma
-3.0% appreciation · 3.57% rent growth · sell at horizon
- IRR
- —
- Equity multiple
- 7.59×
- Total profit
- $64,602
- Equity at exit
- $5,219
- IRR
- —
- Equity multiple
- 16.26×
- Total profit
- $149,581
- Equity at exit
- $3,026
Cash invested: $9,800 (down + closing). Projections, not guarantees.
Landlord ↔ Tenant lean methodology
- Overall (STATE)
- 38 Tenant-Leaning
- State Colorado
- 38 Tenant-Leaning · D+4
- County
- — inherits STATE
- City
- — inherits STATE
ZIP-level market 80537
- Rents YoY
- 3.6%
- Active inventory
- 292
- Price-to-rent
- 1.7×
Monthly cashflow live
- Estimated rent
- $1,679 high interval (Pro) →
- Mortgage (P&I)
- −$184
- Tax from tax record
- −$41 /mo · $487/yr
- Insurance
- −$15
- HOA
- −$0
- Vacancy / Maint / Mgmt
- −$353
- Net cashflow
- $1,088
Break-even live
Sensitivity live
| Price | -10% $1,108 | -5% $1,098 | +0% $1,088 | +5% $1,078 | +10% $1,068 |
|---|---|---|---|---|---|
| Rent | -10% $955 | -5% $1,021 | +0% $1,088 | +5% $1,154 | +10% $1,220 |
| Rate | -1.0pp $1,105 | -0.5pp $1,097 | base $1,088 | +0.5pp $1,079 | +1.0pp $1,069 |
UW: 25.0% down · 7.5% · 30yr · 1.5% tax · 5.0% vac · 8.0% maint · 8.0% mgmt
Financing live
Cash to close
- Down payment
- $8,750
- Closing costs
- $1,050
- Reserves months
- —
- Total cash needed
- —
Loan-product check · same deal, 3 products live
Conventional
25% down · 7.5% · 30yr
- Down + closing
- —
- Monthly P&I
- —
- Monthly cashflow
- —
- DSCR
- —
- Eligible?
- —
Personal DTI + credit; lowest rate.
DSCR
20% down · 8.5% · 30yr
- Down + closing
- —
- Monthly P&I
- —
- Monthly cashflow
- —
- DSCR
- —
- Eligible?
- —
No personal income docs; deal must DSCR.
Hard money
10% down · 12.0% · 12mo
- Down + closing
- —
- Monthly P&I
- —
- Monthly cashflow
- —
- DSCR
- —
- Eligible?
- —
Short-term bridge; refi at stabilization.
Rent comps 29 comps
| Address | Beds | Baths | Sqft | Rent | $/sqft | DOM | Units | Dist |
|---|---|---|---|---|---|---|---|---|
| 1302 Nickel Dr Unit 1 Loveland, CO | 3.0 | 1.0 | 950 | $1,300 | $1.37 | 25d | 1 | 0.13mi |
| 1710 E 16th St Loveland, CO | 2.0 | 1.5 | 900 | $1,427 | $1.59 | 25d | 1 | 0.35mi |
| 1706 E 16th St Unit 1710 Loveland, CO | 2.0 | 1.5 | 900 | $1,250 | $1.39 | 25d | 1 | 0.36mi |
| 1707 E 16th St Unit 1717 Loveland, CO | 2.0 | 1.5 | 825 | $1,295 | $1.57 | 15d | 1 | 0.38mi |
| 734 Madison Ave Loveland, CO | 3.0 | 1.0 | 1200 | $1,800 | $1.50 | 15d | 1 | 0.41mi |
| 1840 E 17th St Unit 1840 Loveland, CO | 3.0 | 1.0 | 1000 | $1,345 | $1.34 | 15d | 1 | 0.46mi |
| 1707 Cheyenne Ave Unit 8 Loveland, CO | 2.0 | 1.0 | 820 | $1,245 | $1.52 | 25d | 1 | 0.48mi |
| 1640 Cheyenne Ave Loveland, CO | 2.0 | 1.0 | 900 | $1,900 | $2.11 | 25d | 1 | 0.50mi |
| 1292 E 6th St Loveland, CO | 1.0–3.0 | 1.0–1.5 | 845 | $1,991 | $2.36 | 15d | 1 | 0.58mi |
| 1494 E 5th St Loveland, CO | 2.0 | 1.0 | 800 | $1,525 | $1.91 | 25d | 1 | 0.59mi |
| 1143 E 5th St Loveland, CO | 2.0 | 1.0 | 760 | $1,250 | $1.64 | 25d | 1 | 0.63mi |
| 1145 E 5th St Loveland, CO | 2.0 | 1.0 | 760 | $1,250 | $1.64 | 25d | 1 | 0.64mi |
| 1054 E 5th St Loveland, CO | 3.0 | 1.0 | 1090 | $1,700 | $1.56 | 15d | 1 | 0.74mi |
| 1325 N Jefferson Ave Loveland, CO | 2.0 | 1.0 | 850 | $1,545 | $1.82 | 25d | 1 | 0.85mi |
| 1116 Cleveland Ave Loveland, CO | 2.0 | 1.0 | 1338 | $1,345 | $1.01 | 25d | 1 | 0.96mi |
| 574 E 23rd St Loveland, CO | 2.0 | 1.0 | 956 | $1,250 | $1.31 | 25d | 5 | 1.03mi |
| 325 E 5th St Loveland, CO | 3.0 | 1.0–2.0 | 1188 | $2,335 | $1.97 | 15d | 1 | 1.05mi |
| 585 N Lincoln Ave Loveland, CO | 1.0–2.0 | 1.0–2.0 | 747 | $1,750 | $2.34 | 25d | 3 | 1.07mi |
| 2900 Mountain Lion Dr Loveland, CO | 3.0 | 1.0–2.0 | 936 | $2,360 | $2.52 | 15d | 17 | 1.17mi |
| 247 W 10th St Loveland, CO | 2.0 | 2.0 | 865 | $2,500 | $2.89 | 22d | 1 | 1.20mi |
| 246 N Cleveland Ave Loveland, CO | 3.0 | 1.0–2.0 | 1022 | $3,102 | $3.03 | 15d | 11 | 1.22mi |
| 110 E 1st St Loveland, CO | 2.0 | 2.0 | 1300 | $1,695 | $1.30 | 25d | 1 | 1.34mi |
| 130 E 1st St Loveland, CO | 2.0 | 1.0 | 800 | $1,695 | $2.12 | 25d | 1 | 1.35mi |
| 140 E 1st St Loveland, CO | 2.0 | 2.0 | 875 | $1,795 | $2.05 | 15d | 1 | 1.35mi |
| 430 W 10th St Loveland, CO | 2.0 | 1.0 | 756 | $1,400 | $1.85 | 25d | 1 | 1.40mi |
| 434 W 10th St Loveland, CO | 2.0 | 1.0 | 872 | $1,400 | $1.61 | 25d | 1 | 1.40mi |
| 466 W 10th St Loveland, CO | 2.0 | 1.0 | 840 | $1,400 | $1.67 | 25d | 1 | 1.43mi |
| 480 W 10th St Loveland, CO | 2.0 | 2.0 | 940 | $1,700 | $1.81 | 25d | 1 | 1.44mi |
| 1015 Roosevelt Ave Unit B1 Loveland, CO | 2.0 | 1.0 | 900 | $1,500 | $1.67 | 25d | 1 | 1.47mi |
Listing history 23 events
-
2026-06-21days on market $35,000 Active 74 DOM
-
2026-06-18days on market $35,000 Active 71 DOM
-
2026-06-18price $35,000 Active 70 DOM
-
2026-06-17days on market $45,000 Active 70 DOM
-
2026-06-16days on market $45,000 Active 69 DOM
-
2026-06-15days on market $45,000 Active 68 DOM
-
2026-06-14days on market $45,000 Active 66 DOM
-
2026-06-13days on market $45,000 Active 65 DOM
-
2026-06-10days on market $45,000 Active 63 DOM
-
2026-06-09days on market $45,000 Active 62 DOM
-
2026-06-08days on market $45,000 Active 61 DOM
-
2026-06-07days on market $45,000 Active 60 DOM
-
2026-06-03days on market $45,000 Active 56 DOM
-
2026-06-02days on market $45,000 Active 55 DOM
-
2026-06-01days on market $45,000 Active 54 DOM
-
2026-05-31days on market $45,000 Active 53 DOM
-
2026-05-30days on market $45,000 Active 52 DOM
-
2026-05-16price $45,000
-
2026-04-07$49,500 Active
-
2011-08-15soldstatus $32,000 Sold 506-char remark
Show marketing remark (506 chars)
Mobile only- no land. Neat & Clean! Bright unit with eat in kitchen, lots of storage & breakfast bar. Master BR has 2 huge walk in closets. Master bath has separate shower and soaking tub. Newer custom window blinds and modern computer desk stay! Mostly enclosed patio area includes separate workshop with storage and plenty of room to entertain. Fully fenced backyard with trees and flowers and backs to quiet street. Double carport. Buyer to verify measurements. People and pets must be approved.
-
2011-08-02historical Active - Backup 506-char remark
Show marketing remark (506 chars)
Mobile only- no land. Neat & Clean! Bright unit with eat in kitchen, lots of storage & breakfast bar. Master BR has 2 huge walk in closets. Master bath has separate shower and soaking tub. Newer custom window blinds and modern computer desk stay! Mostly enclosed patio area includes separate workshop with storage and plenty of room to entertain. Fully fenced backyard with trees and flowers and backs to quiet street. Double carport. Buyer to verify measurements. People and pets must be approved.
-
2011-05-11price $59,000 506-char remark
Show marketing remark (506 chars)
Mobile only- no land. Neat & Clean! Bright unit with eat in kitchen, lots of storage & breakfast bar. Master BR has 2 huge walk in closets. Master bath has separate shower and soaking tub. Newer custom window blinds and modern computer desk stay! Mostly enclosed patio area includes separate workshop with storage and plenty of room to entertain. Fully fenced backyard with trees and flowers and backs to quiet street. Double carport. Buyer to verify measurements. People and pets must be approved.
-
2011-04-08$60,000 Active 506-char remark
Show marketing remark (506 chars)
Mobile only- no land. Neat & Clean! Bright unit with eat in kitchen, lots of storage & breakfast bar. Master BR has 2 huge walk in closets. Master bath has separate shower and soaking tub. Newer custom window blinds and modern computer desk stay! Mostly enclosed patio area includes separate workshop with storage and plenty of room to entertain. Fully fenced backyard with trees and flowers and backs to quiet street. Double carport. Buyer to verify measurements. People and pets must be approved.
ⓘ Source: listings_history table (triggers on properties + properties_extension) + one-shot
backfill from property_details.listing_events for pre-trigger history.
Tax reassessment forecast CO · Resets to sale price
- Current annual tax
- $487 · $41/mo
- Projected year-2 tax
- $487 · $41/mo
- Expected delta
- $0/yr ($0/mo · -0.0%)
ⓘ Screening estimate from a state-policy table — verify with the county assessor before closing.
Climate risk First Street
- Flood 1/10 Low FEMA zone X (unshaded) · 0% chance over 30 yrs
- Wildfire 5/10 Major
- Heat 3/10 Moderate 7 d/yr ≥92°F today · 18 d/yr by 30 yrs out
- Wind 1/10 Low
- Air quality 4/10 Moderate 6 unhealthy d/yr today · 8 by 30 yrs out
Nearby sold comps map
Loading sold comps map…
Walkable amenities ~0.75 mi
Loading nearby amenities…
Taxation est. · year 1
- Rental income
- $20,149
- − Mortgage interest
- −$1,961
- − Property taxes
- −$487
- − Insurance
- −$175
- − Repairs & maintenance
- −$1,612
- − Management
- −$1,612
- − Depreciation
- −$1,018
- Taxable income
- $13,285
- Est. tax owed @ 24.0%
- −$3,188
- After-tax cash flow
- $9,865/yr
For passive investors: Depreciation is non-cash, so a rental often shows a tax loss while cash-flowing — sheltering income. Rental losses are passive: they offset passive income freely, and up to $25,000/yr can offset ordinary (W-2) income if you actively participate and your MAGI is under $100k (phasing out to $0 by $150k); unused losses carry forward. On sale, claimed depreciation is recaptured at up to 25%, and gains may owe capital-gains tax (a 1031 exchange can defer both). Figures are a year-1 estimate at your 24.0% rate — not tax advice; consult a CPA.
Schools (NCES district)
- District
- Thompson School District R-2J
- NCES district ID
- 0805400
- Math proficiency
- 28% ▼ -7.00%
- Reading proficiency
- 48% ▬ 0.00%
- Median HH income
- $63,040
- Composite
- 34.01/100
- National rank
- #5313
- State rank
- #28 of 86 in CO
Livability — Loveland
- Score
- 73/100
- State rank
- #52
- US rank
- #5353
Category grades
Schools grade is shown separately in the Schools card above.
Census & demographics
- Census place
- Loveland, CO
- County
- Larimer County · 338,255 people
- City population
- 94,535
- Metro
- Fort Collins, CO
- Population (ZIP)
- 44,425
- Household income
- $86,325
- Rent vs Own
- Severe rent burden
- 1703.0
Population outlook (Larimer County) Hauer SSP2
- Today (2025)
- 415,361 people
- By 2030
- 457,762 · +10.2%
- By 2040
- 542,310 · +30.6%
- By 2050
- 627,048 · +51.0%
- By 2075
- 833,722 · +100.7%
- By 2100
- 952,590 · +129.3%
Race, ethnicity, and origin ACS 2023
- Neighborhood character
- Predominantly White (83%)
- Race & ethnicity
- White 83% Hispanic / Latino 12% Two or more races 8%
- Hispanic origin (detail)
- Mexican 10%
- Common ancestry
- Slovak 4% Italian 3% Lithuanian 3%
- Foreign-born
- 3% · Canada
- Languages at home
- 95% English-only · Spanish 4%
Political lean MEDSL · Larimer
- 2024 margin
- D (+17.6) · D 57.4% · R 39.8% · Other 2.9%
- 2008→2024 swing
- +7.9pp toward D · 2008: 9.7pp · 2024: 17.6pp
- All cycles
- 2024: D+17.6 2020: D+15.4 2016: D+4.9 2012: D+5.2 2008: D+9.7
Not yet ingested
- Civics
- —
Market trends
- HPI YoY
- ▼ -606.26%
- Current HPI
- 253.4939
- Rent YoY
- ▲ 3.57%
- Metro
- Fort Collins, CO
- State GDP YoY
- ▲ 1.95%
- F500 in state
- 14
Industry mix (Fortune 500 HQ in CO)
| Industry | F500 HQs | Revenue |
|---|---|---|
| Technology Distribution | 1 | $31B |
|
||
| Food / Agriculture | 1 | $18B |
|
||
| Packaging | 1 | $14B |
|
||
| Healthcare | 1 | $13B |
|
||
| Energy | 1 | $10B |
|
||
| Technology | 1 | $4B |
|
||
Price history
-25.0% since first listed6 events — show timeline
- 2026-05-16 Price Changed $45,000 IRES
- 2026-04-07 Listed $49,500 IRES
- 2011-08-15 Sold (MLS) $32,000 IRES
- 2011-08-02 Contingent — IRES
- 2011-05-11 Price Changed $59,000 IRES
- 2011-04-08 Listed $60,000 IRES
Property tax history
+4.6%/yrLatest (2025): $487 · +408.9% YoY. Source: county tax records.
Cash-flow waterfall
monthlySold comps — $/sqft
last 12 mo · ≤1 miLoading sold comps…