 Multi-family
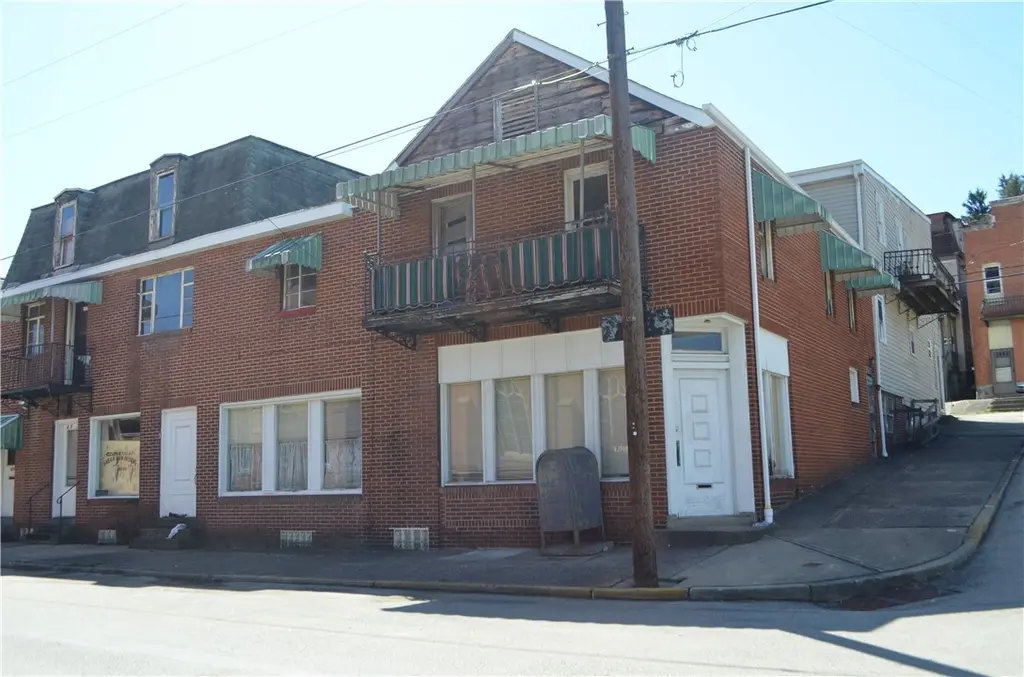
639 Washington Ave · Charleroi, PA
Flood risk No data
- FEMA flood zone
- —
- Chance of flooding over 30 yrs
- —
- Est. flood insurance / yr
- —
Fire risk No data
- Est. fire insurance / yr
- —
Heat risk No data
- Hot days now (above threshold)
- —
- Hot days in 30 yrs
- —
Wind risk No data
- Chance of severe wind over 30 yrs
- —
Air-quality risk No data
- Unhealthy air days now
- —
- Unhealthy air days in 30 yrs
- —
Risk factors via First Street. Map © Google.
Why this score? — see what drove the F grade
The composite is a weighted blend of 9 inputs, each scored 0–100. Each bar is that input's sub-score; the figure is the points it added to the 100-point composite (weight × sub-score).
- Appreciation +4.1/10.0
- Livability +3.8/5.0
- Schools +3.0/10.0
- Rent growth +2.5/5.0
- Condition / age +2.2/5.0
- Cash flow +0.0/30.0
- 1% rule +0.0/10.0
- DSCR +0.0/10.0
- ARV discount +0.0/15.0
$79,900
🖨 Deal sheet 📄 Offer letter ✓ Due diligence
Multi-family units
County records classify this as Multi-Family (2-4 Unit). Listing-text estimate: 1 unit. estimate disagrees with records
Listing remarks MLS
Investor Special! Unlock the potential in this unique multi-unit property featuring a separate house and an apartment building on one lot. This is the perfect opportunity for investors, flippers, or buyers looking to build equity while generating rental income. The property includes a 3-bedroom single family home, one 2-bedroom apartment unit. Additional units in the building in need of significant renovation, offering value add potential. While part of the property requires substantial work, the existing rentable spaces give you the flexibility to renovate while still bringing in cash flow. Also included with the sale is the lot up the street.
Key facts
- Separate house
- Value add potential
- Apartment building
Tags
Neighborhood map
What this means for you Summary
Snapshot
- This is a 7-bed/3.5-bath multifamily listed at $80k. Condition is rated fair.
Deal economics
- At list price, monthly cash flow is $-552 ($-7k/yr) — negative.
- Rent doesn't cover operating costs at any purchase price — skip.
- Recommended offer: $75k (6.0% below list) — sets the bar for market timing.
- Cap rate -2.0% vs local median 15.3% in Charleroi — below-typical yield; the buyer is paying a premium for something (appreciation thesis, condition, location) that the cap rate doesn't capture.
Location & tenants
- Location reads 76/100 on livability (#382 in PA, #3,416 nationally) — a middle-class / working-renter tenant base. Strengths: cost of living A+, housing A+, crime A-; Watch: schools D+, employment F.
- Charleroi SD (rural): math 20% / reading 51% proficiency, ranked #421 of 539 in PA (top 78%) — families likely to look elsewhere, expect single-tenant / working-renter base with shorter leases.
- Market conditions: 87 active listings in the ZIP; 489 units permitted in Washington County in 2024 (30 in 5+ unit buildings).
Forward outlook
- Local home prices are declining (-1.8%/yr); year-one equity from $552 of loan paydown is wiped out by about $1k of value loss. Plan a longer hold.
- Washington County population projected to shrink 6% by 2050 — rents likely to lag national; underwrite the cash flow, not the appreciation.
Negotiation context
- It's been on market 82 days — a 6% lower offer ($75k) is reasonable based on typical stale-listing flexibility.
Risks & watch-outs
- Watch-outs: built in 1900 — expect roof / HVAC / electrical / plumbing capex.
Questions for the listing agent
- What do current leases actually rent for vs. the listed asking? Can we see a recent rent roll and the last 12 months of T-12 income?
- It's been on market 82 days. Have you received any prior offers? Is the seller open to a 6% concession, seller financing, or rate buy-down credit?
- Have any recent inspections been done? Can we get a copy of the seller's disclosures and any deferred-maintenance estimates?
- Built in 1900 — when were the roof, HVAC, electrical panel, plumbing, and water heater last replaced?
- Why hasn't it sold? Are there any deal-killer items the seller is aware of (foundation, flood, title, zoning, code violations)?
- Is there a deadline driving the sale (1031 exchange, divorce, estate, relocation)? That informs how much negotiation room exists.
- Schools are D-rated, which usually means shorter tenancies and higher turnover. Who's the typical renter profile here, and what's been the actual vacancy rate?
- The area grade is low — what's the realistic commute time and amenity access for the typical tenant pool here? Any planned neighborhood developments (good or bad) we should know about?
- What's the average days-on-market for RENTAL listings here right now (not sales)? A rising rental-DOM trend means longer vacancies and softer asking-rent achievability than the comps imply.
- What's the recent tenant-quality profile in this submarket — average credit score on applications, eviction rate, late-payment / NSF rate, and stable-employment percentage? A property-management company in the area should have these aggregated.
- How much new apartment / multifamily construction is in the pipeline within 1–3 miles? Heavy new supply (>2% of stock underway) typically softens rents 12–24 months out; light construction supports rent growth.
Investment metrics
- 1% rule
- 0.00% ✗
- Cap rate
- -2.00%
- Cash-on-cash
- -29.62%
- DSCR
- -0.32
- GRM
- 0.0
CMA / ARV
- ARV (median comp)
- $58,504
- List price
- $79,900
- Delta
- 36.57%
- Verdict
- OVERPRICED
- Comps
- 1 within 2.0 mi
Show comp detail 2 sales within ~0.75 mi
| Address | Dist | Beds/Ba | Sqft | Sold | Price | $/sf | Match |
|---|---|---|---|---|---|---|---|
| 526 Fallowfield | 0.15mi | 8/7.0 (+1) | — | 2mo | $382,500 | — | 60 |
| 701 W Liberty | 0.69mi | 6/3.0 (-1) | — | 19mo | $56,000 | — | 33 |
Match score weights: distance 35% · size 25% · config 20% · recency 20%. Top-matched comps best support the ARV.
Projected returns pro-forma
-1.83% appreciation · 3.0% rent growth · sell at horizon
- IRR
- -58.1%
- Equity multiple
- -0.97×
- Total profit
- $-44,128
- Equity at exit
- $16,155
- IRR
- -67.1%
- Equity multiple
- -2.58×
- Total profit
- $-80,123
- Equity at exit
- $14,418
Cash invested: $22,372 (down + closing). Projections, not guarantees.
Landlord ↔ Tenant lean methodology
- Overall (STATE)
- 62 Landlord-Friendly
- State Pennsylvania
- 62 Landlord-Friendly · EVEN
- County
- — inherits STATE
- City
- — inherits STATE
ZIP-level market 15022
- Home prices YoY
- -1.0%
- Active inventory
- 87
Monthly cashflow live
- Estimated rent
- $0 none
- Mortgage (P&I)
- −$419
- Tax est. 1.5%
- −$100 /mo · $1,198/yr
- Insurance
- −$33
- HOA
- −$0
- Vacancy / Maint / Mgmt
- −$0
- Net cashflow
- $-552
Break-even live
UW: 25.0% down · 7.5% · 30yr · 1.5% tax · 5.0% vac · 8.0% maint · 8.0% mgmt
Financing live
Cash to close
- Down payment
- $19,975
- Closing costs
- $2,397
- Reserves months
- —
- Total cash needed
- —
Loan-product check · same deal, 3 products live
Conventional
25% down · 7.5% · 30yr
- Down + closing
- —
- Monthly P&I
- —
- Monthly cashflow
- —
- DSCR
- —
- Eligible?
- —
Personal DTI + credit; lowest rate.
DSCR
20% down · 8.5% · 30yr
- Down + closing
- —
- Monthly P&I
- —
- Monthly cashflow
- —
- DSCR
- —
- Eligible?
- —
No personal income docs; deal must DSCR.
Hard money
10% down · 12.0% · 12mo
- Down + closing
- —
- Monthly P&I
- —
- Monthly cashflow
- —
- DSCR
- —
- Eligible?
- —
Short-term bridge; refi at stabilization.
Listing history 15 events
-
2026-06-18days on market $79,900 Active 82 DOM
-
2026-06-17days on market $79,900 Active 81 DOM
-
2026-06-16days on market $79,900 Active 80 DOM
-
2026-06-15days on market $79,900 Active 79 DOM
-
2026-06-13days on market $79,900 Active 77 DOM
-
2026-06-10price $79,900 Active 73 DOM
-
2026-06-09days on market $89,900 Active 73 DOM
-
2026-06-08days on market $89,900 Active 72 DOM
-
2026-06-07days on market $89,900 Active 71 DOM
-
2026-06-05days on market $89,900 Active 68 DOM
-
2026-06-03days on market $89,900 Active 67 DOM
-
2026-06-02days on market $89,900 Active 66 DOM
-
2026-06-01days on market $89,900 Active 65 DOM
-
2026-05-31days on market $89,900 Active 64 DOM
-
2026-03-28$89,900 Active 652-char remark
Show marketing remark (652 chars)
Investor Special! Unlock the potential in this unique multi-unit property featuring a separate house and an apartment building on one lot. This is the perfect opportunity for investors, flippers, or buyers looking to build equity while generating rental income. The property includes a 3-bedroom single family home, one 2-bedroom apartment unit. Additional units in the building in need of significant renovation, offering value add potential. While part of the property requires substantial work, the existing rentable spaces give you the flexibility to renovate while still bringing in cash flow. Also included with the sale is the lot up the street.
ⓘ Source: listings_history table (triggers on properties + properties_extension) + one-shot
backfill from property_details.listing_events for pre-trigger history.
Nearby sold comps map
Loading sold comps map…
Walkable amenities ~0.75 mi
Loading nearby amenities…
Taxation est. · year 1
- Rental income
- $0
- − Mortgage interest
- −$4,476
- − Property taxes
- −$1,198
- − Insurance
- −$400
- − Repairs & maintenance
- −$0
- − Management
- −$0
- − Depreciation
- −$2,324
- Taxable loss
- −$8,398
- Est. tax savings @ 24.0%
- +$2,016
- After-tax cash flow
- $-4,611/yr
For passive investors: Depreciation is non-cash, so a rental often shows a tax loss while cash-flowing — sheltering income. Rental losses are passive: they offset passive income freely, and up to $25,000/yr can offset ordinary (W-2) income if you actively participate and your MAGI is under $100k (phasing out to $0 by $150k); unused losses carry forward. On sale, claimed depreciation is recaptured at up to 25%, and gains may owe capital-gains tax (a 1031 exchange can defer both). Figures are a year-1 estimate at your 24.0% rate — not tax advice; consult a CPA.
Condition & rehab AI · 14 photos
This multi-family property requires extensive repairs and updates to improve its condition and increase its value for both resale and rental.
Repairs flagged
- Major exterior siding — The exterior siding is visibly damaged and in need of replacement.
- Major roof — The roof appears to be in poor condition, with visible damage and potential leaks.
- Major exterior walls — The exterior walls show signs of wear and tear, with some areas appearing to be in need of repainting or repair.
- Major landscaping — The landscaping appears to be minimal, with some overgrown areas and a lack of maintenance.
- Major fencing — The fencing appears to be in poor condition, with some sections missing or damaged.
- Major interior walls — The interior walls and paint appear to be in a state of disrepair, with some areas showing signs of wear and tear, such as peeling paint and missing flooring.
- Major kitchen — The kitchen appears to be in a state of disrepair, with some areas showing signs of wear and tear, such as peeling paint and missing flooring.
- Major bathrooms — The bathrooms appear to be in a state of disrepair, with some areas showing signs of wear and tear, such as peeling paint and missing flooring.
- Major flooring — The flooring appears to be in a state of disrepair, with some areas showing signs of wear and tear, such as peeling paint and missing flooring.
- Major HVAC and mechanical systems — The HVAC and mechanical systems appear to be in a state of disrepair, with some areas showing signs of wear and tear, such as peeling paint and missing flooring.
Value-add opportunities
- Both exterior siding replacement — Replacing the exterior siding will improve the curb appeal and increase the property's value for both resale and rental.
- Both roof repair/replacement — Repairing or replacing the roof will address a major issue and improve the property's value for both resale and rental.
- Both exterior wall repair and repainting — Repairing and repainting the exterior walls will improve the curb appeal and increase the property's value for both resale and rental.
- Both landscaping and fencing repair — Improving the landscaping and repairing the fencing will improve the property's curb appeal and increase the property's value for both resale and rental.
- Both kitchen and bathroom updates — Updating the kitchen and bathrooms will improve the property's functionality and increase the property's value for both resale and rental.
- Both HVAC and mechanical system upgrades — Upgrading the HVAC and mechanical systems will improve the property's functionality and increase the property's value for both resale and rental.
Renovation cost estimate screening
| Repair item | Severity | Est. cost |
|---|---|---|
| exterior siding · The exterior siding is visibly damaged and in need of replacement. | Major | $15,000–50,000 |
| roof · The roof appears to be in poor condition, with visible damage and potential leaks. | Major | $15,000–50,000 |
| exterior walls · The exterior walls show signs of wear and tear, with some areas appearing to be in need of repainting or repair. | Major | $15,000–50,000 |
| landscaping · The landscaping appears to be minimal, with some overgrown areas and a lack of maintenance. | Major | $15,000–50,000 |
| fencing · The fencing appears to be in poor condition, with some sections missing or damaged. | Major | $15,000–50,000 |
| interior walls · The interior walls and paint appear to be in a state of disrepair, with some areas showing signs of wear and tear, such as peeling paint and missing flooring. | Major | $15,000–50,000 |
| kitchen · The kitchen appears to be in a state of disrepair, with some areas showing signs of wear and tear, such as peeling paint and missing flooring. | Major | $15,000–50,000 |
| bathrooms · The bathrooms appear to be in a state of disrepair, with some areas showing signs of wear and tear, such as peeling paint and missing flooring. | Major | $15,000–50,000 |
| flooring · The flooring appears to be in a state of disrepair, with some areas showing signs of wear and tear, such as peeling paint and missing flooring. | Major | $15,000–50,000 |
| HVAC and mechanical systems · The HVAC and mechanical systems appear to be in a state of disrepair, with some areas showing signs of wear and tear, such as peeling paint and missing flooring. | Major | $15,000–50,000 |
| Total estimated repair cost · 10 items | $150,000–500,000 |
Value-add ROI direction
- Both exterior siding replacement — Replacing the exterior siding will improve the curb appeal and increase the property's value for both resale and rental. ↑
- Both roof repair/replacement — Repairing or replacing the roof will address a major issue and improve the property's value for both resale and rental. ↑
- Both exterior wall repair and repainting — Repairing and repainting the exterior walls will improve the curb appeal and increase the property's value for both resale and rental. ↑
- Both landscaping and fencing repair — Improving the landscaping and repairing the fencing will improve the property's curb appeal and increase the property's value for both resale and rental. ↑
- Both kitchen and bathroom updates — Updating the kitchen and bathrooms will improve the property's functionality and increase the property's value for both resale and rental. ↑
- Both HVAC and mechanical system upgrades — Upgrading the HVAC and mechanical systems will improve the property's functionality and increase the property's value for both resale and rental. ↑
ⓘ Cost ranges are severity-bucket heuristics (US national rule-of-thumb). Get contractor quotes + a written scope before underwriting a rehab budget.
Schools (NCES district)
- District
- Charleroi SD
- NCES district ID
- 4205640
- Math proficiency
- 20% ▼ -19.00%
- Reading proficiency
- 51% ▼ -11.00%
- Median HH income
- $40,410
- Composite
- 29.72/100
- National rank
- #6450
- State rank
- #421 of 539 in PA
Livability — Charleroi
- Score
- 76/100
- State rank
- #382
- US rank
- #3416
Category grades
Schools grade is shown separately in the Schools card above.
Census & demographics
- Census place
- Charleroi, PA
- Population (ZIP)
- 10,044
Population outlook (Washington County) Hauer SSP2
- Today (2025)
- 208,060 people
- By 2030
- 207,168 · -0.4%
- By 2040
- 202,738 · -2.6%
- By 2050
- 195,269 · -6.1%
- By 2075
- 175,588 · -15.6%
- By 2100
- 145,827 · -29.9%
Race, ethnicity, and origin ACS 2023
- Neighborhood character
- Predominantly White (87%)
- Race & ethnicity
- White 87% Two or more races 6% Black 6%
- Common ancestry
- Romanian 8% Lithuanian 3% Scotch-Irish 2%
- Foreign-born
- 2% · Canada
- Languages at home
- 98% English-only · Spanish 1%
Political lean MEDSL · Washington
- 2024 margin
- Strong R (+25.5) · D 36.9% · R 62.4%
- 2008→2024 swing
- -20.8pp toward R · 2008: -4.7pp · 2024: -25.5pp
- All cycles
- 2024: R+25.5 2020: R+22.8 2016: R+25.3 2012: R+13.3 2008: R+4.7
Not yet ingested
- Civics
- —
Market trends
- HPI YoY
- ▼ -1.83%
- Current HPI
- 174.218
- Rent YoY
- —
- Metro
- —
- State GDP YoY
- ▲ 1.68%
- F500 in state
- 34
Industry mix (Fortune 500 HQ in PA)
| Industry | F500 HQs | Revenue |
|---|---|---|
| Healthcare | 2 | $309B |
|
||
| Insurance | 2 | $27B |
|
||
| Telecommunications / Media | 1 | $124B |
|
||
| Industrial Distribution | 1 | $22B |
|
||
| Financial Services | 1 | $20B |
|
||
| Chemicals / Materials | 1 | $18B |
|
||
Price history
1 event — show timeline
- 2026-03-28 Listed $89,900 West Penn MLS
Cash-flow waterfall
monthlySold comps — $/sqft
last 12 mo · ≤1 miLoading sold comps…