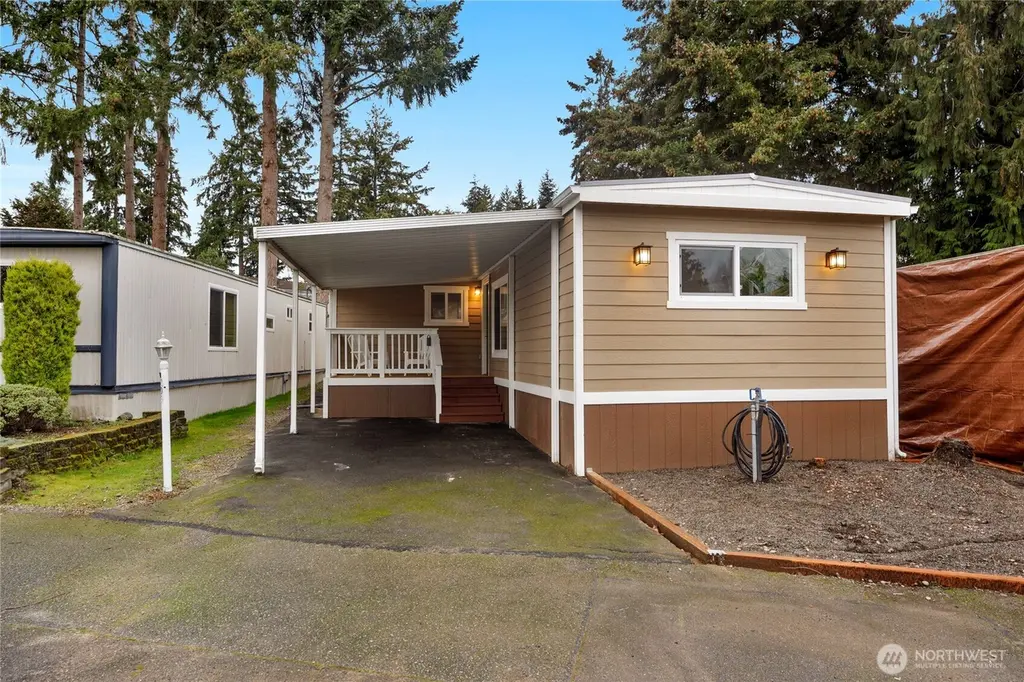
7301 NE 175th St St #209 · Kenmore, WA
Flood risk 9/10 · Severe
- FEMA flood zone
- X (unshaded)
- Chance of flooding over 30 yrs
- 0.99%
- Est. flood insurance / yr
- $507 – $1,088
Fire risk 1/10 · Minimal
- Est. fire insurance / yr
- $604 – $1,122
Heat risk 3/10 · Minor
- Hot days now (above 86°F)
- 7 days/yr
- Hot days in 30 yrs
- 16 days/yr
Wind risk 1/10 · Minimal
- Chance of severe wind over 30 yrs
- —
Air-quality risk 6/10 · Moderate
- Unhealthy air days now
- 9 days/yr
- Unhealthy air days in 30 yrs
- 9 days/yr
Risk factors via First Street. Map © Google.
Why this score? — see what drove the A- grade
The composite is a weighted blend of 9 inputs, each scored 0–100. Each bar is that input's sub-score; the figure is the points it added to the 100-point composite (weight × sub-score).
- Cash flow +30.0/30.0
- ARV discount +15.0/15.0
- 1% rule +10.0/10.0
- DSCR +10.0/10.0
- Schools +6.7/10.0
- Livability +4.3/5.0
- Rent growth +3.0/5.0
- Condition / age +2.5/5.0
- Appreciation +0.0/10.0
$150,000
🖨 Deal sheet 📄 Offer letter ✓ Due diligence
Listing remarks
Beautifully remodeled home in the desirable Inglewood East Shores 55+ Manufactured Home Park that borders the Sammamish River. Picture perfect, this home has 2 spacious bedrooms, 2 baths and the great room design includes all new kitchen and appliances, TV and living area. The park offers Community waterfront, Clubhouse, and huge dock. There's easy access to Kenmore waterfront parks, Burke Gilman trail, transit, shopping and services. Minutes to Bothell Landing and access to I-405 and quick to Eastside. With a reasonable offer Seller will contribute $2400 of selling price toward Buyer's first year's ground lease.
Key facts
- Moorage availability
- Community waterfront
- Huge dock
Tags
Neighborhood map
What this means for you Summary
Snapshot
- This is a 2-bed/2.0-bath manufactured listed at $150k.
Deal economics
- At list price, monthly cash flow is $1k ($14k/yr) — positive.
- The deal already cash-flows at list — no discount required.
- Meets the 1% rule at list price ($3k rent vs $150k).
- Recommended offer: $146k (3.0% below list) — sets the bar for market timing.
- Cap rate 16.1% vs local median 1.6% in Kenmore — top-decile yield for the area; either an underpriced asset or a hidden risk that comps aren't pricing in. Stress-test before assuming the spread holds.
Location & tenants
- Location reads 86/100 on livability (#21 in WA, #427 nationally) — a professional / high-income tenant draw. Strengths: crime A+, amenities A+, commute A+; Watch: cost of living F.
- Northshore School District (suburban): math 69% / reading 78% proficiency, ranked #9 of 291 in WA (top 3%) — strong family-tenant draw, lease renewals of 3-5y typical; only 12% free/reduced lunch — higher-income household profile.
- Market conditions: Rents rising (+2.1%/yr); 190 active listings in the ZIP; 13 comparable units currently listed for rent nearby; rentals leasing fast (median 11d on market — plan ~1-2 weeks tenant-placement turnaround); high-income renter base; 10,555 units permitted in King County in 2024 (7,119 in 5+ unit buildings).
Forward outlook
- Local home prices are declining (-3.0%/yr); year-one equity from $1k of loan paydown is wiped out by about $4k of value loss. Plan a longer hold.
- King County population projected at +44% by 2050 — long-run rental-demand tailwind backs the buy-and-hold thesis.
- At projected returns (-3.0% appreciation + 2.1% rent growth), your $42k cash investment doubles in ~4 years — after that, you're playing with house money.
Negotiation context
- It's been on market 57 days — a 3% lower offer ($146k) is reasonable based on typical stale-listing flexibility.
- 2 sale attempts since 7y ago with the ask held roughly flat each time — persistent listings suggest the price (not the market) is what's stuck; bring a comps-based counter.
- Current owner paid $67k; list at $150k implies a 124% gain — meaningful room to come down on a strong offer.
Risks & watch-outs
- Watch-outs: flood insurance adds $66/mo.
- Climate carrying-cost: severe flood risk — expect insurance premiums to compound above CPI over the hold.
Questions for the listing agent
- It's been on market 57 days. Have you received any prior offers? Is the seller open to a 3% concession, seller financing, or rate buy-down credit?
- Built in 1979 — when were the roof, HVAC, electrical panel, plumbing, and water heater last replaced?
- What's the actual annual flood-insurance premium (NFIP or private), and is the property in a SFHA with mandatory coverage?
- Is there a deadline driving the sale (1031 exchange, divorce, estate, relocation)? That informs how much negotiation room exists.
- Schools are A-rated — typically a magnet for longer-tenancy family renters. What's the average tenant stay here, and is there a school-zone premium baked into asking?
- What's the average days-on-market for RENTAL listings here right now (not sales)? A rising rental-DOM trend means longer vacancies and softer asking-rent achievability than the comps imply.
- What's the recent tenant-quality profile in this submarket — average credit score on applications, eviction rate, late-payment / NSF rate, and stable-employment percentage? A property-management company in the area should have these aggregated.
- How much new for-sale + rental construction is in the pipeline within 1–3 miles? Heavy new supply typically softens prices + rents 12–24 months out; constrained supply supports both.
Investment metrics
- 1% rule
- 1.91% ✓
- Cap rate
- 16.10%
- Cash-on-cash
- 35.03%
- DSCR
- 2.56
- GRM
- 4.4
CMA / ARV
- ARV (median comp)
- $246,500
- List price
- $150,000
- Delta
- -39.15%
- Verdict
- UNDERPRICED
- Comps
- 4 within 1.0 mi
Show comp detail 2 sales within ~0.75 mi
| Address | Dist | Beds/Ba | Sqft | Sold | Price | $/sf | Match |
|---|---|---|---|---|---|---|---|
| 7301 NE 175th St #331 | 0.07mi | 3/2.0 (+1) | 1,605 (+4%) | 3mo | $235,000 | $146 | 82 |
| 7031 NE 175th St #34 | 0.15mi | 2/2.0 | 1,400 (-9%) | 19mo | $215,000 | $154 | 62 |
Match score weights: distance 35% · size 25% · config 20% · recency 20%. Top-matched comps best support the ARV.
Projected returns pro-forma
-3.0% appreciation · 2.09% rent growth · sell at horizon
- IRR
- 27.3%
- Equity multiple
- 2.12×
- Total profit
- $47,024
- Equity at exit
- $22,365
- IRR
- 34.3%
- Equity multiple
- 4.00×
- Total profit
- $125,906
- Equity at exit
- $12,969
Cash invested: $42,000 (down + closing). Projections, not guarantees.
Landlord ↔ Tenant lean methodology
- Overall (STATE)
- 28 Tenant-Leaning
- State Washington
- 28 Tenant-Leaning · D+8
- County
- — inherits STATE
- City
- — inherits STATE
ZIP-level market 98028
- Rents YoY
- 2.1%
- Active inventory
- 190
- Price-to-rent
- 4.4×
Monthly cashflow live
- Estimated rent
- $2,864 high interval (Pro) →
- Mortgage (P&I)
- −$787
- Tax est. 1.5%
- −$188 /mo · $2,250/yr
- Insurance
- −$62
- Flood insurance flood zone
- −$66 /mo · $798/yr
- HOA
- −$0
- Vacancy / Maint / Mgmt
- −$601
- Net cashflow
- $1,159
Break-even live
UW: 25.0% down · 7.5% · 30yr · 1.5% tax · 5.0% vac · 8.0% maint · 8.0% mgmt
Financing live
Cash to close
- Down payment
- $37,500
- Closing costs
- $4,500
- Reserves months
- —
- Total cash needed
- —
Loan-product check · same deal, 3 products live
Conventional
25% down · 7.5% · 30yr
- Down + closing
- —
- Monthly P&I
- —
- Monthly cashflow
- —
- DSCR
- —
- Eligible?
- —
Personal DTI + credit; lowest rate.
DSCR
20% down · 8.5% · 30yr
- Down + closing
- —
- Monthly P&I
- —
- Monthly cashflow
- —
- DSCR
- —
- Eligible?
- —
No personal income docs; deal must DSCR.
Hard money
10% down · 12.0% · 12mo
- Down + closing
- —
- Monthly P&I
- —
- Monthly cashflow
- —
- DSCR
- —
- Eligible?
- —
Short-term bridge; refi at stabilization.
Rent comps 13 comps
| Address | Beds | Baths | Sqft | Rent | $/sqft | DOM | Units | Dist |
|---|---|---|---|---|---|---|---|---|
| 17525 80th Ave NE Kenmore, WA | 1.0–2.0 | 1.0–2.0 | 900 | $1,999 | $2.22 | 5d | 4 | 0.42mi |
| 17811 80th Ave NE Kenmore, WA | 2.0 | 2.5 | 1437 | $3,000 | $2.09 | 43d | 1 | 0.43mi |
| 17827 80th Ave NE Unit B102 Kenmore, WA | 3.0 | 2.0 | 1346 | $3,000 | $2.23 | 24d | 1 | 0.44mi |
| 17921 80th Ave NE Unit A3 Kenmore, WA | 3.0 | 2.5 | 1262 | $3,000 | $2.38 | 17d | 1 | 0.46mi |
| 6711 NE 182nd St Kenmore, WA | 1.0–2.0 | 1.0–2.0 | 899 | $2,644 | $2.94 | 3d | 10 | 0.55mi |
| 7000 NE 186th Pl Kenmore, WA | 2.0–3.0 | 2.5 | 1441 | $3,284 | $2.28 | 2d | 6 | 0.59mi |
| 8700 NE Bothell Way Bothell, WA | 1.0–3.0 | 1.0–2.0 | 1038 | $2,098 | $2.02 | 1d | 8 | 0.87mi |
| 6125 NE 175th St Unit M102 Kenmore, WA | 2.0 | 2.0 | 1462 | $3,850 | $2.63 | 23d | 1 | 0.87mi |
| 8837 NE 178th St Bothell, WA | 3.0 | 2.5 | 1965 | $3,700 | $1.88 | 10d | 1 | 0.97mi |
| 9226 NE 184th Pl Bothell, WA | 3.0 | 1.5 | 1250 | $3,900 | $3.12 | 5d | 1 | 1.31mi |
| 18530 92nd Ave NE Bothell, WA | 3.0 | 1.5 | 1680 | $3,195 | $1.90 | 14d | 1 | 1.31mi |
| 9505 NE 180th St Unit 102 Bothell, WA | 2.0 | 2.0 | 1070 | $2,595 | $2.43 | 11d | 1 | 1.38mi |
| 9525 NE 180th St Unit 303 Bothell, WA | 2.0 | 2.0 | 1080 | $2,375 | $2.20 | 5d | 1 | 1.43mi |
Listing history 20 events
-
2026-06-18days on market $150,000 Active 57 DOM
-
2026-06-17days on market $150,000 Active 56 DOM
-
2026-06-16days on market $150,000 Active 55 DOM
-
2026-06-15days on market $150,000 Active 54 DOM
-
2026-06-13days on market $150,000 Active 52 DOM
-
2026-06-13days on market $150,000 Active 51 DOM
-
2026-06-09days on market $150,000 Active 48 DOM
-
2026-06-08days on market $150,000 Active 47 DOM
-
2026-06-07days on market $150,000 Active 46 DOM
-
2026-06-04days on market $150,000 Active 43 DOM
-
2026-06-03days on market $150,000 Active 42 DOM
-
2026-06-02days on market $150,000 Active 41 DOM
-
2026-06-01days on market $150,000 Active 40 DOM
-
2026-05-31days on market $150,000 Active 39 DOM
-
2026-04-22$150,000 Active
-
2019-06-18soldstatus $67,000 Sold
-
2019-06-12status Pending
-
2019-06-04status Pending Inspection
-
2019-06-01price $72,000
-
2019-05-31$70,000 Active
ⓘ Source: listings_history table (triggers on properties + properties_extension) + one-shot
backfill from property_details.listing_events for pre-trigger history.
Climate risk First Street
- Flood 9/10 Extreme FEMA zone X (unshaded) · 99% chance over 30 yrs
- Wildfire 1/10 Low
- Heat 3/10 Moderate 7 d/yr ≥86°F today · 16 d/yr by 30 yrs out
- Wind 1/10 Low
- Air quality 6/10 Major 9 unhealthy d/yr today · 9 by 30 yrs out
Nearby sold comps map
Loading sold comps map…
Walkable amenities ~0.75 mi
Loading nearby amenities…
Taxation est. · year 1
- Rental income
- $34,367
- − Mortgage interest
- −$8,402
- − Property taxes
- −$2,250
- − Insurance
- −$1,547
- − Repairs & maintenance
- −$2,749
- − Management
- −$2,749
- − Depreciation
- −$4,364
- Taxable income
- $12,305
- Est. tax owed @ 24.0%
- −$2,953
- After-tax cash flow
- $10,960/yr
For passive investors: Depreciation is non-cash, so a rental often shows a tax loss while cash-flowing — sheltering income. Rental losses are passive: they offset passive income freely, and up to $25,000/yr can offset ordinary (W-2) income if you actively participate and your MAGI is under $100k (phasing out to $0 by $150k); unused losses carry forward. On sale, claimed depreciation is recaptured at up to 25%, and gains may owe capital-gains tax (a 1031 exchange can defer both). Figures are a year-1 estimate at your 24.0% rate — not tax advice; consult a CPA.
Schools (NCES district)
- District
- Northshore School District
- NCES district ID
- 5305910
- Math proficiency
- 69% ▼ -3.00%
- Reading proficiency
- 78% ▼ -1.00%
- Median HH income
- $92,951
- Composite
- 67.41/100
- National rank
- #826
- State rank
- #9 of 291 in WA
Livability — Kenmore
- Score
- 86/100
- State rank
- #21
- US rank
- #427
Category grades
Schools grade is shown separately in the Schools card above.
Census & demographics
- Census place
- Kenmore, WA
- County
- King County · 2,251,916 people
- City population
- 23,741
- Metro
- Seattle-Tacoma-Bellevue, WA
- Population (ZIP)
- 23,741
- Household income
- $139,764
- Rent vs Own
- Severe rent burden
- 557.0
Population outlook (King County) Hauer SSP2
- Today (2025)
- 2,576,485 people
- By 2030
- 2,803,316 · +8.8%
- By 2040
- 3,255,921 · +26.4%
- By 2050
- 3,706,444 · +43.9%
- By 2075
- 4,746,063 · +84.2%
- By 2100
- 5,407,730 · +109.9%
Race, ethnicity, and origin ACS 2023
- Neighborhood character
- Diverse neighborhood (Simpson 0.55)
- Race & ethnicity
- White 64% Asian 15% Hispanic / Latino 11% Two or more races 10% Black 3%
- Hispanic origin (detail)
- Mexican 8%
- Common ancestry
- Portuguese 5% Italian 4% Slovak 2%
- Foreign-born
- 22% · Canada, China, South Korea
- Languages at home
- 73% English-only · Spanish 7% Chinese 5% Other Indo-European 3%
Political lean MEDSL · King
- 2024 margin
- Solid D (+51.7) · D 74.2% · R 22.5% · Other 3.4%
- 2008→2024 swing
- +9.6pp toward D · 2008: 42.1pp · 2024: 51.7pp
- All cycles
- 2024: D+51.7 2020: D+52.7 2016: D+50.4 2012: D+39.9 2008: D+42.1
Not yet ingested
- Civics
- —
Market trends
- HPI YoY
- ▼ -907.61%
- Current HPI
- 392.3867
- Rent YoY
- ▲ 2.09%
- Metro
- Seattle-Tacoma-Bellevue, WA
- State GDP YoY
- ▲ 4.65%
- F500 in state
- 22
Industry mix (Fortune 500 HQ in WA)
| Industry | F500 HQs | Revenue |
|---|---|---|
| Retail | 2 | $269B |
|
||
| Technology / Retail | 1 | $638B |
|
||
| Technology | 1 | $245B |
|
||
| Telecommunications | 1 | $38B |
|
||
| Food / Beverage | 1 | $36B |
|
||
| Automotive / Trucks | 1 | $34B |
|
||
Price history
+114.3% since first listed6 events — show timeline
- 2026-04-22 Listed $150,000 NWMLS as Distributed by MLS Grid
- 2019-06-18 Sold (MLS) $67,000 NWMLS as Distributed by MLS Grid
- 2019-06-12 Pending — NWMLS as Distributed by MLS Grid
- 2019-06-04 Pending — NWMLS as Distributed by MLS Grid
- 2019-06-01 Price Changed $72,000 NWMLS as Distributed by MLS Grid
- 2019-05-31 Listed $70,000 NWMLS as Distributed by MLS Grid
Cash-flow waterfall
monthlySold comps — $/sqft
last 12 mo · ≤1 miLoading sold comps…