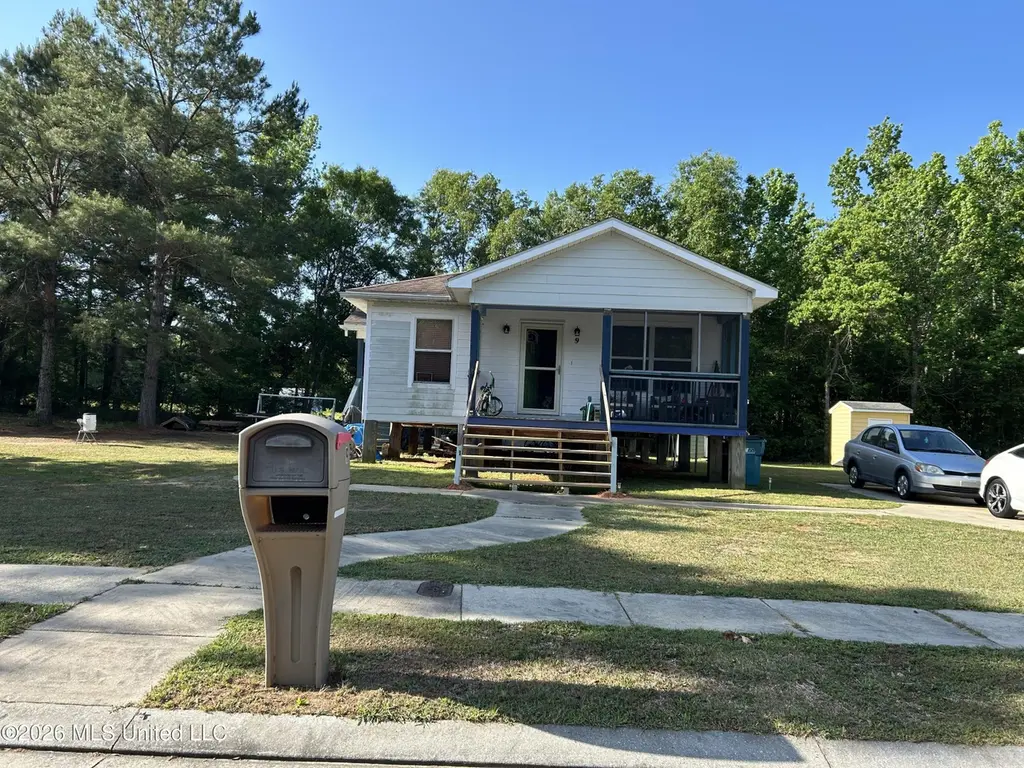
9 Thrivent Ln · Long Beach, MS
Flood risk 8/10 · Major
- FEMA flood zone
- AE
- Chance of flooding over 30 yrs
- 0.99%
- Est. flood insurance / yr
- $1,737 – $8,500
Fire risk 5/10 · Moderate
- Est. fire insurance / yr
- $1,241 – $2,305
Heat risk 10/10 · Severe
- Hot days now (above 107°F)
- 7 days/yr
- Hot days in 30 yrs
- 22 days/yr
Wind risk 9/10 · Severe
- Chance of severe wind over 30 yrs
- 99.0%
Air-quality risk 1/10 · Minimal
- Unhealthy air days now
- 0 days/yr
- Unhealthy air days in 30 yrs
- 0 days/yr
Risk factors via First Street. Map © Google.
Why this score? — see what drove the B grade
The composite is a weighted blend of 9 inputs, each scored 0–100. Each bar is that input's sub-score; the figure is the points it added to the 100-point composite (weight × sub-score).
- Cash flow +28.5/30.0
- ARV discount +15.0/15.0
- DSCR +10.0/10.0
- 1% rule +6.6/10.0
- Schools +4.4/10.0
- Livability +3.5/5.0
- Rent growth +3.0/5.0
- Condition / age +2.5/5.0
- Appreciation +0.0/10.0
$119,900
🖨 Deal sheet 📄 Offer letter ✓ Due diligence
Listing remarks
Cozy 3-bedroom, 2-bath home built in 2009 with approx. 1,200 sq ft of living space. Situated on a 0.19-acre lot in a quiet Long Beach neighborhood. Features a functional layout and storage shed. Great opportunity for investors or first-time buyers. Located in Flood Zone AE buyer to verify insurance.
Key facts
- Storage shed
- Functional layout
- 8,276 sq ft lot
Tags
Property features AI
Exterior
- Parking: Driveway
- Utilities: Public water; Public sewer; Water connected; Sewer connected
- Home design: Single-family house; One story
- Construction: Wood siding; Slab foundation; Built (year per assessor)
- Exterior features: Other exterior features (see agent for details)
Interior
- Bathrooms: 2 full bathrooms
- Heating & cooling: Central heating; Window air conditioning units
- Interior features: Appliances listed in remarks (see agent for details)
Neighborhood map
What this means for you Summary
Snapshot
- This is a 3-bed/1.0-bath single-family listed at $120k.
Deal economics
- At list price, monthly cash flow is $-35 ($-424/yr) — negative.
- To cash-flow at today's rent, offer at most $114k (5.2% below list).
- Meets the 1% rule at list price ($1k rent vs $120k).
- Recommended offer: $114k (5.2% below list) — sets the bar for cash-flow.
- Cap rate 10.2% vs local median 4.6% in Long Beach — top-decile yield for the area; either an underpriced asset or a hidden risk that comps aren't pricing in. Stress-test before assuming the spread holds.
Location & tenants
- Location reads 69/100 on livability (#52 in MS) — a middle-class / working-renter tenant base. Strengths: crime A+, cost of living A+, housing A+; Watch: amenities F, commute F, health & safety F.
- Long Beach School District (suburban): math 52% / reading 50% proficiency, ranked #9 of 130 in MS (top 7%) — acceptable for families but not a draw, mixed tenant base, ~2y average lease.
- Market conditions: Rents rising (+1.9%/yr); 311 active listings in the ZIP; 6 comparable units currently listed for rent nearby; rentals at typical pace (median 21d on market — plan ~3-4 weeks tenant-placement turnaround); 2,194 units permitted in Harrison County in 2024 (0 in 5+ unit buildings).
Forward outlook
- Local home prices are declining (-3.0%/yr); year-one equity from $829 of loan paydown is wiped out by about $4k of value loss. Plan a longer hold.
- Harrison County population projected at +27% by 2050 — long-run rental-demand tailwind backs the buy-and-hold thesis.
Negotiation context
- It's been on market 52 days — a 3% lower offer ($116k) is reasonable based on typical stale-listing flexibility.
Risks & watch-outs
- Watch-outs: flood insurance adds $427/mo.
- Climate carrying-cost: in FEMA flood zone AE (mandatory federal flood insurance); severe wind risk, 99% chance of damaging wind over 30y; moderate wildfire risk; extreme-heat days projected 7→22/yr by 2055 (HVAC capex compounding) — expect insurance premiums to compound above CPI over the hold.
Questions for the listing agent
- What do current leases actually rent for vs. the listed asking? Can we see a recent rent roll and the last 12 months of T-12 income?
- It's been on market 52 days. Have you received any prior offers? Is the seller open to a 5% concession, seller financing, or rate buy-down credit?
- What's the actual annual flood-insurance premium (NFIP or private), and is the property in a SFHA with mandatory coverage?
- Is there a deadline driving the sale (1031 exchange, divorce, estate, relocation)? That informs how much negotiation room exists.
- Schools are B-rated — typically a magnet for longer-tenancy family renters. What's the average tenant stay here, and is there a school-zone premium baked into asking?
- What's the average days-on-market for RENTAL listings here right now (not sales)? A rising rental-DOM trend means longer vacancies and softer asking-rent achievability than the comps imply.
- What's the recent tenant-quality profile in this submarket — average credit score on applications, eviction rate, late-payment / NSF rate, and stable-employment percentage? A property-management company in the area should have these aggregated.
- How much new for-sale + rental construction is in the pipeline within 1–3 miles? Heavy new supply typically softens prices + rents 12–24 months out; constrained supply supports both.
Investment metrics
- 1% rule
- 1.16% ✓
- Cap rate
- 10.21%
- Cash-on-cash
- 13.98%
- DSCR
- 1.62
- GRM
- 7.2
CMA / ARV
- ARV (median comp)
- $177,940
- List price
- $119,900
- Delta
- -32.62%
- Verdict
- UNDERPRICED
- Comps
- 20 within 1.0 mi
Show comp detail 12 sales within ~0.75 mi
| Address | Dist | Beds/Ba | Sqft | Sold | Price | $/sf | Match |
|---|---|---|---|---|---|---|---|
| 1114 Leigh St | 0.36mi | 3/2.0 | 1,203 (+3%) | 4mo | $177,500 | $148 | 71 |
| 6067 Daugherty Rd | 0.22mi | 3/1.0 | 1,256 (+7%) | 11mo | $200,000 | $159 | 68 |
| 701 Saratoga Dr | 0.36mi | 3/1.5 | 1,174 (+0%) | 19mo | $159,000 | $135 | 65 |
| 5587 Daugherty Rd | 0.25mi | 2/1.0 (-1) | 1,047 (-10%) | 4mo | $159,000 | $152 | 62 |
| 111 Warwick St | 0.24mi | 2/1.5 (-1) | 1,245 (+6%) | 12mo | $199,000 | $160 | 61 |
| 20280 Daugherty Rd | 0.60mi | 3/2.0 | 1,152 (-2%) | 14mo | $158,500 | $138 | 54 |
| 5603 Daugherty Rd | 0.19mi | 3/1.0 | 1,010 (-14%) | 18mo | $127,500 | $126 | 53 |
| 1004 Alverado Dr | 0.28mi | 3/1.5 | 1,284 (+10%) | 20mo | $169,900 | $132 | 52 |
| 606 Saratoga Dr | 0.36mi | 3/1.5 | 1,289 (+10%) | 18mo | $178,000 | $138 | 49 |
| 20243 Cliff Allen Ln | 0.66mi | 3/2.0 | 1,316 (+12%) | 5mo | $219,900 | $167 | 40 |
| 209 Shalimar Dr | 0.58mi | 3/1.5 | 1,032 (-12%) | 22mo | $100,000 | $97 | 32 |
| 108 Clower Ave | 0.70mi | 3/1.5 | 1,295 (+11%) | 24mo | $176,900 | $137 | 28 |
Match score weights: distance 35% · size 25% · config 20% · recency 20%. Top-matched comps best support the ARV.
Projected returns pro-forma
-3.0% appreciation · 1.93% rent growth · sell at horizon
- IRR
- -19.8%
- Equity multiple
- 0.32×
- Total profit
- $-22,951
- Equity at exit
- $17,877
- IRR
- -15.7%
- Equity multiple
- 0.17×
- Total profit
- $-27,986
- Equity at exit
- $10,367
Cash invested: $33,572 (down + closing). Projections, not guarantees.
Landlord ↔ Tenant lean methodology
- Overall (STATE)
- 90 Strongly Landlord-Friendly
- State Mississippi
- 90 Strongly Landlord-Friendly · R+11
- County
- — inherits STATE
- City
- — inherits STATE
ZIP-level market 39560
- Home prices YoY
- -25.7%
- Rents YoY
- 1.9%
- Active inventory
- 311
- Price-to-rent
- 7.2×
Monthly cashflow live
- Estimated rent
- $1,392 high interval (Pro) →
- Mortgage (P&I)
- −$629
- Tax from tax record
- −$30 /mo · $358/yr
- Insurance
- −$50
- Flood insurance flood zone
- −$427 /mo · $5,118/yr
- HOA
- −$0
- Vacancy / Maint / Mgmt
- −$292
- Net cashflow
- $-35
Break-even live
UW: 25.0% down · 7.5% · 30yr · 1.5% tax · 5.0% vac · 8.0% maint · 8.0% mgmt
Financing live
Cash to close
- Down payment
- $29,975
- Closing costs
- $3,597
- Reserves months
- —
- Total cash needed
- —
Loan-product check · same deal, 3 products live
Conventional
25% down · 7.5% · 30yr
- Down + closing
- —
- Monthly P&I
- —
- Monthly cashflow
- —
- DSCR
- —
- Eligible?
- —
Personal DTI + credit; lowest rate.
DSCR
20% down · 8.5% · 30yr
- Down + closing
- —
- Monthly P&I
- —
- Monthly cashflow
- —
- DSCR
- —
- Eligible?
- —
No personal income docs; deal must DSCR.
Hard money
10% down · 12.0% · 12mo
- Down + closing
- —
- Monthly P&I
- —
- Monthly cashflow
- —
- DSCR
- —
- Eligible?
- —
Short-term bridge; refi at stabilization.
Rent comps 6 comps
| Address | Beds | Baths | Sqft | Rent | $/sqft | DOM | Units | Dist |
|---|---|---|---|---|---|---|---|---|
| 20029 Sunshine Dr Long Beach, MS | 2.0 | 2.0 | 879 | $1,100 | $1.25 | 43d | 1 | 0.16mi |
| 5596 Daugherty Rd Long Beach, MS | 3.0 | 2.0 | 1144 | $1,300 | $1.14 | 13d | 1 | 0.24mi |
| 303 Twin Lakes Blvd Long Beach, MS | 3.0 | 2.0 | 1233 | $2,000 | $1.62 | 13d | 1 | 1.47mi |
| 4401 Beatline Rd Long Beach, MS | 2.0 | 2.0 | 1098 | $1,156 | $1.05 | 43d | 1 | 1.48mi |
| 4401 Beatline Rd Long Beach, MS | 2.0 | 2.0 | 1098 | $1,267 | $1.15 | 21d | 1 | 1.48mi |
| 4401 Beatline Rd Long Beach, MS | 2.0 | 2.0 | 1098 | $1,366 | $1.24 | 13d | 1 | 1.48mi |
Listing history 19 events
-
2026-06-18days on market $119,900 Active 52 DOM
-
2026-06-17days on market $119,900 Active 51 DOM
-
2026-06-16days on market $119,900 Active 50 DOM
-
2026-06-15days on market $119,900 Active 49 DOM
-
2026-06-14days on market $119,900 Active 47 DOM
-
2026-06-13days on market $119,900 Active 46 DOM
-
2026-06-10days on market $119,900 Active 44 DOM
-
2026-06-09days on market $119,900 Active 43 DOM
-
2026-06-08days on market $119,900 Active 42 DOM
-
2026-06-07pricedays on market $119,900 Active 41 DOM
-
2026-06-05days on market $129,900 Active 38 DOM
-
2026-06-02days on market $129,900 Active 36 DOM
-
2026-06-01days on market $129,900 Active 35 DOM
-
2026-05-31days on market $129,900 Active 34 DOM
-
2026-05-30days on market $129,900 Active 33 DOM
-
2026-05-13price $144,900 300-char remark
-
2026-05-07price $149,900 300-char remark
-
2026-04-27$169,900 Active 300-char remark
-
2012-04-27soldstatus
ⓘ Source: listings_history table (triggers on properties + properties_extension) + one-shot
backfill from property_details.listing_events for pre-trigger history.
Tax reassessment forecast MS · Resets to sale price
- Current annual tax
- $358 · $30/mo
- Projected year-2 tax
- $947 · $79/mo
- Expected delta
- +$589/yr (+$49/mo · 164.7%)
ⓘ Screening estimate from a state-policy table — verify with the county assessor before closing.
Climate risk First Street
- Flood 8/10 Severe FEMA zone AE · 99% chance over 30 yrs
- Wildfire 5/10 Major
- Heat 10/10 Extreme 7 d/yr ≥107°F today · 22 d/yr by 30 yrs out
- Wind 9/10 Extreme 99% chance of damaging wind over 30 yrs
- Air quality 1/10 Low 0 unhealthy d/yr today · 0 by 30 yrs out
Nearby sold comps map
Loading sold comps map…
Walkable amenities ~0.75 mi
Loading nearby amenities…
Taxation est. · year 1
- Rental income
- $16,706
- − Mortgage interest
- −$6,716
- − Property taxes
- −$358
- − Insurance
- −$5,718
- − Repairs & maintenance
- −$1,336
- − Management
- −$1,336
- − Depreciation
- −$3,488
- Taxable loss
- −$2,247
- Est. tax savings @ 24.0%
- +$539
- After-tax cash flow
- $116/yr
For passive investors: Depreciation is non-cash, so a rental often shows a tax loss while cash-flowing — sheltering income. Rental losses are passive: they offset passive income freely, and up to $25,000/yr can offset ordinary (W-2) income if you actively participate and your MAGI is under $100k (phasing out to $0 by $150k); unused losses carry forward. On sale, claimed depreciation is recaptured at up to 25%, and gains may owe capital-gains tax (a 1031 exchange can defer both). Figures are a year-1 estimate at your 24.0% rate — not tax advice; consult a CPA.
Schools (NCES district)
- District
- Long Beach School District
- NCES district ID
- 2802670
- Math proficiency
- 52% ▼ -8.00%
- Reading proficiency
- 50% ▼ -7.00%
- Median HH income
- $50,548
- Composite
- 43.68/100
- National rank
- #2955
- State rank
- #9 of 130 in MS
Livability — Long Beach
- Score
- 69/100
- State rank
- #52
- US rank
- #8554
Category grades
Schools grade is shown separately in the Schools card above.
Census & demographics
- Census place
- Long Beach, MS
- County
- Harrison County · 178,171 people
- City population
- 18,702
- Metro
- Gulfport-Biloxi, MS
- Population (ZIP)
- 18,702
- Household income
- $69,769
- Rent vs Own
- Severe rent burden
- 658.0
Population outlook (Harrison County) Hauer SSP2
- Today (2025)
- 228,444 people
- By 2030
- 241,942 · +5.9%
- By 2040
- 267,531 · +17.1%
- By 2050
- 291,062 · +27.4%
- By 2075
- 346,711 · +51.8%
- By 2100
- 378,165 · +65.5%
Race, ethnicity, and origin ACS 2023
- Neighborhood character
- Predominantly White (80%)
- Race & ethnicity
- White 80% Black 10% Two or more races 7% Hispanic / Latino 3% Asian 2%
- Common ancestry
- Lithuanian 6% Slovak 2% Serbian 1%
- Foreign-born
- 5% · Canada, South Korea
- Languages at home
- 94% English-only · Spanish 2% Other Indo-European 2% Tagalog/Filipino 1%
Political lean MEDSL · Harrison
- 2024 margin
- Strong R (+28.9) · D 35.0% · R 63.9% · Other 1.1%
- 2008→2024 swing
- -2.9pp toward R · 2008: -26.0pp · 2024: -28.9pp
- All cycles
- 2024: R+28.9 2020: R+25.2 2016: R+30.7 2012: R+26.6 2008: R+26.0
Not yet ingested
- Civics
- —
Market trends
- HPI YoY
- ▼ -67.49%
- Current HPI
- 195.0807
- Rent YoY
- ▲ 1.93%
- Metro
- Gulfport-Biloxi, MS
- State GDP YoY
- —
- F500 in state
- 0
Price history
-29.4% since first listed6 events — show timeline
- 2026-06-05 Price Changed $119,900 MLSU
- 2026-05-26 Price Changed $129,900 MLSU
- 2026-05-13 Price Changed $144,900 MLSU
- 2026-05-07 Price Changed $149,900 MLSU
- 2026-04-27 Listed $169,900 MLSU
- 2012-04-27 Sold (Public Records) — Public Records
Property tax history
-8.5%/yrLatest (2025): $358 · +0.7% YoY. Source: county tax records.
Cash-flow waterfall
monthlySold comps — $/sqft
last 12 mo · ≤1 miLoading sold comps…