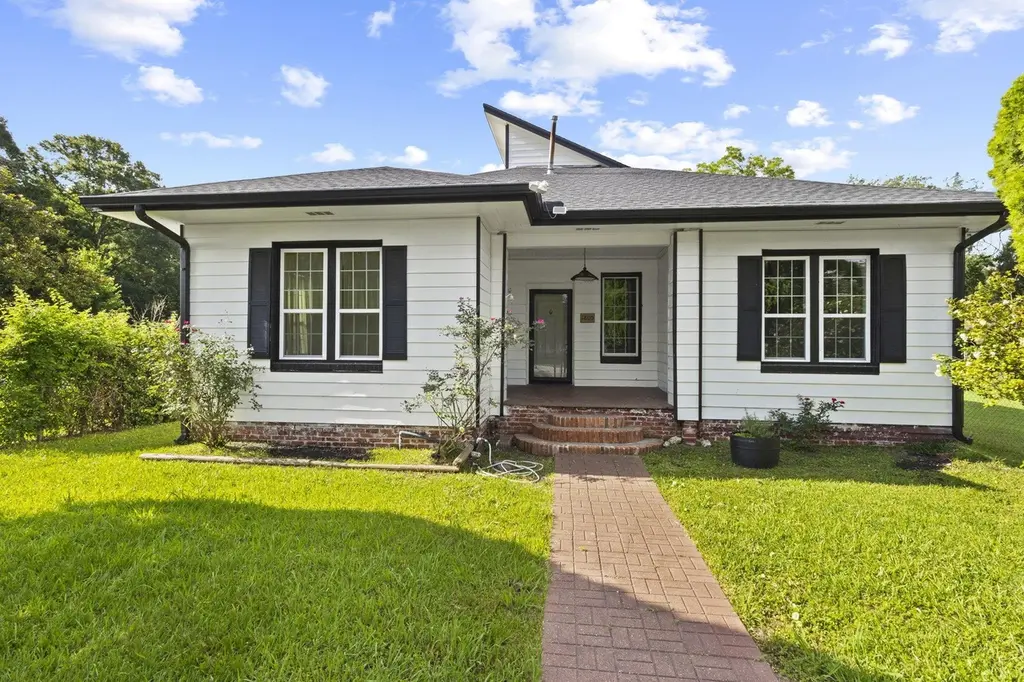
1805 Prairie St · Beaumont, TX
Flood risk 1/10 · Minimal
- FEMA flood zone
- X
- Chance of flooding over 30 yrs
- 0.0%
- Est. flood insurance / yr
- $507 – $1,088
Fire risk 1/10 · Minimal
- Est. fire insurance / yr
- $1,222 – $2,270
Heat risk 9/10 · Severe
- Hot days now (above 109°F)
- 7 days/yr
- Hot days in 30 yrs
- 24 days/yr
Wind risk 9/10 · Severe
- Chance of severe wind over 30 yrs
- 99.0%
Air-quality risk 2/10 · Minimal
- Unhealthy air days now
- 1 days/yr
- Unhealthy air days in 30 yrs
- 1 days/yr
Risk factors via First Street. Map © Google.
Why this score? — see what drove the D- grade
The composite is a weighted blend of 9 inputs, each scored 0–100. Each bar is that input's sub-score; the figure is the points it added to the 100-point composite (weight × sub-score).
- Cash flow +11.3/30.0
- Appreciation +8.1/10.0
- 1% rule +3.4/10.0
- DSCR +3.3/10.0
- Livability +3.2/5.0
- Rent growth +2.5/5.0
- Condition / age +2.5/5.0
- Schools +1.5/10.0
- ARV discount +0.0/15.0
$175,000
🖨 Deal sheet (PDF) 📄 Offer letter ✓ Due diligence
Listing remarks
Welcome to 1805 Prairie St ! Move- in ready! Home features 4 bedrooms , 2 full bathrooms, living room and a spacious den with fireplace , high ceiling for that wow factor! Recently remodeled ; newer HVAC, exterior siding , windows, floorings , paint , fixtures , bathrooms just to name a few ! Home sits on a corner lot with side gate entrance with ample parking space. Walking distance to Roberts Park , close to MLK Pkwy, stores and restaurants. Ready to take a closer look? Call now!
Key facts
- Recently remodeled
- Side gate entrance
- Spacious den
Tags
Property features AI
Finance
- Other: Publicly maintained road access
Exterior
- Utilities: Public water; Public sewer
- Home design: Single-family residence; Residential property; Located in Cartwright subdivision
- Construction: Composition roof
- Exterior features: Chain link fence; Storage structure on property
Interior
- Kitchen: Refrigerator
- Flooring: Carpet; Laminate
- Bathrooms: 2 full bathrooms
- Heating & cooling: Central heating (electric); Central air; Ceiling fans
- Interior features: Gas starter fireplace; Refrigerator included
Neighborhood map
What this means for you Summary
Snapshot
- This is a 4-bed/2.0-bath single-family listed at $175k.
Deal economics
- At list price, monthly cash flow is $-63 ($-751/yr) — negative.
- To cash-flow at today's rent, offer at most $164k (6.3% below list).
- To meet the 1% rule (rent ≥ 1% of price), the offer needs to be $146k (16.4% below list).
- Recommended offer: $146k (16.4% below list) — sets the bar for 1% rule.
Location & tenants
- Location reads 64/100 on livability (#739 in TX) — a middle-class / working-renter tenant base. Strengths: cost of living A+, housing A+, health & safety A+; Watch: employment D, crime F, amenities F.
- Beaumont ISD (urban): math 14% / reading 22% proficiency, ranked #789 of 826 in TX (top 96%) — low school quality limits family demand, transient renter base, plan for 1-2y turnover; 69% free/reduced lunch — lower-income household profile, screen leases tightly.
- Zoned schools: Charlton-Pollard El (math 12% / reading 13%, grade F, #4,167 of 4,322 statewide, top 97%, 508 students, 96% FRL); M L King Middle (math 6% / reading 12%, grade F, #1,653 of 1,662 statewide, top 99%, 480 students, 91% FRL) — zoned schools average 93% FRL vs 69% district-wide (24 pts higher); higher-poverty schools than district average — tighter screening recommended.
- Market conditions: 73 active listings in the ZIP; 13 comparable units currently listed for rent nearby; rentals at typical pace (median 25d on market — plan ~3-4 weeks tenant-placement turnaround); 343 units permitted in Jefferson County in 2024 (0 in 5+ unit buildings).
- This rent runs 36% of the median local income ($49k/yr) — at the standard rent-burdened threshold; future hikes will face affordability resistance.
Forward outlook
- In year one you build about $12k of equity ($1k loan paydown + $11k appreciation (6.2% local appreciation)).
- At projected returns (6.2% appreciation + 3.0% rent growth), your $49k cash investment doubles in ~4 years — after that, you're playing with house money.
- By year 3, paydown + projected appreciation supports a ~$30k cash-out refi (75% LTV) — recoverable capital for the next deal without selling this one.
Negotiation context
- It's been on market 18 days — a 2% lower offer ($172k) is reasonable based on typical stale-listing flexibility.
Risks & watch-outs
- Climate carrying-cost: severe wind risk, 99% chance of damaging wind over 30y; extreme-heat days projected 7→24/yr by 2055 (HVAC capex compounding) — expect insurance premiums to compound above CPI over the hold.
Questions for the listing agent
- What do current leases actually rent for vs. the listed asking? Can we see a recent rent roll and the last 12 months of T-12 income?
- Built in 1962 — when were the roof, HVAC, electrical panel, plumbing, and water heater last replaced?
- Is there a deadline driving the sale (1031 exchange, divorce, estate, relocation)? That informs how much negotiation room exists.
- Schools are D-rated, which usually means shorter tenancies and higher turnover. Who's the typical renter profile here, and what's been the actual vacancy rate?
- Crime grade is F in this area — have there been break-ins, vandalism, or insurance claims at this property in the last 3 years? What carrier currently insures it and at what premium?
- The area grade is low — what's the realistic commute time and amenity access for the typical tenant pool here? Any planned neighborhood developments (good or bad) we should know about?
- What's the average days-on-market for RENTAL listings here right now (not sales)? A rising rental-DOM trend means longer vacancies and softer asking-rent achievability than the comps imply.
- What's the recent tenant-quality profile in this submarket — average credit score on applications, eviction rate, late-payment / NSF rate, and stable-employment percentage? A property-management company in the area should have these aggregated.
- How much new for-sale + rental construction is in the pipeline within 1–3 miles? Heavy new supply typically softens prices + rents 12–24 months out; constrained supply supports both.
Investment metrics
- 1% rule
- 0.84% ✗
- Cap rate
- 5.86%
- Cash-on-cash
- -1.53%
- DSCR
- 0.93
- GRM
- 10.0
CMA / ARV
- ARV (on-the-fly)
- $129,075
- Comps found
- 3
Show comp detail 3 sales within ~0.75 mi
| Address | Dist | Beds/Ba | Sqft | Sold | Price | $/sf | Match |
|---|---|---|---|---|---|---|---|
| 2437 Avenue F | 0.30mi | 3/2.0 (-1) | 1,645 (-4%) | 4mo | $123,000 | $75 | 70 |
| 3470 Goliad St | 0.75mi | 3/2.0 (-1) | 1,496 (-13%) | 12mo | $236,500 | $158 | 28 |
| 1820 Ollie St | 0.56mi | 3/2.0 (-1) | 1,500 (-13%) | 24mo | $99,000 | $66 | 28 |
Match score weights: distance 35% · size 25% · config 20% · recency 20%. Top-matched comps best support the ARV.
Projected returns pro-forma
6.25% appreciation · 3.0% rent growth · sell at horizon
- IRR
- 14.7%
- Equity multiple
- 2.00×
- Total profit
- $49,201
- Equity at exit
- $112,811
- IRR
- 14.9%
- Equity multiple
- 4.00×
- Total profit
- $147,235
- Equity at exit
- $207,038
Cash invested: $49,000 (down + closing). Projections, not guarantees.
Landlord ↔ Tenant lean methodology
- Overall (STATE)
- 87 Strongly Landlord-Friendly
- State Texas
- 87 Strongly Landlord-Friendly · R+5
- County
- — inherits STATE
- City
- — inherits STATE
ZIP-level market 77701
- Home prices YoY
- 3.8%
- Active inventory
- 73
- Price-to-rent
- 10.0×
Monthly cashflow live
- Estimated rent
- $1,462 high interval (Pro) →
- Mortgage (P&I)
- −$918
- Tax from tax record
- −$227 /mo · $2,728/yr
- Insurance
- −$73
- HOA
- −$0
- Vacancy / Maint / Mgmt
- −$307
- Net cashflow
- $-63
Break-even live
Sensitivity live
| Price | -10% $37 | -5% $-13 | +0% $-63 | +5% $-112 | +10% $-162 |
|---|---|---|---|---|---|
| Rent | -10% $-178 | -5% $-120 | +0% $-63 | +5% $-5 | +10% $53 |
| Rate | -1.0pp $26 | -0.5pp $-18 | base $-63 | +0.5pp $-108 | +1.0pp $-154 |
UW: 25.0% down · 7.5% · 30yr · 1.5% tax · 5.0% vac · 8.0% maint · 8.0% mgmt
Financing live
Cash to close
- Down payment
- $43,750
- Closing costs
- $5,250
- Reserves months
- —
- Total cash needed
- —
Loan-product check · same deal, 3 products live
Conventional
25% down · 7.5% · 30yr
- Down + closing
- —
- Monthly P&I
- —
- Monthly cashflow
- —
- DSCR
- —
- Eligible?
- —
Personal DTI + credit; lowest rate.
DSCR
20% down · 8.5% · 30yr
- Down + closing
- —
- Monthly P&I
- —
- Monthly cashflow
- —
- DSCR
- —
- Eligible?
- —
No personal income docs; deal must DSCR.
Hard money
10% down · 12.0% · 12mo
- Down + closing
- —
- Monthly P&I
- —
- Monthly cashflow
- —
- DSCR
- —
- Eligible?
- —
Short-term bridge; refi at stabilization.
Rent comps 13 comps
| Address | Beds | Baths | Sqft | Rent | $/sqft | DOM | Units | Dist |
|---|---|---|---|---|---|---|---|---|
| 1211 Washington Blvd Beaumont, TX | 3.0 | 1.0 | 1363 | $1,200 | $0.88 | 45d | 1 | 0.42mi |
| 1107 Avenue A Beaumont, TX | 4.0 | 2.0 | 1584 | $1,395 | $0.88 | 45d | 1 | 0.87mi |
| 4090 Lou St Beaumont, TX | 3.0 | 2.0 | 1281 | $1,675 | $1.31 | 45d | 1 | 0.90mi |
| 614 Euclid St Beaumont, TX | 4.0 | 2.0 | 1378 | $1,395 | $1.01 | 25d | 1 | 0.90mi |
| 690 E Avenue Unit A Beaumont, TX | 3.0 | 1.0 | 1300 | $975 | $0.75 | 15d | 1 | 0.98mi |
| 610 Craig St Beaumont, TX | 3.0 | 2.0 | 1267 | $1,995 | $1.57 | 15d | 1 | 0.98mi |
| 4404 Raven St Beaumont, TX | 4.0 | 2.0 | 1628 | $1,600 | $0.98 | 25d | 1 | 1.05mi |
| 450 Jackson St Beaumont, TX | 3.0 | 2.0 | 1500 | $1,500 | $1.00 | 15d | 1 | 1.07mi |
| 795 Devilleneuve St Beaumont, TX | 4.0 | 2.0 | 1138 | $1,395 | $1.23 | 15d | 1 | 1.16mi |
| 3255 Waverly St Beaumont, TX | 3.0 | 2.0 | 1152 | $1,600 | $1.39 | 25d | 1 | 1.27mi |
| 2310 Morrison St Beaumont, TX | 3.0 | 2.0 | 1528 | $1,423 | $0.93 | 15d | 1 | 1.29mi |
| 4455 S 5th St Beaumont, TX | 3.0 | 2.0 | 1437 | $1,500 | $1.04 | 15d | 1 | 1.37mi |
| 365 E Irby St Beaumont, TX | 3.0 | 2.0 | 1281 | $1,495 | $1.17 | 25d | 1 | 1.50mi |
Listing history 8 events
-
2026-06-07statusdays on market $175,000 Pending 18 DOM
-
2026-06-03days on market $175,000 Active 16 DOM
-
2026-06-02days on market $175,000 Active 15 DOM
-
2026-06-01days on market $175,000 Active 14 DOM
-
2026-05-31days on market $175,000 Active 13 DOM
-
2026-05-30days on market $175,000 Active 12 DOM
-
2026-05-18$175,000 Active
-
2008-05-14soldstatus
ⓘ Source: listings_history table (triggers on properties + properties_extension) + one-shot
backfill from property_details.listing_events for pre-trigger history.
Tax reassessment forecast TX · Resets to sale price
- Current annual tax
- $2,728 · $227/mo
- Projected year-2 tax
- $3,202 · $267/mo
- Expected delta
- +$475/yr (+$40/mo · 17.4%)
ⓘ Screening estimate from a state-policy table — verify with the county assessor before closing.
Climate risk First Street
- Flood 1/10 Low FEMA zone X · 0% chance over 30 yrs
- Wildfire 1/10 Low
- Heat 9/10 Extreme 7 d/yr ≥109°F today · 24 d/yr by 30 yrs out
- Wind 9/10 Extreme 99% chance of damaging wind over 30 yrs
- Air quality 2/10 Low 1 unhealthy d/yr today · 1 by 30 yrs out
Nearby sold comps map
Loading sold comps map…
Walkable amenities ~0.75 mi
Loading nearby amenities…
Taxation est. · year 1
- Rental income
- $17,550
- − Mortgage interest
- −$9,803
- − Property taxes
- −$2,728
- − Insurance
- −$875
- − Repairs & maintenance
- −$1,404
- − Management
- −$1,404
- − Depreciation
- −$5,091
- Taxable loss
- −$3,754
- Est. tax savings @ 24.0%
- +$901
- After-tax cash flow
- $150/yr
For passive investors: Depreciation is non-cash, so a rental often shows a tax loss while cash-flowing — sheltering income. Rental losses are passive: they offset passive income freely, and up to $25,000/yr can offset ordinary (W-2) income if you actively participate and your MAGI is under $100k (phasing out to $0 by $150k); unused losses carry forward. On sale, claimed depreciation is recaptured at up to 25%, and gains may owe capital-gains tax (a 1031 exchange can defer both). Figures are a year-1 estimate at your 24.0% rate — not tax advice; consult a CPA.
Schools (NCES district)
- District
- Beaumont ISD
- NCES district ID
- 4809670
- Math proficiency
- 14% ▼ -13.00%
- Reading proficiency
- 22% ▼ -7.00%
- Median HH income
- $41,683
- Composite
- 15.43/100
- National rank
- #9316
- State rank
- #789 of 826 in TX
Livability — Beaumont
- Score
- 64/100
- State rank
- #739
- US rank
- #13710
Category grades
Schools grade is shown separately in the Schools card above.
Census & demographics
- Census place
- Beaumont, TX
- County
- Jefferson County · 203,592 people
- City population
- 125,901
- Metro
- Beaumont-Port Arthur, TX
- Population (ZIP)
- 12,381
- Household income
- $49,181
- Rent vs Own
- Severe rent burden
- 516.0
Population outlook (Jefferson County) Hauer SSP2
- Today (2025)
- 259,015 people
- By 2030
- 260,685 · +0.6%
- By 2040
- 263,309 · +1.7%
- By 2050
- 265,237 · +2.4%
- By 2075
- 270,193 · +4.3%
- By 2100
- 255,628 · -1.3%
Race, ethnicity, and origin ACS 2023
- Neighborhood character
- Diverse neighborhood (Simpson 0.60)
- Race & ethnicity
- Hispanic / Latino 44% Black 44% Two or more races 21% White 8% Asian 3%
- Hispanic origin (detail)
- Mexican 38%
- Common ancestry
- Lithuanian 1%
- Foreign-born
- 21% · Canada, Vietnam
- Languages at home
- 56% English-only · Spanish 40% Vietnamese 3%
Political lean MEDSL · Jefferson
- 2024 margin
- Lean R (+8.9) · D 45.1% · R 54.0%
- 2008→2024 swing
- -11.1pp toward R · 2008: 2.2pp · 2024: -8.9pp
- All cycles
- 2024: R+8.9 2020: R+1.6 2016: R+0.5 2012: D+1.6 2008: D+2.2
Not yet ingested
- Civics
- —
Market trends
- HPI YoY
- ▲ 6.25%
- Current HPI
- 170.1843
- Rent YoY
- —
- Metro
- Beaumont-Port Arthur, TX
- State GDP YoY
- ▲ 3.95%
- F500 in state
- 110
Industry mix (Fortune 500 HQ in TX)
| Industry | F500 HQs | Revenue |
|---|---|---|
| Energy | 16 | $1,198B |
|
||
| Technology | 5 | $198B |
|
||
| Engineering / Construction | 4 | $72B |
|
||
| Energy Services | 3 | $60B |
|
||
| Utilities | 3 | $41B |
|
||
| Healthcare | 2 | $330B |
|
||
Price history
2 events — show timeline
- 2026-05-18 Listed $175,000 BBOR
- 2008-05-14 Sold (Public Records) — Public Records
Property tax history
+8.7%/yrLatest (2025): $2,728 · -0.8% YoY. Source: county tax records.
Cash-flow waterfall
monthlySold comps — $/sqft
last 12 mo · ≤1 miLoading sold comps…