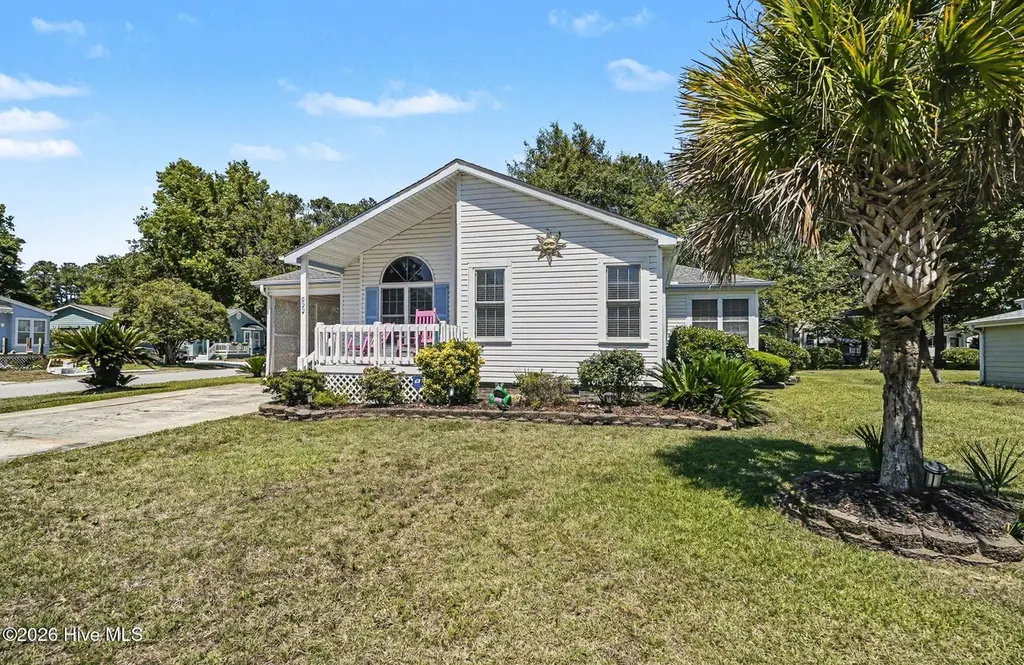
533 Leeward Way · Calabash, NC
Flood risk 1/10 · Minimal
- FEMA flood zone
- X (unshaded)
- Chance of flooding over 30 yrs
- 0.0%
- Est. flood insurance / yr
- $507 – $1,088
Fire risk 3/10 · Minor
- Est. fire insurance / yr
- $906 – $1,684
Heat risk 9/10 · Severe
- Hot days now (above 106°F)
- 7 days/yr
- Hot days in 30 yrs
- 19 days/yr
Wind risk 8/10 · Major
- Chance of severe wind over 30 yrs
- 99.0%
Air-quality risk 2/10 · Minimal
- Unhealthy air days now
- 1 days/yr
- Unhealthy air days in 30 yrs
- 1 days/yr
Risk factors via First Street. Map © Google.
Why this score? — see what drove the D- grade
The composite is a weighted blend of 9 inputs, each scored 0–100. Each bar is that input's sub-score; the figure is the points it added to the 100-point composite (weight × sub-score).
- ARV discount +11.5/15.0
- Cash flow +9.4/30.0
- Schools +3.9/10.0
- Livability +3.1/5.0
- DSCR +2.6/10.0
- Rent growth +2.5/5.0
- Condition / age +2.5/5.0
- 1% rule +1.8/10.0
- Appreciation +0.0/10.0
$289,000
🖨 Deal sheet (PDF) 📄 Offer letter ✓ Due diligence
Listing remarks MLS
This is a fabulous stick built house in charming Saltaire Village! Enjoy the clubhouse and pool.The owners did it all including a 52 foot deep well for watering.There are automatic air vents around the foundation that open and close with the seasons.This 2 bedroom house is just over 1600 sf!You have a separate dining area from the kitchen. The living room has a wonderful gas heated fireplace. The french doors lead to the den and onto the newly added Carolina Room! Corner lot and priced to sell.
Key facts
- Huge pantry
- Corner-lot home
- Oversized porch
Tags
Property features AI
Finance
- HOA & community: Homeowners association with annual fee; Annual association fee: $363 (about $30.25/month); Community clubhouse; RV/boat storage; Community pool
Exterior
- Parking: Covered carport (1 space); Concrete parking surface
- Utilities: Sewer connected; Water connected
- Home design: Single-family residence; One story; Entry level: 1
- Construction: Vinyl siding with frame construction; Shingle roof; Crawl space foundation
- Exterior features: Front and rear porch; Porch; Corner lot; Paved road access; Has a view
Interior
- Kitchen: Refrigerator; Dishwasher; Electric range; Pantry
- Bedrooms: Total rooms: 5
- Bathrooms: 2 full bathrooms; Accessible full bath
- Heating & cooling: Central air conditioning; Electric heating; Heat pump
- Interior features: Walk-in closets; Ceiling fans; Pantry; Window coverings; Unfurnished
- Laundry & utility: Washer; Dryer; Laundry located in hall; Electric water heater
Neighborhood map
What this means for you Summary
Snapshot
- This is a 2-bed/2.0-bath single-family listed at $289k.
Deal economics
- At list price, monthly cash flow is $-207 ($-2k/yr) — negative.
- To cash-flow at today's rent, offer at most $252k (12.7% below list).
- To meet the 1% rule (rent ≥ 1% of price), the offer needs to be $197k (32.0% below list).
- Recommended offer: $197k (32.0% below list) — sets the bar for 1% rule.
- Cap rate 5.4% vs local median 4.1% in Calabash — top-decile yield for the area; either an underpriced asset or a hidden risk that comps aren't pricing in. Stress-test before assuming the spread holds.
Location & tenants
- Location reads 61/100 on livability (#487 in NC) — a middle-class / working-renter tenant base. Strengths: cost of living A+, housing A+, crime A; Watch: health & safety D, amenities F, commute F.
- Brunswick County Schools (rural): math 45% / reading 47% proficiency, ranked #82 of 178 in NC (top 46%) — families likely to look elsewhere, expect single-tenant / working-renter base with shorter leases.
- Zoned schools: Jessie Mae Monroe Elementary (math 43% / reading 41%, grade F, #633 of 1,410 statewide, top 48%, 394 students, 99% FRL); Shallotte Middle (math 40% / reading 50%, grade D, #160 of 475 statewide, top 35%, 674 students, 100% FRL); West Brunswick High (math 50% / reading 56%, grade C-, #281 of 535 statewide, top 53%, 1,526 students, 100% FRL) — zoned schools average 100% FRL vs 53% district-wide (46 pts higher); higher-poverty schools than district average — tighter screening recommended.
- Market conditions: 703 active listings in the ZIP; 9 comparable units currently listed for rent nearby; rentals at typical pace (median 23d on market — plan ~3-4 weeks tenant-placement turnaround); solid renter incomes; 6,112 units permitted in Brunswick County in 2024 (990 in 5+ unit buildings).
- This rent runs 31% of the median local income ($75k/yr) — at the standard rent-burdened threshold; future hikes will face affordability resistance.
Forward outlook
- Local home prices are declining (-3.0%/yr); year-one equity from $2k of loan paydown is wiped out by about $9k of value loss. Plan a longer hold.
- Brunswick County population projected at +36% by 2050 — long-run rental-demand tailwind backs the buy-and-hold thesis.
Negotiation context
- It's been on market 31 days — a 3% lower offer ($280k) is reasonable based on typical stale-listing flexibility.
- 5 sale attempts since 19y ago with the ask held roughly flat each time — persistent listings suggest the price (not the market) is what's stuck; bring a comps-based counter.
- Current owner paid $133k; list at $289k implies a 117% gain — meaningful room to come down on a strong offer.
Risks & watch-outs
- Climate carrying-cost: severe wind risk, 99% chance of damaging wind over 30y; extreme-heat days projected 7→19/yr by 2055 (HVAC capex compounding) — expect insurance premiums to compound above CPI over the hold.
Questions for the listing agent
- What do current leases actually rent for vs. the listed asking? Can we see a recent rent roll and the last 12 months of T-12 income?
- It's been on market 31 days. Have you received any prior offers? Is the seller open to a 32% concession, seller financing, or rate buy-down credit?
- What does the HOA fee cover, when was the last increase, and are there any pending special assessments or reserve-fund shortfalls?
- Is there a deadline driving the sale (1031 exchange, divorce, estate, relocation)? That informs how much negotiation room exists.
- Schools are F-rated, which usually means shorter tenancies and higher turnover. Who's the typical renter profile here, and what's been the actual vacancy rate?
- The area grade is low — what's the realistic commute time and amenity access for the typical tenant pool here? Any planned neighborhood developments (good or bad) we should know about?
- What's the average days-on-market for RENTAL listings here right now (not sales)? A rising rental-DOM trend means longer vacancies and softer asking-rent achievability than the comps imply.
- What's the recent tenant-quality profile in this submarket — average credit score on applications, eviction rate, late-payment / NSF rate, and stable-employment percentage? A property-management company in the area should have these aggregated.
- How much new for-sale + rental construction is in the pipeline within 1–3 miles? Heavy new supply typically softens prices + rents 12–24 months out; constrained supply supports both.
Investment metrics
- 1% rule
- 0.68% ✗
- Cap rate
- 5.43%
- Cash-on-cash
- -3.07%
- DSCR
- 0.86
- GRM
- 12.2
CMA / ARV
- ARV (on-the-fly)
- $317,170
- Comps found
- 12
Show comp detail 12 sales within ~0.75 mi
| Address | Dist | Beds/Ba | Sqft | Sold | Price | $/sf | Match |
|---|---|---|---|---|---|---|---|
| 5 Calabash Ct | 0.32mi | 3/2.0 (+1) | 1,572 (-2%) | 3mo | $270,000 | $172 | 73 |
| 1027 Harbor Dr Lot 36 | 0.28mi | 3/2.0 (+1) | 1,520 (-6%) | 1mo | $292,000 | $192 | 72 |
| 1027 Harbor Dr | 0.28mi | 3/2.0 (+1) | 1,520 (-6%) | 1mo | $292,000 | $192 | 72 |
| 12 Carolina Shores Pkwy SW | 0.40mi | 2/2.0 | 1,703 (+6%) | 4mo | $260,000 | $153 | 68 |
| 2 Sage Ct | 0.46mi | 3/2.0 (+1) | 1,545 (-4%) | 3mo | $385,000 | $249 | 64 |
| 19 Sand Dollar Ct | 0.26mi | 3/2.0 (+1) | 1,781 (+11%) | 2mo | $429,000 | $241 | 64 |
| 1025 Harbor Dr Lot 37 | 0.28mi | 3/2.0 (+1) | 1,419 (-12%) | 0mo | $278,865 | $197 | 62 |
| 1017 Harbor Dr Lot 41 | 0.29mi | 3/2.0 (+1) | 1,421 (-12%) | 1mo | $255,000 | $179 | 61 |
| 5 Fairway Ct | 0.70mi | 3/2.0 (+1) | 1,602 (-0%) | 3mo | $314,900 | $197 | 59 |
| 25 Pinewood Dr | 0.50mi | 3/2.0 (+1) | 1,755 (+9%) | 2mo | $480,000 | $274 | 55 |
| 4 Pinebark Ct | 0.48mi | 3/2.0 (+1) | 1,779 (+10%) | 1mo | $330,000 | $185 | 55 |
| 12 Gate 3 | 0.73mi | 3/2.0 (+1) | 1,545 (-4%) | 3mo | $373,000 | $241 | 52 |
Match score weights: distance 35% · size 25% · config 20% · recency 20%. Top-matched comps best support the ARV.
Projected returns pro-forma
-3.0% appreciation · 3.0% rent growth · sell at horizon
- IRR
- -21.5%
- Equity multiple
- 0.26×
- Total profit
- $-60,135
- Equity at exit
- $43,091
- IRR
- -15.3%
- Equity multiple
- 0.14×
- Total profit
- $-69,817
- Equity at exit
- $24,987
Cash invested: $80,920 (down + closing). Projections, not guarantees.
Landlord ↔ Tenant lean methodology
- Overall (STATE)
- 85 Strongly Landlord-Friendly
- State North Carolina
- 85 Strongly Landlord-Friendly · R+3
- County
- — inherits STATE
- City
- — inherits STATE
ZIP-level market 28467
- Home prices YoY
- -33.7%
- Active inventory
- 703
- Price-to-rent
- 12.2×
Monthly cashflow live
- Estimated rent
- $1,966 high interval (Pro) →
- Mortgage (P&I)
- −$1,516
- Tax from tax record
- −$94 /mo · $1,134/yr
- Insurance
- −$120
- HOA
- −$30
- Vacancy / Maint / Mgmt
- −$413
- Net cashflow
- $-207
Break-even live
Sensitivity live
| Price | -10% $-43 | -5% $-125 | +0% $-207 | +5% $-289 | +10% $-371 |
|---|---|---|---|---|---|
| Rent | -10% $-362 | -5% $-285 | +0% $-207 | +5% $-129 | +10% $-52 |
| Rate | -1.0pp $-62 | -0.5pp $-134 | base $-207 | +0.5pp $-282 | +1.0pp $-358 |
UW: 25.0% down · 7.5% · 30yr · 1.5% tax · 5.0% vac · 8.0% maint · 8.0% mgmt
Financing live
Cash to close
- Down payment
- $72,250
- Closing costs
- $8,670
- Reserves months
- —
- Total cash needed
- —
Loan-product check · same deal, 3 products live
Conventional
25% down · 7.5% · 30yr
- Down + closing
- —
- Monthly P&I
- —
- Monthly cashflow
- —
- DSCR
- —
- Eligible?
- —
Personal DTI + credit; lowest rate.
DSCR
20% down · 8.5% · 30yr
- Down + closing
- —
- Monthly P&I
- —
- Monthly cashflow
- —
- DSCR
- —
- Eligible?
- —
No personal income docs; deal must DSCR.
Hard money
10% down · 12.0% · 12mo
- Down + closing
- —
- Monthly P&I
- —
- Monthly cashflow
- —
- DSCR
- —
- Eligible?
- —
Short-term bridge; refi at stabilization.
Rent comps 9 comps
| Address | Beds | Baths | Sqft | Rent | $/sqft | DOM | Units | Dist |
|---|---|---|---|---|---|---|---|---|
| 1035 Brightwater Way Calabash, NC | 1.0–3.0 | 1.0–2.5 | 1327 | $1,862 | $1.40 | 25d | 1 | 0.15mi |
| 1063 Harbor Dr Calabash, NC | 3.0 | 2.0 | 1421 | $2,200 | $1.55 | 23d | 1 | 0.45mi |
| 834 Greenwood Ct Calabash, NC | 3.0 | 2.0 | 1475 | $2,100 | $1.42 | 16d | 1 | 0.66mi |
| 660 Aubrey Ln Calabash, NC | 1.0–2.0 | 1.0–2.0 | 1081 | $2,870 | $2.65 | 16d | 69 | 0.73mi |
| 1420 Sherman Dr Calabash, NC | 2.0–3.0 | 1.0–2.0 | 1011 | $345 | $0.34 | 16d | 3 | 0.79mi |
| 891 Mh Marina Rd #3 Carolina Shores, NC | 2.0 | 2.0 | 1250 | $1,300 | $1.04 | 16d | 1 | 0.89mi |
| 2033 Wild Indigo CIR NW Calabash, NC | 3.0 | 3.0 | 1457 | $1,775 | $1.22 | 25d | 1 | 1.31mi |
| 1086 Mille Ave Calabash, NC | 3.0 | 2.0 | 1232 | $2,000 | $1.62 | 25d | 1 | 1.32mi |
| 31 Quaker Ridge Dr Calabash, NC | 2.0–3.0 | 2.0 | 1411 | $2,008 | $1.42 | 23d | 51 | 1.38mi |
HOA detail
- Monthly dues
- $30 · $360/yr
- Likely covers
- watergaspool
Listing history 29 events
-
2026-06-22days on market $289,000 Active 31 DOM
-
2026-06-18days on market $289,000 Active 28 DOM
-
2026-06-17days on market $289,000 Active 27 DOM
-
2026-06-16days on market $289,000 Active 26 DOM
-
2026-06-15days on market $289,000 Active 25 DOM
-
2026-06-14days on market $289,000 Active 23 DOM
-
2026-06-13days on market $289,000 Active 22 DOM
-
2026-06-10days on market $289,000 Active 20 DOM
-
2026-06-09days on market $289,000 Active 19 DOM
-
2026-06-08days on market $289,000 Active 18 DOM
-
2026-06-07days on market $289,000 Active 17 DOM
-
2026-06-05days on market $289,000 Active 14 DOM
-
2026-06-03days on market $289,000 Active 13 DOM
-
2026-06-02days on market $289,000 Active 12 DOM
-
2026-06-01days on market $289,000 Active 11 DOM
-
2026-05-31days on market $289,000 Active 10 DOM
-
2026-05-30days on market $289,000 Active 9 DOM
-
2026-05-21$289,000 Active
-
2026-04-25historical
-
2026-01-22price $289,000
-
2026-01-22$285,000 Active
-
2016-04-08soldstatus $133,000
-
2009-04-13soldstatus $143,500 499-char remark
Show marketing remark (499 chars)
This is a fabulous stick built house in charming Saltaire Village! Enjoy the clubhouse and pool.The owners did it all including a 52 foot deep well for watering.There are automatic air vents around the foundation that open and close with the seasons.This 2 bedroom house is just over 1600 sf!You have a separate dining area from the kitchen. The living room has a wonderful gas heated fireplace. The french doors lead to the den and onto the newly added Carolina Room! Corner lot and priced to sell.
-
2009-04-13soldstatus $143,500
Show marketing remark (499 chars)
This is a fabulous stick built house in charming Saltaire Village! Enjoy the clubhouse and pool.The owners did it all including a 52 foot deep well for watering.There are automatic air vents around the foundation that open and close with the seasons.This 2 bedroom house is just over 1600 sf!You have a separate dining area from the kitchen. The living room has a wonderful gas heated fireplace. The french doors lead to the den and onto the newly added Carolina Room! Corner lot and priced to sell.
-
2009-03-02$149,449 499-char remark
Show marketing remark (499 chars)
This is a fabulous stick built house in charming Saltaire Village! Enjoy the clubhouse and pool.The owners did it all including a 52 foot deep well for watering.There are automatic air vents around the foundation that open and close with the seasons.This 2 bedroom house is just over 1600 sf!You have a separate dining area from the kitchen. The living room has a wonderful gas heated fireplace. The french doors lead to the den and onto the newly added Carolina Room! Corner lot and priced to sell.
-
2008-10-21historical
-
2008-04-28$159,900
-
2008-02-24historical
-
2007-08-24$192,500
ⓘ Source: listings_history table (triggers on properties + properties_extension) + one-shot
backfill from property_details.listing_events for pre-trigger history.
Tax reassessment forecast NC · Resets to sale price
- Current annual tax
- $1,134 · $94/mo
- Projected year-2 tax
- $2,370 · $197/mo
- Expected delta
- +$1,236/yr (+$103/mo · 109.0%)
ⓘ Screening estimate from a state-policy table — verify with the county assessor before closing.
Climate risk First Street
- Flood 1/10 Low FEMA zone X (unshaded) · 0% chance over 30 yrs
- Wildfire 3/10 Moderate
- Heat 9/10 Extreme 7 d/yr ≥106°F today · 19 d/yr by 30 yrs out
- Wind 8/10 Severe 99% chance of damaging wind over 30 yrs
- Air quality 2/10 Low 1 unhealthy d/yr today · 1 by 30 yrs out
Nearby sold comps map
Loading sold comps map…
Walkable amenities ~0.75 mi
Loading nearby amenities…
Taxation est. · year 1
- Rental income
- $23,596
- − Mortgage interest
- −$16,188
- − Property taxes
- −$1,134
- − Insurance
- −$1,445
- − Repairs & maintenance
- −$1,888
- − Management
- −$1,888
- − HOA
- −$360
- − Depreciation
- −$8,407
- Taxable loss
- −$7,714
- Est. tax savings @ 24.0%
- +$1,851
- After-tax cash flow
- $-633/yr
For passive investors: Depreciation is non-cash, so a rental often shows a tax loss while cash-flowing — sheltering income. Rental losses are passive: they offset passive income freely, and up to $25,000/yr can offset ordinary (W-2) income if you actively participate and your MAGI is under $100k (phasing out to $0 by $150k); unused losses carry forward. On sale, claimed depreciation is recaptured at up to 25%, and gains may owe capital-gains tax (a 1031 exchange can defer both). Figures are a year-1 estimate at your 24.0% rate — not tax advice; consult a CPA.
Schools (NCES district)
- District
- Brunswick County Schools
- NCES district ID
- 3700420
- Math proficiency
- 45% ▲ 4.00%
- Reading proficiency
- 47% ▲ 4.00%
- Median HH income
- $47,494
- Composite
- 39.23/100
- National rank
- #4011
- State rank
- #82 of 178 in NC
Livability — Calabash
- Score
- 61/100
- State rank
- #487
- US rank
- #17866
Category grades
Schools grade is shown separately in the Schools card above.
Census & demographics
- Census place
- Calabash, NC
- County
- Brunswick County · 131,536 people
- Metro
- Myrtle Beach-Conway-North Myrtle Beach, SC-NC
- Population (ZIP)
- 13,313
- Household income
- $75,341
- Rent vs Own
- Severe rent burden
- 81.0
Population outlook (Brunswick County) Hauer SSP2
- Today (2025)
- 152,111 people
- By 2030
- 165,705 · +8.9%
- By 2040
- 188,494 · +23.9%
- By 2050
- 206,228 · +35.6%
- By 2075
- 237,876 · +56.4%
- By 2100
- 251,451 · +65.3%
Race, ethnicity, and origin ACS 2023
- Neighborhood character
- Predominantly White (90%)
- Race & ethnicity
- White 90% Two or more races 4% Black 3% Hispanic / Latino 2%
- Common ancestry
- Slovak 5% Romanian 5% Lithuanian 3%
- Foreign-born
- 3% · Canada
- Languages at home
- 98% English-only · Spanish 1%
Political lean MEDSL · Brunswick
- 2024 margin
- Strong R (+24.9) · D 37.2% · R 62.0%
- 2008→2024 swing
- -6.9pp toward R · 2008: -17.9pp · 2024: -24.9pp
- All cycles
- 2024: R+24.9 2020: R+25.0 2016: R+28.7 2012: R+22.2 2008: R+17.9
Not yet ingested
- Civics
- —
Market trends
- HPI YoY
- ▼ -67.90%
- Current HPI
- 133.7186
- Rent YoY
- —
- Metro
- Myrtle Beach-Conway-North Myrtle Beach, SC-NC
- State GDP YoY
- ▲ 3.28%
- F500 in state
- 26
Industry mix (Fortune 500 HQ in NC)
| Industry | F500 HQs | Revenue |
|---|---|---|
| Financial Services | 2 | $213B |
|
||
| Retail | 2 | $95B |
|
||
| Industrial Conglomerate | 1 | $38B |
|
||
| Metals / Steel | 1 | $35B |
|
||
| Utilities | 1 | $30B |
|
||
| Industrial Machinery | 1 | $19B |
|
||
Price history
+50.1% since first listed12 events — show timeline
- 2026-05-21 Listed $289,000 Hive MLS
- 2026-04-25 Listing Removed — Hive MLS
- 2026-01-22 Price Changed $289,000 Hive MLS
- 2026-01-22 Listed $285,000 Hive MLS
- 2016-04-08 Sold (Public Records) $133,000 Public Records
- 2009-04-13 Sold (Public Records) $143,500 Public Records
- 2009-04-13 Sold (MLS) $143,500 Hive MLS
- 2009-03-02 Listed $149,449 Hive MLS
- 2008-10-21 Listing Removed — Hive MLS
- 2008-04-28 Listed $159,900 Hive MLS
- 2008-02-24 Listing Removed — Hive MLS
- 2007-08-24 Listed $192,500 Hive MLS
Property tax history
+3.5%/yrLatest (2025): $1,134 · +2.5% YoY. Source: county tax records.
Cash-flow waterfall
monthlySold comps — $/sqft
last 12 mo · ≤1 miLoading sold comps…