 Multi-family
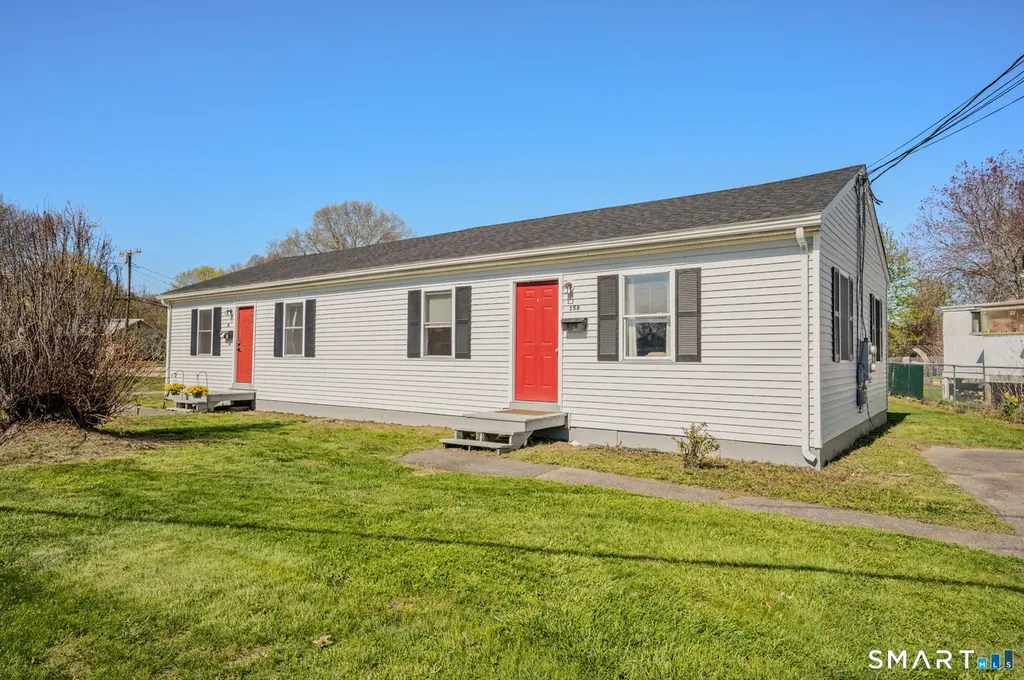
158 Midway Oval · Poquonock Bridge, CT
Flood risk No data
- FEMA flood zone
- —
- Chance of flooding over 30 yrs
- —
- Est. flood insurance / yr
- —
Fire risk No data
- Est. fire insurance / yr
- —
Heat risk No data
- Hot days now (above threshold)
- —
- Hot days in 30 yrs
- —
Wind risk No data
- Chance of severe wind over 30 yrs
- —
Air-quality risk No data
- Unhealthy air days now
- —
- Unhealthy air days in 30 yrs
- —
Risk factors via First Street. Map © Google.
Why this score? — see what drove the C grade
The composite is a weighted blend of 9 inputs, each scored 0–100. Each bar is that input's sub-score; the figure is the points it added to the 100-point composite (weight × sub-score).
- Cash flow +28.2/30.0
- DSCR +10.0/10.0
- 1% rule +6.9/10.0
- Schools +3.6/10.0
- Livability +3.6/5.0
- Rent growth +3.4/5.0
- Condition / age +2.5/5.0
- ARV discount +0.0/15.0
- Appreciation +0.0/10.0
$379,900
🖨 Deal sheet (PDF) 📄 Offer letter ✓ Due diligence
Multi-family units
County records classify this as Multi-Family (2-4 Unit). Listing-text estimate: 1 unit. estimate disagrees with records
Listing remarks
OFFER DEADLINE is TUESDAY 5/5 at NOON. Welcome to 158 - 160 Midway Oval. This property isn't just a home; it's a financial opportunity! Whether you're looking to occupy one side, or expand your real estate portfolio, this stunning multi-family home is a no-brainer. Say goodbye to the hassle of outdated heating systems, both units are equipped with electric heat; eliminating the need for a boiler or oil tank! Also, a brand-new roof ensures peace of mind. Both units have washer/dryer hook-ups and separate driveways. The home is connected to city water and city sewer. The service provider for the power & water is Groton Utilities. Enjoy being close to all the area has to offer; shopping,
Key facts
- 9,147 sq ft lot
- Built 1942
- Listed 31 days
Property features AI
Exterior
- Utilities: Public water connected; Public sewer connected; Electric service (electric hot water and heat)
- Home design: Multi-family 2-family property
- Construction: Frame construction; Block and concrete foundation
- Exterior features: Level lot; Vinyl siding; Asphalt shingle roof
Interior
- Bedrooms: 4 bedrooms (total)
- Bathrooms: 2 full bathrooms
- Heating & cooling: Electric baseboard heat
- Interior features: 8 total rooms; Crawl space basement; Has attic with access via hatch
- Laundry & utility: In-unit laundry hook-ups in each unit; 40-gallon electric hot water tank
Neighborhood map
What this means for you Summary
Snapshot
- This is a 4-bed/2.0-bath multifamily listed at $380k.
Deal economics
- At list price, monthly cash flow is $1k ($15k/yr) — positive.
- The deal already cash-flows at list — no discount required.
- Meets the 1% rule at list price ($5k rent vs $380k).
- Recommended offer: $369k (3.0% below list) — sets the bar for market timing.
Location & tenants
- Location reads 71/100 on livability (#88 in CT) — a middle-class / working-renter tenant base. Strengths: crime A+, housing A+, cost of living A; Watch: amenities F, commute F, employment F.
- Groton School District (suburban): math 32% / reading 50% proficiency, ranked #96 of 153 in CT (top 63%) — families likely to look elsewhere, expect single-tenant / working-renter base with shorter leases.
- Market conditions: Rents rising (+3.8%/yr); 92 active listings in the ZIP; 1 comparable units currently listed for rent nearby; solid renter incomes; 487 units permitted in Southeastern Connecticut Planning Region in 2024 (244 in 5+ unit buildings).
- At $4,525/mo this rent would consume 66% of the median local household income ($82k/yr) (locally 1710% of renters already pay >50% of income on rent) — very limited rent-growth headroom before tenants either downsize or default.
Forward outlook
- Local home prices are declining (-3.0%/yr); year-one equity from $3k of loan paydown is wiped out by about $11k of value loss. Plan a longer hold.
- At projected returns (-3.0% appreciation + 3.8% rent growth), your $106k cash investment doubles in ~8 years — after that, you're playing with house money.
Negotiation context
- It's been on market 31 days — a 3% lower offer ($369k) is reasonable based on typical stale-listing flexibility.
Risks & watch-outs
- Watch-outs: built in 1942 — expect roof / HVAC / electrical / plumbing capex.
Questions for the listing agent
- It's been on market 31 days. Have you received any prior offers? Is the seller open to a 3% concession, seller financing, or rate buy-down credit?
- Built in 1942 — when were the roof, HVAC, electrical panel, plumbing, and water heater last replaced?
- Is there a deadline driving the sale (1031 exchange, divorce, estate, relocation)? That informs how much negotiation room exists.
- Schools are B-rated — typically a magnet for longer-tenancy family renters. What's the average tenant stay here, and is there a school-zone premium baked into asking?
- What's the average days-on-market for RENTAL listings here right now (not sales)? A rising rental-DOM trend means longer vacancies and softer asking-rent achievability than the comps imply.
- What's the recent tenant-quality profile in this submarket — average credit score on applications, eviction rate, late-payment / NSF rate, and stable-employment percentage? A property-management company in the area should have these aggregated.
- How much new apartment / multifamily construction is in the pipeline within 1–3 miles? Heavy new supply (>2% of stock underway) typically softens rents 12–24 months out; light construction supports rent growth.
Investment metrics
- 1% rule
- 1.19% ✓
- Cap rate
- 10.12%
- Cash-on-cash
- 13.66%
- DSCR
- 1.61
- GRM
- 7.0
CMA / ARV
- ARV (median comp)
- $294,550
- List price
- $379,900
- Delta
- 28.98%
- Verdict
- OVERPRICED
- Comps
- 20 within 1.0 mi
Show comp detail 4 sales within ~0.75 mi
| Address | Dist | Beds/Ba | Sqft | Sold | Price | $/sf | Match |
|---|---|---|---|---|---|---|---|
| 158 Midway Oval | 0.00mi | 4/2.0 | 1,425 (0%) | 1mo | $386,000 | $271 | 100 |
| 18 Tacoma Ct | 0.12mi | 4/2.0 | 1,425 (0%) | 8mo | $376,500 | $264 | 88 |
| 90 Midway Oval | 0.23mi | 4/2.0 | 1,421 (-0%) | 5mo | $385,000 | $271 | 85 |
| 161 Midway Oval | 0.15mi | 4/2.0 | 1,248 (-12%) | 11mo | $260,000 | $208 | 63 |
Match score weights: distance 35% · size 25% · config 20% · recency 20%. Top-matched comps best support the ARV.
Projected returns pro-forma
-3.0% appreciation · 3.75% rent growth · sell at horizon
- IRR
- 4.6%
- Equity multiple
- 1.18×
- Total profit
- $18,936
- Equity at exit
- $56,644
- IRR
- 14.7%
- Equity multiple
- 2.22×
- Total profit
- $129,787
- Equity at exit
- $32,847
Cash invested: $106,372 (down + closing). Projections, not guarantees.
Landlord ↔ Tenant lean methodology
- Overall (STATE)
- 27 Tenant-Leaning
- State Connecticut
- 27 Tenant-Leaning · D+7
- County
- — inherits STATE
- City
- — inherits STATE
ZIP-level market 06340
- Home prices YoY
- -27.9%
- Rents YoY
- 3.8%
- Active inventory
- 92
- Price-to-rent
- 14.0×
Monthly cashflow live
- Estimated rent
- $4,525 high interval (Pro) →
- Mortgage (P&I)
- −$1,992
- Tax from tax record
- −$213 /mo · $2,555/yr
- Insurance
- −$158
- HOA
- −$0
- Vacancy / Maint / Mgmt
- −$950
- Net cashflow
- $1,211
Break-even live
Sensitivity live
| Price | -10% $1,426 | -5% $1,319 | +0% $1,211 | +5% $1,104 | +10% $996 |
|---|---|---|---|---|---|
| Rent | -10% $854 | -5% $1,033 | +0% $1,211 | +5% $1,390 | +10% $1,569 |
| Rate | -1.0pp $1,403 | -0.5pp $1,308 | base $1,211 | +0.5pp $1,113 | +1.0pp $1,013 |
2-unit breakdown (identical units grouped — click to expand)
| Units | Beds | Baths | Est. rent |
|---|---|---|---|
| 2× units | 2 | 1 | $4,526 |
| #1 | 2 | 1 | $2,263 |
| #2 | 2 | 1 | $2,263 |
| Total (2 units) | $4,525 | ||
UW: 25.0% down · 7.5% · 30yr · 1.5% tax · 5.0% vac · 8.0% maint · 8.0% mgmt
Financing live
Cash to close
- Down payment
- $94,975
- Closing costs
- $11,397
- Reserves months
- —
- Total cash needed
- —
Loan-product check · same deal, 3 products live
Conventional
25% down · 7.5% · 30yr
- Down + closing
- —
- Monthly P&I
- —
- Monthly cashflow
- —
- DSCR
- —
- Eligible?
- —
Personal DTI + credit; lowest rate.
DSCR
20% down · 8.5% · 30yr
- Down + closing
- —
- Monthly P&I
- —
- Monthly cashflow
- —
- DSCR
- —
- Eligible?
- —
No personal income docs; deal must DSCR.
Hard money
10% down · 12.0% · 12mo
- Down + closing
- —
- Monthly P&I
- —
- Monthly cashflow
- —
- DSCR
- —
- Eligible?
- —
Short-term bridge; refi at stabilization.
Rent comps 1 comps
| Address | Beds | Baths | Sqft | Rent | $/sqft | DOM | Units | Dist |
|---|---|---|---|---|---|---|---|---|
| 11 Ledgewood Rd Groton, CT | 1.0–3.0 | 1.0–3.0 | 1247 | $7,351 | $5.89 | 3d | 1 | 1.44mi |
Listing history 7 events
-
2026-06-01statusdays on market $379,900 Under Contract 31 DOM
-
2026-05-31days on market $379,900 Under Contract - Continue to Show 30 DOM
-
2026-05-30days on market $379,900 Under Contract - Continue to Show 29 DOM
-
2026-05-06historical Under Contract - Continue to Show 1026-char remark
-
2026-05-02$379,900 Active 1026-char remark
-
2026-04-27historical $379,900 1026-char remark
-
1997-05-29soldstatus $21,000
ⓘ Source: listings_history table (triggers on properties + properties_extension) + one-shot
backfill from property_details.listing_events for pre-trigger history.
Tax reassessment forecast CT · Partial reset (capped growth)
- Current annual tax
- $2,555 · $213/mo
- Projected year-2 tax
- $5,342 · $445/mo
- Expected delta
- +$2,787/yr (+$232/mo · 109.1%)
ⓘ Screening estimate from a state-policy table — verify with the county assessor before closing.
Nearby sold comps map
Loading sold comps map…
Walkable amenities ~0.75 mi
Loading nearby amenities…
Taxation est. · year 1
- Rental income
- $54,300
- − Mortgage interest
- −$21,280
- − Property taxes
- −$2,555
- − Insurance
- −$1,900
- − Repairs & maintenance
- −$4,344
- − Management
- −$4,344
- − Depreciation
- −$11,052
- Taxable income
- $8,826
- Est. tax owed @ 24.0%
- −$2,118
- After-tax cash flow
- $12,418/yr
For passive investors: Depreciation is non-cash, so a rental often shows a tax loss while cash-flowing — sheltering income. Rental losses are passive: they offset passive income freely, and up to $25,000/yr can offset ordinary (W-2) income if you actively participate and your MAGI is under $100k (phasing out to $0 by $150k); unused losses carry forward. On sale, claimed depreciation is recaptured at up to 25%, and gains may owe capital-gains tax (a 1031 exchange can defer both). Figures are a year-1 estimate at your 24.0% rate — not tax advice; consult a CPA.
Schools (NCES district)
- District
- Groton School District
- NCES district ID
- 0901770
- Math proficiency
- 32% ▼ -16.00%
- Reading proficiency
- 50% ▼ -10.00%
- Median HH income
- $60,709
- Composite
- 36.28/100
- National rank
- #4702
- State rank
- #96 of 153 in CT
Livability — Poquonock Bridge
- Score
- 71/100
- State rank
- #88
- US rank
- #6958
Category grades
Schools grade is shown separately in the Schools card above.
Census & demographics
- Census place
- Poquonock Bridge, CT
- County
- New London County · 147,197 people
- Metro
- Norwich-New London, CT
- Population (ZIP)
- 29,863
- Household income
- $81,792
- Rent vs Own
- Severe rent burden
- 1710.0
Population outlook (Southeastern Connecticut County) Hauer SSP2
- By 2040
- 293,442
Race, ethnicity, and origin ACS 2023
- Neighborhood character
- Predominantly White (66%)
- Race & ethnicity
- White 66% Hispanic / Latino 15% Two or more races 11% Asian 7% Black 6%
- Hispanic origin (detail)
- Mexican 3% Puerto Rican 7% Dominican 1%
- Common ancestry
- Romanian 5% Lithuanian 4% Slovak 3%
- Foreign-born
- 9% · Canada, Vietnam, China
- Languages at home
- 87% English-only · Spanish 6% Tagalog/Filipino 2% Other Indo-European 2%
Political lean MEDSL · Southeastern Connecticut
- 2024 margin
- D (+13.0) · D 55.6% · R 42.6% · Other 1.8%
- All cycles
- 2024: D+13.0
Not yet ingested
- Civics
- —
Market trends
- HPI YoY
- ▼ -97.61%
- Current HPI
- 252.846
- Rent YoY
- ▲ 3.75%
- Metro
- Norwich-New London, CT
- State GDP YoY
- ▲ 1.06%
- F500 in state
- 38
Industry mix (Fortune 500 HQ in CT)
| Industry | F500 HQs | Revenue |
|---|---|---|
| Industrial Machinery | 4 | $38B |
|
||
| Insurance | 3 | $71B |
|
||
| Financial Services | 2 | $25B |
|
||
| Transportation / Logistics | 2 | $18B |
|
||
| Healthcare | 1 | $247B |
|
||
| Telecommunications | 1 | $55B |
|
||
Price history
+1738.1% since first listed6 events — show timeline
- 2026-06-04 Sold (MLS) $386,000 Smart MLS
- 2026-06-01 Pending — Smart MLS
- 2026-05-06 Contingent — Smart MLS
- 2026-05-02 Listed $379,900 Smart MLS
- 2026-04-27 Coming Soon $379,900 Smart MLS
- 1997-05-29 Sold (Public Records) $21,000 Public Records
Property tax history
+1.4%/yrLatest (2022): $2,555 · +10.2% YoY. Source: county tax records.
Cash-flow waterfall
monthlySold comps — $/sqft
last 12 mo · ≤1 miLoading sold comps…