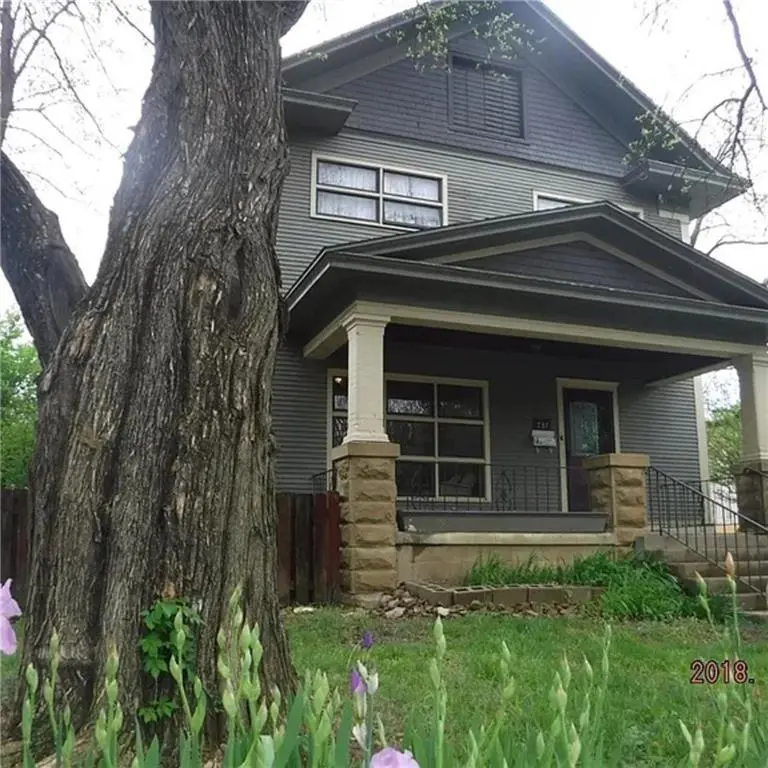
737 N Pennsylvania Ave · Independence, KS
Flood risk 1/10 · Minimal
- FEMA flood zone
- X (unshaded)
- Chance of flooding over 30 yrs
- 0.0%
- Est. flood insurance / yr
- $473 – $860
Fire risk 5/10 · Moderate
- Est. fire insurance / yr
- $1,154 – $2,142
Heat risk 6/10 · Moderate
- Hot days now (above 109°F)
- 7 days/yr
- Hot days in 30 yrs
- 19 days/yr
Wind risk 2/10 · Minimal
- Chance of severe wind over 30 yrs
- 2.0%
Air-quality risk 2/10 · Minimal
- Unhealthy air days now
- 2 days/yr
- Unhealthy air days in 30 yrs
- 2 days/yr
Risk factors via First Street. Map © Google.
Why this score? — see what drove the C grade
The composite is a weighted blend of 9 inputs, each scored 0–100. Each bar is that input's sub-score; the figure is the points it added to the 100-point composite (weight × sub-score).
- Cash flow +20.8/30.0
- ARV discount +15.0/15.0
- DSCR +6.6/10.0
- 1% rule +5.7/10.0
- Livability +3.2/5.0
- Schools +2.8/10.0
- Rent growth +2.5/5.0
- Condition / age +2.5/5.0
- Appreciation +0.0/10.0
$105,000
🖨 Deal sheet 📄 Offer letter ✓ Due diligence
Listing remarks MLS
Centrally located to down town, the city Park, & middle school. Nice two story home with with some up dates. Seller has lower the price don't miss this BARGAIN.
Key facts
- 3,920 sq ft lot
- Built 1910
- Listed 2 days
Property features AI
Finance
- Financial info: Annual tax amount $1,809
Exterior
- Parking: Other parking
- Utilities: Public water
- Home design: Single-family residence; Residential property; 2 stories; Corner lot location
- Construction: Frame construction; Composition roof; Home over 100 years old
- Exterior features: Not in a flood plain
Interior
- Bedrooms: 3 bedrooms
- Bathrooms: 1 full bathroom; 1 half bathroom
- Heating & cooling: Natural gas heating; Electric cooling (has central cooling)
- Interior features: Unfinished basement; Fireplace (1)
Neighborhood map
What this means for you Summary
Snapshot
- This is a 3-bed/1.5-bath single-family listed at $105k.
Deal economics
- At list price, monthly cash flow is $145 ($2k/yr) — positive.
- The deal already cash-flows at list — no discount required.
- Meets the 1% rule at list price ($1k rent vs $105k).
- Cap rate 7.9% vs local median 4.0% in Independence — top-decile yield for the area; either an underpriced asset or a hidden risk that comps aren't pricing in. Stress-test before assuming the spread holds.
Location & tenants
- Location reads 65/100 on livability (#285 in KS) — a middle-class / working-renter tenant base. Strengths: cost of living A+, housing A+, health & safety A-; Watch: schools D+, crime F, amenities F.
- Independence (town): math 31% / reading 36% proficiency, ranked #76 of 169 in KS (top 45%) — families likely to look elsewhere, expect single-tenant / working-renter base with shorter leases.
- Market conditions: 69 active listings in the ZIP; 10 units permitted in Montgomery County in 2024 (0 in 5+ unit buildings).
Forward outlook
- Local home prices are declining (-3.0%/yr); year-one equity from $726 of loan paydown is wiped out by about $3k of value loss. Plan a longer hold.
- Montgomery County population projected at -28% by 2050 — secular population decline; favor cash flow + early exit over multi-decade hold.
Negotiation context
- Only 3 days on market — expect competitive offers; lowballing is unlikely to land.
- 7 sale attempts since 20y ago; this cycle's ask is 14% above the opening price — seller raised mid-cycle; expect resistance to lowballs.
Risks & watch-outs
- Watch-outs: built in 1910 — expect roof / HVAC / electrical / plumbing capex.
- Climate carrying-cost: moderate wildfire risk; extreme-heat days projected 7→19/yr by 2055 (HVAC capex compounding) — expect insurance premiums to compound above CPI over the hold.
Questions for the listing agent
- Built in 1910 — when were the roof, HVAC, electrical panel, plumbing, and water heater last replaced?
- Is there a deadline driving the sale (1031 exchange, divorce, estate, relocation)? That informs how much negotiation room exists.
- Schools are D-rated, which usually means shorter tenancies and higher turnover. Who's the typical renter profile here, and what's been the actual vacancy rate?
- Crime grade is F in this area — have there been break-ins, vandalism, or insurance claims at this property in the last 3 years? What carrier currently insures it and at what premium?
- What's the average days-on-market for RENTAL listings here right now (not sales)? A rising rental-DOM trend means longer vacancies and softer asking-rent achievability than the comps imply.
- What's the recent tenant-quality profile in this submarket — average credit score on applications, eviction rate, late-payment / NSF rate, and stable-employment percentage? A property-management company in the area should have these aggregated.
- How much new for-sale + rental construction is in the pipeline within 1–3 miles? Heavy new supply typically softens prices + rents 12–24 months out; constrained supply supports both.
Investment metrics
- 1% rule
- 1.07% ✓
- Cap rate
- 7.94%
- Cash-on-cash
- 5.90%
- DSCR
- 1.26
- GRM
- 7.8
CMA / ARV
- ARV (on-the-fly)
- $133,705
- Comps found
- 12
Show comp detail 12 sales within ~0.75 mi
| Address | Dist | Beds/Ba | Sqft | Sold | Price | $/sf | Match |
|---|---|---|---|---|---|---|---|
| 713 N 9th St | 0.16mi | 4/1.5 (+1) | 1,736 (+10%) | 1mo | $139,900 | $81 | 70 |
| 1228 N 6th St | 0.37mi | 3/2.0 | 1,456 (-7%) | 1mo | $129,900 | $89 | 68 |
| 625 W Oak St | 0.55mi | 3/2.0 | 1,522 (-3%) | 1mo | $115,000 | $76 | 66 |
| 118 S 11th St | 0.61mi | 3/2.0 | 1,539 (-2%) | 2mo | $79,900 | $52 | 64 |
| 620 W Chestnut St | 0.51mi | 3/2.0 | 1,667 (+6%) | 1mo | $115,000 | $69 | 64 |
| 1015 N 2nd St | 0.44mi | 2/2.0 (-1) | 1,720 (+9%) | 1mo | $155,000 | $90 | 56 |
| 937 Circle Dr | 0.70mi | 3/2.0 | 1,657 (+5%) | 1mo | $185,000 | $112 | 56 |
| 1018 N 12th St | 0.38mi | 4/2.0 (+1) | 1,751 (+11%) | 2mo | $149,000 | $85 | 55 |
| 418 N 8th St | 0.25mi | 4/2.0 (+1) | 1,793 (+14%) | 5mo | $145,000 | $81 | 54 |
| 1400 N 9th St | 0.53mi | 3/2.5 | 1,758 (+12%) | 6mo | $179,500 | $102 | 47 |
| 919 Circle Dr | 0.66mi | 3/2.0 | 1,790 (+14%) | 3mo | $150,000 | $84 | 42 |
| 952 Crescent Dr | 0.72mi | 3/2.0 | 1,354 (-14%) | 5mo | $129,900 | $96 | 37 |
Match score weights: distance 35% · size 25% · config 20% · recency 20%. Top-matched comps best support the ARV.
Projected returns pro-forma
-3.0% appreciation · 3.0% rent growth · sell at horizon
- IRR
- -7.2%
- Equity multiple
- 0.74×
- Total profit
- $-7,779
- Equity at exit
- $15,656
- IRR
- 2.5%
- Equity multiple
- 1.18×
- Total profit
- $5,198
- Equity at exit
- $9,078
Cash invested: $29,400 (down + closing). Projections, not guarantees.
Landlord ↔ Tenant lean methodology
- Overall (STATE)
- 83 Strongly Landlord-Friendly
- State Kansas
- 83 Strongly Landlord-Friendly · R+10
- County
- — inherits STATE
- City
- — inherits STATE
ZIP-level market 67301
- Active inventory
- 69
- Price-to-rent
- 7.8×
Monthly cashflow live
- Estimated rent
- $1,126 medium interval (Pro) →
- Mortgage (P&I)
- −$551
- Tax from tax record
- −$151 /mo · $1,809/yr
- Insurance
- −$44
- HOA
- −$0
- Vacancy / Maint / Mgmt
- −$236
- Net cashflow
- $145
Break-even live
UW: 25.0% down · 7.5% · 30yr · 1.5% tax · 5.0% vac · 8.0% maint · 8.0% mgmt
Financing live
Cash to close
- Down payment
- $26,250
- Closing costs
- $3,150
- Reserves months
- —
- Total cash needed
- —
Loan-product check · same deal, 3 products live
Conventional
25% down · 7.5% · 30yr
- Down + closing
- —
- Monthly P&I
- —
- Monthly cashflow
- —
- DSCR
- —
- Eligible?
- —
Personal DTI + credit; lowest rate.
DSCR
20% down · 8.5% · 30yr
- Down + closing
- —
- Monthly P&I
- —
- Monthly cashflow
- —
- DSCR
- —
- Eligible?
- —
No personal income docs; deal must DSCR.
Hard money
10% down · 12.0% · 12mo
- Down + closing
- —
- Monthly P&I
- —
- Monthly cashflow
- —
- DSCR
- —
- Eligible?
- —
Short-term bridge; refi at stabilization.
Listing history 33 events
-
2026-06-18days on market $105,000 Active 3 DOM
-
2026-06-17days on market $105,000 Active 2 DOM
-
2026-06-16statusdays on market $105,000 Active 1 DOM
-
2026-06-15days on market $105,000 Coming Soon 19 DOM
-
2026-06-13days on market $105,000 Coming Soon 17 DOM
-
2026-06-12days on market $105,000 Coming Soon 16 DOM
-
2026-06-09days on market $105,000 Coming Soon 13 DOM
-
2026-06-08days on market $105,000 Coming Soon 12 DOM
-
2026-06-07days on market $105,000 Coming Soon 11 DOM
-
2026-06-05days on market $105,000 Coming Soon 9 DOM
-
2026-06-04days on market $105,000 Coming Soon 7 DOM
-
2026-06-02days on market $105,000 Coming Soon 6 DOM
-
2026-06-01days on market $105,000 Coming Soon 5 DOM
-
2026-05-31days on market $105,000 Coming Soon 4 DOM
-
2026-05-31days on market $105,000 Coming Soon 3 DOM
-
2026-05-27historical $105,000
-
2023-10-02historical
-
2023-08-26$92,000
-
2020-07-31soldstatus 166-char remark
Show marketing remark (166 chars)
Centrally located to down town, the city Park, & middle school. Nice two story home with with some up dates. Seller has lower the price don't miss this BARGAIN.
-
2020-07-21soldstatus
-
2018-05-03$75,500 166-char remark
Show marketing remark (166 chars)
Centrally located to down town, the city Park, & middle school. Nice two story home with with some up dates. Seller has lower the price don't miss this BARGAIN.
-
2017-03-03soldstatus
-
2017-03-02soldstatus
-
2016-07-04$79,500
-
2016-06-30historical
-
2016-01-14$79,500
-
2015-12-31historical
-
2015-03-25$84,600
-
2015-02-07historical
-
2014-08-13$97,000
-
2006-05-24soldstatus
-
2006-05-01soldstatus
-
2006-03-07$42,000
ⓘ Source: listings_history table (triggers on properties + properties_extension) + one-shot
backfill from property_details.listing_events for pre-trigger history.
Tax reassessment forecast KS · Resets to sale price
- Current annual tax
- $1,809 · $151/mo
- Projected year-2 tax
- $1,809 · $151/mo
- Expected delta
- $0/yr ($0/mo · 0.0%)
ⓘ Screening estimate from a state-policy table — verify with the county assessor before closing.
Climate risk First Street
- Flood 1/10 Low FEMA zone X (unshaded) · 0% chance over 30 yrs
- Wildfire 5/10 Major
- Heat 6/10 Major 7 d/yr ≥109°F today · 19 d/yr by 30 yrs out
- Wind 2/10 Low 2% chance of damaging wind over 30 yrs
- Air quality 2/10 Low 2 unhealthy d/yr today · 2 by 30 yrs out
Nearby sold comps map
Loading sold comps map…
Walkable amenities ~0.75 mi
Loading nearby amenities…
Taxation est. · year 1
- Rental income
- $13,514
- − Mortgage interest
- −$5,882
- − Property taxes
- −$1,809
- − Insurance
- −$525
- − Repairs & maintenance
- −$1,081
- − Management
- −$1,081
- − Depreciation
- −$3,055
- Taxable income
- $82
- Est. tax owed @ 24.0%
- −$20
- After-tax cash flow
- $1,715/yr
For passive investors: Depreciation is non-cash, so a rental often shows a tax loss while cash-flowing — sheltering income. Rental losses are passive: they offset passive income freely, and up to $25,000/yr can offset ordinary (W-2) income if you actively participate and your MAGI is under $100k (phasing out to $0 by $150k); unused losses carry forward. On sale, claimed depreciation is recaptured at up to 25%, and gains may owe capital-gains tax (a 1031 exchange can defer both). Figures are a year-1 estimate at your 24.0% rate — not tax advice; consult a CPA.
Schools (NCES district)
- District
- Independence
- NCES district ID
- 2007650
- Math proficiency
- 31% ▼ -4.00%
- Reading proficiency
- 36% ▲ 1.00%
- Median HH income
- $43,327
- Composite
- 28.45/100
- National rank
- #6750
- State rank
- #76 of 169 in KS
Livability — Independence
- Score
- 65/100
- State rank
- #285
- US rank
- #12779
Category grades
Schools grade is shown separately in the Schools card above.
Census & demographics
- Census place
- Independence, KS
- Population (ZIP)
- 12,996
Population outlook (Montgomery County) Hauer SSP2
- Today (2025)
- 29,729 people
- By 2030
- 27,786 · -6.5%
- By 2040
- 24,201 · -18.6%
- By 2050
- 21,280 · -28.4%
- By 2075
- 16,754 · -43.6%
- By 2100
- 14,088 · -52.6%
Race, ethnicity, and origin ACS 2023
- Neighborhood character
- Predominantly White (81%)
- Race & ethnicity
- White 81% Two or more races 10% Hispanic / Latino 6% Black 2% Native American 2%
- Hispanic origin (detail)
- Mexican 5%
- Common ancestry
- Lithuanian 2% Slovak 2% Italian 2%
- Foreign-born
- 2% · Canada
- Languages at home
- 96% English-only · Spanish 3% German/W. Germanic 1%
Political lean MEDSL · Montgomery
- 2024 margin
- Solid R (+51.1) · D 23.6% · R 74.7% · Other 1.8%
- 2008→2024 swing
- -15.3pp toward R · 2008: -35.8pp · 2024: -51.1pp
- All cycles
- 2024: R+51.1 2020: R+50.2 2016: R+50.8 2012: R+41.4 2008: R+35.8
Not yet ingested
- Civics
- —
Market trends
- HPI YoY
- ▼ -77.85%
- Current HPI
- 126.8212
- Rent YoY
- —
- Metro
- —
- State GDP YoY
- —
- F500 in state
- 0
Price history
+150.0% since first listed18 events — show timeline
- 2026-05-27 Coming Soon $105,000 Heartland MLS as Distributed by MLS Grid
- 2023-10-02 Listing Removed — Heartland MLS as Distributed by MLS Grid
- 2023-08-26 Listed $92,000 Heartland MLS as Distributed by MLS Grid
- 2020-07-31 Sold (MLS) — Heartland MLS as Distributed by MLS Grid
- 2020-07-21 Sold (Public Records) — Public Records
- 2018-05-03 Listed $75,500 Heartland MLS as Distributed by MLS Grid
- 2017-03-03 Sold (Public Records) — Public Records
- 2017-03-02 Sold (MLS) — Heartland MLS as Distributed by MLS Grid
- 2016-07-04 Listed $79,500 Heartland MLS as Distributed by MLS Grid
- 2016-06-30 Listing Removed — Heartland MLS as Distributed by MLS Grid
- 2016-01-14 Listed $79,500 Heartland MLS as Distributed by MLS Grid
- 2015-12-31 Listing Removed — Heartland MLS as Distributed by MLS Grid
- 2015-03-25 Listed $84,600 Heartland MLS as Distributed by MLS Grid
- 2015-02-07 Listing Removed — Heartland MLS as Distributed by MLS Grid
- 2014-08-13 Listed $97,000 Heartland MLS as Distributed by MLS Grid
- 2006-05-24 Sold (MLS) — Heartland MLS as Distributed by MLS Grid
- 2006-05-01 Sold (Public Records) — Public Records
- 2006-03-07 Listed $42,000 Heartland MLS as Distributed by MLS Grid
Property tax history
-0.0%/yrLatest (2025): $1,809 · +4.6% YoY. Source: county tax records.
Cash-flow waterfall
monthlySold comps — $/sqft
last 12 mo · ≤1 miLoading sold comps…