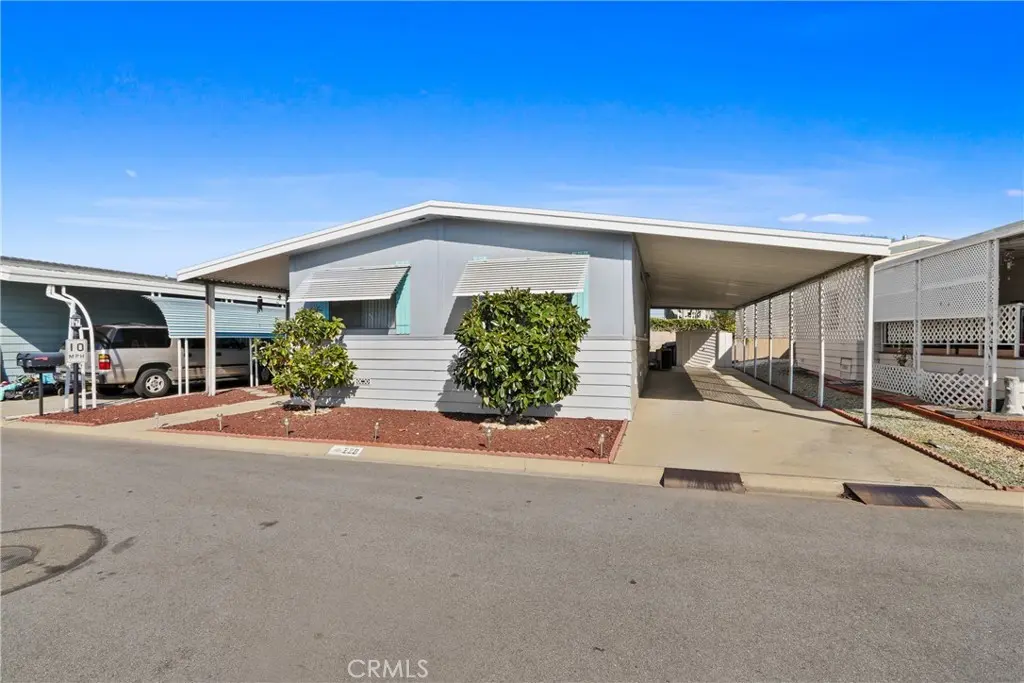
3800 Bradford St #228 · La Verne, CA
Flood risk 1/10 · Minimal
- FEMA flood zone
- X (unshaded)
- Chance of flooding over 30 yrs
- 0.0%
- Est. flood insurance / yr
- $507 – $1,088
Fire risk 8/10 · Major
- Est. fire insurance / yr
- $659 – $1,223
Heat risk 7/10 · Major
- Hot days now (above 98°F)
- 7 days/yr
- Hot days in 30 yrs
- 19 days/yr
Wind risk 1/10 · Minimal
- Chance of severe wind over 30 yrs
- —
Air-quality risk 8/10 · Major
- Unhealthy air days now
- 17 days/yr
- Unhealthy air days in 30 yrs
- 21 days/yr
Risk factors via First Street. Map © Google.
Why this score? — see what drove the B grade
The composite is a weighted blend of 9 inputs, each scored 0–100. Each bar is that input's sub-score; the figure is the points it added to the 100-point composite (weight × sub-score).
- Cash flow +29.4/30.0
- DSCR +10.0/10.0
- 1% rule +8.3/10.0
- ARV discount +7.5/15.0
- Schools +5.9/10.0
- Livability +3.8/5.0
- Condition / age +3.8/5.0
- Rent growth +3.1/5.0
- Appreciation +0.0/10.0
$216,000
🖨 Deal sheet 📄 Offer letter ✓ Due diligence
Listing remarks
Welcome Home to this Charming 2 Bed / 2 Bath double-wide with an additional flex room (ideal for office, den, or craft room). Designed with a relaxed beach-cottage vibe and a wonderful floor plan. Turn-Key- Move right in! Located in the highly desirable Twin Oaks 55+ community in La Verne. * * Interior Upgrades & Improvements * * Updated bathrooms, Luxury Vinyl Plank flooring installed in 2021. Galley kitchen with updated countertops and a farmhouse sink, New refrigerator, New dishwasher (2021). The living room is freshly painted. Touchscreen thermostat. * * Exterior & Structural Updates * * Exterior painted in 2021. New water heater. New roof coating completed in 20
Key facts
- Galley kitchen
- Updated bathrooms
- Farmhouse sink
Tags
Property features AI
Finance
- Other: Park directions: Enter park, make an immediate left up to Oak Shadow, turn right to space 228 on your left
- HOA & community: Located in Twin Oaks Mobile Home Park; Senior community; Manager approval required; Pets allowed with breed restrictions; Gutters and street lighting as community features; Monthly land lease of $761.49
Exterior
- Parking: Covered parking; Attached carport providing 3 carport spaces; Concrete driveway
- Security: Street lighting in community
- Utilities: Standard electric service; Natural gas connected; Sewer connected (public sewer); Water connected (district/public)
- Home design: Single-story (one level); Mobile home model: Prestige (24' x 44'); Faces southeast; No interior steps (accessible)
- Construction: Wood and aluminum construction; Metal roof; Aluminum skirt; Pier jacks foundation; Mobile home remains on lot
- Exterior features: Covered front porch; Covered patio; In-ground community pool; In-ground community spa; Shed on property; Block wall fencing; Back yard; Level lot with street access; Private maintained road frontage
Interior
- Kitchen: Remodeled kitchen open to family room; Gas cooktop; Gas oven; Microwave; Refrigerator; Dishwasher; Garbage disposal; Vented exhaust fan
- Bedrooms: Main floor primary bedroom; Main floor bedroom
- Flooring: Vinyl flooring
- Bathrooms: One full bathroom; One 3/4 bathroom; Remodeled bathrooms with Corian counters and shower in tub
- Heating & cooling: Central cooling; Natural gas heating; Forced air / central furnace; Gas water heater
- Interior features: Beamed ceilings; Built-in storage; Pantry; Living room deck attached; Open floor plan; Blinds and screens on windows; No interior steps; Remodeled; Turnkey condition
- Laundry & utility: Laundry area in kitchen; Utility room
Neighborhood map
What this means for you Summary
Snapshot
- This is a 2-bed/2.0-bath manufactured listed at $216k. Condition is rated good.
Deal economics
- At list price, monthly cash flow is $769 ($9k/yr) — positive.
- The deal already cash-flows at list — no discount required.
- Meets the 1% rule at list price ($3k rent vs $216k).
- Recommended offer: $210k (3.0% below list) — sets the bar for market timing.
- Cap rate 10.6% vs local median 3.0% in La Verne — top-decile yield for the area; either an underpriced asset or a hidden risk that comps aren't pricing in. Stress-test before assuming the spread holds.
Location & tenants
- Location reads 75/100 on livability (#110 in CA, #3,858 nationally) — a middle-class / working-renter tenant base. Strengths: amenities A+, employment A+, commute A; Watch: cost of living F, health & safety F.
- Bonita Unified (suburban): math 59% / reading 70% proficiency, ranked #151 of 1,400 in CA (top 11%) — acceptable for families but not a draw, mixed tenant base, ~2y average lease.
- Market conditions: Rents rising (+2.4%/yr); 94 active listings in the ZIP; 29 comparable units currently listed for rent nearby; rentals at typical pace (median 17d on market — plan ~3-4 weeks tenant-placement turnaround); solid renter incomes; 19,697 units permitted in Los Angeles County in 2024 (9,426 in 5+ unit buildings).
- This rent runs 33% of the median local income ($104k/yr) — at the standard rent-burdened threshold; future hikes will face affordability resistance.
Forward outlook
- Local home prices are declining (-3.0%/yr); year-one equity from $1k of loan paydown is wiped out by about $6k of value loss. Plan a longer hold.
- Los Angeles County population projected at +9% by 2050 — modest demand growth; plan on rents tracking national, not racing it.
- At projected returns (-3.0% appreciation + 2.4% rent growth), your $60k cash investment doubles in ~9 years — after that, you're playing with house money.
Negotiation context
- It's been on market 47 days — a 3% lower offer ($210k) is reasonable based on typical stale-listing flexibility.
Risks & watch-outs
- Climate carrying-cost: severe wildfire risk; extreme-heat days projected 7→19/yr by 2055 (HVAC capex compounding) — expect insurance premiums to compound above CPI over the hold.
Questions for the listing agent
- It's been on market 47 days. Have you received any prior offers? Is the seller open to a 3% concession, seller financing, or rate buy-down credit?
- Built in 1977 — when were the roof, HVAC, electrical panel, plumbing, and water heater last replaced?
- Is there a deadline driving the sale (1031 exchange, divorce, estate, relocation)? That informs how much negotiation room exists.
- Schools are A-rated — typically a magnet for longer-tenancy family renters. What's the average tenant stay here, and is there a school-zone premium baked into asking?
- What's the average days-on-market for RENTAL listings here right now (not sales)? A rising rental-DOM trend means longer vacancies and softer asking-rent achievability than the comps imply.
- What's the recent tenant-quality profile in this submarket — average credit score on applications, eviction rate, late-payment / NSF rate, and stable-employment percentage? A property-management company in the area should have these aggregated.
- How much new for-sale + rental construction is in the pipeline within 1–3 miles? Heavy new supply typically softens prices + rents 12–24 months out; constrained supply supports both.
Investment metrics
- 1% rule
- 1.33% ✓
- Cap rate
- 10.57%
- Cash-on-cash
- 15.26%
- DSCR
- 1.68
- GRM
- 6.3
CMA / ARV
- ARV (median comp)
- $143,163
- List price
- $216,000
- Delta
- 50.88%
- Verdict
- OVERPRICED
- Comps
- 20 within 1.0 mi
Show comp detail 8 sales within ~0.75 mi
| Address | Dist | Beds/Ba | Sqft | Sold | Price | $/sf | Match |
|---|---|---|---|---|---|---|---|
| 301 E Foothill Blvd #2 | 0.61mi | 2/2.0 | 1,080 (+2%) | 10mo | $200,000 | $185 | 59 |
| 3945 Bradford #51 | 0.21mi | 2/1.0 | 984 (-7%) | 21mo | $60,000 | $61 | 57 |
| 3727 Equation Rd #48 | 0.46mi | 2/2.0 | 1,080 (+2%) | 21mo | $198,600 | $184 | 57 |
| 301 Foothill Blvd #27 | 0.54mi | 3/2.0 (+1) | 1,040 (-2%) | 20mo | $140,000 | $135 | 50 |
| 4095 Fruit St #538 | 0.70mi | 2/2.0 | 1,152 (+9%) | 4mo | $195,000 | $169 | 49 |
| 3727 Equation Rd #106 | 0.46mi | 3/2.0 (+1) | 1,176 (+11%) | 10mo | $205,000 | $174 | 46 |
| 301 E Foothill Blvd #28 | 0.54mi | 2/1.0 | 936 (-11%) | 9mo | $152,500 | $163 | 44 |
| 301 E Foothill Blvd #13 | 0.54mi | 2/2.0 | 1,176 (+11%) | 23mo | $130,000 | $111 | 37 |
Match score weights: distance 35% · size 25% · config 20% · recency 20%. Top-matched comps best support the ARV.
Projected returns pro-forma
-3.0% appreciation · 2.35% rent growth · sell at horizon
- IRR
- 5.2%
- Equity multiple
- 1.20×
- Total profit
- $12,168
- Equity at exit
- $32,206
- IRR
- 14.1%
- Equity multiple
- 2.10×
- Total profit
- $66,314
- Equity at exit
- $18,676
Cash invested: $60,480 (down + closing). Projections, not guarantees.
Landlord ↔ Tenant lean methodology
- Overall (STATE)
- 18 Strongly Tenant-Friendly
- State California
- 18 Strongly Tenant-Friendly · D+13
- County
- — inherits STATE
- City
- — inherits STATE
ZIP-level market 91750
- Rents YoY
- 2.4%
- Active inventory
- 94
- Price-to-rent
- 6.3×
Monthly cashflow live
- Estimated rent
- $2,863 high interval (Pro) →
- Mortgage (P&I)
- −$1,133
- Tax est. 1.5%
- −$270 /mo · $3,240/yr
- Insurance
- −$90
- HOA
- −$0
- Vacancy / Maint / Mgmt
- −$601
- Net cashflow
- $769
Break-even live
UW: 25.0% down · 7.5% · 30yr · 1.5% tax · 5.0% vac · 8.0% maint · 8.0% mgmt
Financing live
Cash to close
- Down payment
- $54,000
- Closing costs
- $6,480
- Reserves months
- —
- Total cash needed
- —
Loan-product check · same deal, 3 products live
Conventional
25% down · 7.5% · 30yr
- Down + closing
- —
- Monthly P&I
- —
- Monthly cashflow
- —
- DSCR
- —
- Eligible?
- —
Personal DTI + credit; lowest rate.
DSCR
20% down · 8.5% · 30yr
- Down + closing
- —
- Monthly P&I
- —
- Monthly cashflow
- —
- DSCR
- —
- Eligible?
- —
No personal income docs; deal must DSCR.
Hard money
10% down · 12.0% · 12mo
- Down + closing
- —
- Monthly P&I
- —
- Monthly cashflow
- —
- DSCR
- —
- Eligible?
- —
Short-term bridge; refi at stabilization.
Rent comps 29 comps
| Address | Beds | Baths | Sqft | Rent | $/sqft | DOM | Units | Dist |
|---|---|---|---|---|---|---|---|---|
| 2855 Foothill Blvd La Verne, CA | 1.0 | 1.0 | 765 | $2,622 | $3.43 | 1d | 3 | 0.22mi |
| 450 W Foothill Blvd Pomona, CA | 2.0 | 1.0–2.0 | 773 | $2,565 | $3.32 | 1d | 8 | 0.29mi |
| 3816 Verdana Cir La Verne, CA | 2.0 | 2.5 | 1243 | $3,300 | $2.65 | 18d | 1 | 0.42mi |
| 2577 Sycamore Dr La Verne, CA | 3.0 | 2.0 | 1350 | $2,895 | $2.14 | 43d | 1 | 0.46mi |
| 3836 Verdana Cir La Verne, CA | 2.0 | 2.5 | 1243 | $3,500 | $2.82 | 43d | 1 | 0.46mi |
| 3748 Verdana Cir La Verne, CA | 3.0 | 3.0 | 1493 | $4,500 | $3.01 | 15d | 1 | 0.49mi |
| 150 Drake St Pomona, CA | 2.0 | 2.0 | 924 | $2,514 | $2.72 | 1d | 2 | 0.56mi |
| 2429 College Ln La Verne, CA | 2.0 | 1.0 | 836 | $2,350 | $2.81 | 43d | 1 | 0.60mi |
| 235 W Grove St Pomona, CA | 1.0–2.0 | 1.0–2.0 | 800 | $2,576 | $3.22 | 1d | 10 | 0.63mi |
| 2366 Lomeli Ln La Verne, CA | 2.0 | 1.0 | 836 | $2,470 | $2.95 | 43d | 1 | 0.70mi |
| 3636 Sumner Ave #210 Pomona, CA | 2.0 | 2.0 | 1290 | $2,400 | $1.86 | 6d | 1 | 0.74mi |
| 3054 Gladstone St #4 Pomona, CA | 2.0 | 1.0 | 933 | $2,500 | $2.68 | 7d | 1 | 0.76mi |
| 2408 Pepper St La Verne, CA | 2.0 | 1.0 | 836 | $2,650 | $3.17 | 24d | 1 | 0.77mi |
| 2063 Evergreen St La Verne, CA | 3.0 | 2.0 | 1300 | $3,200 | $2.46 | 43d | 1 | 0.83mi |
| 2064 Evergreen St La Verne, CA | 2.0 | 2.0 | 960 | $2,400 | $2.50 | 17d | 1 | 0.84mi |
| 2958 Gramercy St Pomona, CA | 3.0 | 2.0 | 1364 | $3,350 | $2.46 | 6d | 1 | 0.86mi |
| 2042 Evergreen St La Verne, CA | 2.0 | 1.0 | 825 | $2,150 | $2.61 | 43d | 1 | 0.87mi |
| 1825 Foothill Blvd La Verne, CA | 1.0–2.0 | 1.0–2.0 | 878 | $2,861 | $3.26 | 1d | 15 | 0.97mi |
| 3357 Butterfield Ave La Verne, CA | 1.0 | 1.0 | 750 | $1,850 | $2.47 | 43d | 1 | 1.00mi |
| 1051 Amador St Claremont, CA | 3.0 | 2.0 | 1469 | $4,200 | $2.86 | 1d | 1 | 1.11mi |
| 1623 Heather Dr La Verne, CA | 3.0 | 1.5 | 1121 | $3,250 | $2.90 | 18d | 1 | 1.17mi |
| 3807 Abbey Way La Verne, CA | 3.0 | 2.0 | 1159 | $3,150 | $2.72 | 43d | 1 | 1.18mi |
| 2728 Crozier Ct Pomona, CA | 3.0 | 3.0 | 1497 | $3,295 | $2.20 | 1d | 1 | 1.22mi |
| 2771 N Garey Ave Pomona, CA | 1.0–3.0 | 1.0–2.0 | 1065 | $2,930 | $2.75 | 1d | 8 | 1.23mi |
| 2707 Erebus Ct Pomona, CA | 3.0 | 3.0 | 1497 | $3,400 | $2.27 | 43d | 1 | 1.25mi |
| 795 Hazel Way Pomona, CA | 3.0 | 3.0 | 1401 | $3,100 | $2.21 | 10d | 1 | 1.38mi |
| 1886 Bonita Ave La Verne, CA | 2.0 | 1.0 | 777 | $2,895 | $3.73 | 43d | 1 | 1.41mi |
| 2870 N Towne Ave Pomona, CA | 2.0 | 1.0–2.0 | 725 | $2,500 | $3.45 | 4d | 4 | 1.48mi |
| 245 E Grevillia St Pomona, CA | 2.0 | 1.0 | 988 | $2,400 | $2.43 | 43d | 1 | 1.49mi |
Listing history 15 events
-
2026-06-18days on market $216,000 Active 47 DOM
-
2026-06-17days on market $216,000 Active 46 DOM
-
2026-06-16days on market $216,000 Active 45 DOM
-
2026-06-15days on market $216,000 Active 44 DOM
-
2026-06-13days on market $216,000 Active 42 DOM
-
2026-06-13days on market $216,000 Active 41 DOM
-
2026-06-09days on market $216,000 Active 38 DOM
-
2026-06-08days on market $216,000 Active 37 DOM
-
2026-06-07days on market $216,000 Active 36 DOM
-
2026-06-04days on market $216,000 Active 33 DOM
-
2026-06-03days on market $216,000 Active 32 DOM
-
2026-06-02days on market $216,000 Active 31 DOM
-
2026-06-01days on market $216,000 Active 30 DOM
-
2026-05-31days on market $216,000 Active 29 DOM
-
2026-05-02$216,000 Active 1298-char remark
ⓘ Source: listings_history table (triggers on properties + properties_extension) + one-shot
backfill from property_details.listing_events for pre-trigger history.
Climate risk First Street
- Flood 1/10 Low FEMA zone X (unshaded) · 0% chance over 30 yrs
- Wildfire 8/10 Severe
- Heat 7/10 Severe 7 d/yr ≥98°F today · 19 d/yr by 30 yrs out
- Wind 1/10 Low
- Air quality 8/10 Severe 17 unhealthy d/yr today · 21 by 30 yrs out
Nearby sold comps map
Loading sold comps map…
Walkable amenities ~0.75 mi
Loading nearby amenities…
Taxation est. · year 1
- Rental income
- $34,357
- − Mortgage interest
- −$12,099
- − Property taxes
- −$3,240
- − Insurance
- −$1,080
- − Repairs & maintenance
- −$2,749
- − Management
- −$2,749
- − Depreciation
- −$6,284
- Taxable income
- $6,157
- Est. tax owed @ 24.0%
- −$1,478
- After-tax cash flow
- $7,752/yr
For passive investors: Depreciation is non-cash, so a rental often shows a tax loss while cash-flowing — sheltering income. Rental losses are passive: they offset passive income freely, and up to $25,000/yr can offset ordinary (W-2) income if you actively participate and your MAGI is under $100k (phasing out to $0 by $150k); unused losses carry forward. On sale, claimed depreciation is recaptured at up to 25%, and gains may owe capital-gains tax (a 1031 exchange can defer both). Figures are a year-1 estimate at your 24.0% rate — not tax advice; consult a CPA.
Condition & rehab AI · 12 photos
This charming 2-bedroom, 2-bathroom manufactured home in a desirable community is move-in ready with recent updates and improvements.
Value-add opportunities
- Both Paint exterior — Enhances curb appeal and value
- Both Replace outdoor light fixtures — Improves safety and aesthetics
Renovation cost estimate screening
Value-add ROI direction
- Both Paint exterior — Enhances curb appeal and value ↑
- Both Replace outdoor light fixtures — Improves safety and aesthetics ↑
ⓘ Cost ranges are severity-bucket heuristics (US national rule-of-thumb). Get contractor quotes + a written scope before underwriting a rehab budget.
Schools (NCES district)
- District
- Bonita Unified
- NCES district ID
- 0605610
- Math proficiency
- 59% ▲ 3.00%
- Reading proficiency
- 70% ▬ 0.00%
- Median HH income
- $76,196
- Composite
- 58.71/100
- National rank
- #2001
- State rank
- #151 of 1400 in CA
Livability — La Verne
- Score
- 75/100
- State rank
- #110
- US rank
- #3858
Category grades
Schools grade is shown separately in the Schools card above.
Census & demographics
- Census place
- La Verne, CA
- County
- Los Angeles County · 9,444,647 people
- City population
- 32,692
- Metro
- Los Angeles-Long Beach-Anaheim, CA
- Population (ZIP)
- 32,692
- Household income
- $104,195
- Rent vs Own
- Severe rent burden
- 872.0
Population outlook (Los Angeles County) Hauer SSP2
- Today (2025)
- 10,940,515 people
- By 2030
- 11,256,481 · +2.9%
- By 2040
- 11,729,929 · +7.2%
- By 2050
- 11,948,407 · +9.2%
- By 2075
- 11,818,114 · +8.0%
- By 2100
- 10,842,928 · -0.9%
Race, ethnicity, and origin ACS 2023
- Neighborhood character
- Diverse neighborhood (Simpson 0.67)
- Race & ethnicity
- White 44% Hispanic / Latino 36% Two or more races 20% Asian 10% Black 4%
- Hispanic origin (detail)
- Mexican 31%
- Common ancestry
- Lithuanian 3% Slovak 2% Romanian 1%
- Foreign-born
- 17% · Canada, China, South Korea
- Languages at home
- 75% English-only · Spanish 12% Chinese 3% Other Indo-European 3%
Political lean MEDSL · Los Angeles
- 2024 margin
- Solid D (+32.9) · D 64.8% · R 31.9% · Other 3.3%
- 2008→2024 swing
- -7.4pp toward R · 2008: 40.4pp · 2024: 32.9pp
- All cycles
- 2024: D+32.9 2020: D+44.2 2016: D+48.0 2012: D+40.0 2008: D+40.4
Not yet ingested
- Civics
- —
Market trends
- HPI YoY
- ▼ -729.79%
- Current HPI
- 373.7761
- Rent YoY
- ▲ 2.35%
- Metro
- Los Angeles-Long Beach-Anaheim, CA
- State GDP YoY
- ▲ 3.21%
- F500 in state
- 116
Industry mix (Fortune 500 HQ in CA)
| Industry | F500 HQs | Revenue |
|---|---|---|
| Technology | 27 | $1,492B |
|
||
| Financial Services | 3 | $174B |
|
||
| Retail | 3 | $44B |
|
||
| Insurance | 3 | $26B |
|
||
| Media / Entertainment | 2 | $115B |
|
||
| Pharmaceuticals / Biotech | 2 | $62B |
|
||
Price history
1 event — show timeline
- 2026-05-02 Listed $216,000 CRMLS
Cash-flow waterfall
monthlySold comps — $/sqft
last 12 mo · ≤1 miLoading sold comps…