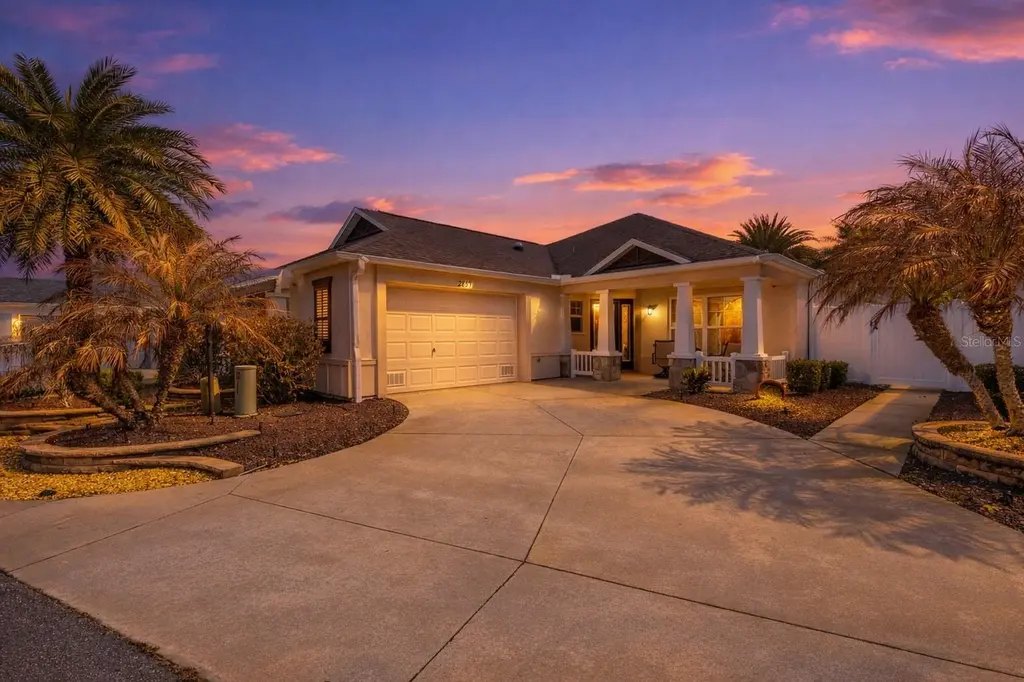
2859 Resmondo Rd · The Villages, FL
Flood risk 1/10 · Minimal
- FEMA flood zone
- X (unshaded)
- Chance of flooding over 30 yrs
- 0.0%
- Est. flood insurance / yr
- $507 – $1,088
Fire risk 2/10 · Minimal
- Est. fire insurance / yr
- $947 – $1,759
Heat risk 9/10 · Severe
- Hot days now (above 108°F)
- 7 days/yr
- Hot days in 30 yrs
- 23 days/yr
Wind risk 9/10 · Severe
- Chance of severe wind over 30 yrs
- 99.0%
Air-quality risk 3/10 · Minor
- Unhealthy air days now
- 2 days/yr
- Unhealthy air days in 30 yrs
- 3 days/yr
Risk factors via First Street. Map © Google.
Why this score? — see what drove the F grade
The composite is a weighted blend of 9 inputs, each scored 0–100. Each bar is that input's sub-score; the figure is the points it added to the 100-point composite (weight × sub-score).
- Appreciation +10.0/10.0
- Cash flow +7.1/30.0
- Schools +5.2/10.0
- Livability +3.5/5.0
- Rent growth +2.5/5.0
- Condition / age +2.5/5.0
- 1% rule +1.7/10.0
- DSCR +1.3/10.0
- ARV discount +0.0/15.0
$469,900
🖨 Deal sheet (PDF) 📄 Offer letter ✓ Due diligence
Listing remarks
Welcome home! This beautifully maintained 3-bedroom, 2-bath courtyard villa offers the perfect blend of comfort, privacy, and Florida charm. This home has been loved and well maintained by ONE OWNER! Constructed of concrete and stucco, this home is surrounded by extensive, lush landscaping that creates a peaceful, private oasis. A tranquil water feature adds to the serene outdoor setting, while the screened birdcage—recently rescreened in 2026—provides the ideal space for relaxing or entertaining! Inside, you’ll find thoughtful upgrades, including brand-new flooring installed in 2025 and fresh interior paint that gives the home a bright, updated feel. Three solar tubes f
Key facts
- Screened birdcage
- Brand-new flooring
- Courtyard villa
Tags
Property features AI
Finance
- Other: No lease restrictions; Living area about 1,674 (public records); Building area total about 2,289 (public records)
- HOA & community: CDD present
Exterior
- Parking: Attached garage; 2-car garage
- Utilities: Public water; Public sewer; Electricity connected; Water connected; Sewer connected; Cable available; Underground utilities
- Home design: Villa (residential); One story; Northwest facing
- Construction: Concrete and stucco construction; Shingle roof; Block foundation; Built on approximately 0.12 acres
- Exterior features: Paved roads; Community amenities: dog park, fitness center, golf, tennis courts, sidewalks, golf carts allowed
Interior
- Kitchen: Dishwasher; Range; Microwave
- Bedrooms: 3 bedrooms
- Flooring: Ceramic tile
- Bathrooms: 2 full bathrooms
- Heating & cooling: Central heating; Central air conditioning
- Interior features: Vaulted ceilings; Partially furnished
- Laundry & utility: Washer; Dryer; Laundry inside; Irrigation equipment
Neighborhood map
What this means for you Summary
Snapshot
- This is a 3-bed/2.0-bath single-family listed at $470k.
Deal economics
- At list price, monthly cash flow is $-670 ($-8k/yr) — negative.
- To cash-flow at today's rent, offer at most $352k (25.2% below list).
- To meet the 1% rule (rent ≥ 1% of price), the offer needs to be $314k (33.3% below list).
- Recommended offer: $314k (33.3% below list) — sets the bar for 1% rule.
Location & tenants
- Location reads 70/100 on livability (#431 in FL) — a middle-class / working-renter tenant base. Strengths: crime A+, housing A, employment B+; Watch: amenities F, commute F, health & safety F.
- Sumter (rural): math 61% / reading 61% proficiency, ranked #11 of 73 in FL (top 15%) — acceptable for families but not a draw, mixed tenant base, ~2y average lease.
- Zoned schools: Wildwood Elementary School (math 49% / reading 52%, grade D+, #1,055 of 2,144 statewide, top 50%, 940 students, 76% FRL); South Sumter Middle School (math 55% / reading 54%, grade B-, #183 of 571 statewide, top 34%, 897 students, 61% FRL) — zoned schools average 68% FRL vs 51% district-wide (18 pts higher); higher-poverty schools than district average — tighter screening recommended.
- Market conditions: 269 active listings in the ZIP; 11 comparable units currently listed for rent nearby; rentals at typical pace (median 23d on market — plan ~3-4 weeks tenant-placement turnaround); solid renter incomes; 3,961 units permitted in Sumter County in 2024 (248 in 5+ unit buildings).
- This rent runs 39% of the median local income ($97k/yr) — at the standard rent-burdened threshold; future hikes will face affordability resistance.
Forward outlook
- In year one you build about $50k of equity ($3k loan paydown + $47k appreciation (10.0% local appreciation)).
- Sumter County population projected at +45% by 2050 — long-run rental-demand tailwind backs the buy-and-hold thesis.
- By year 2, paydown + projected appreciation supports a ~$81k cash-out refi (75% LTV) — recoverable capital for the next deal without selling this one.
Negotiation context
- It's been on market 53 days — a 3% lower offer ($456k) is reasonable based on typical stale-listing flexibility.
Risks & watch-outs
- Climate carrying-cost: severe wind risk, 99% chance of damaging wind over 30y; extreme-heat days projected 7→23/yr by 2055 (HVAC capex compounding) — expect insurance premiums to compound above CPI over the hold.
Questions for the listing agent
- What do current leases actually rent for vs. the listed asking? Can we see a recent rent roll and the last 12 months of T-12 income?
- It's been on market 53 days. Have you received any prior offers? Is the seller open to a 33% concession, seller financing, or rate buy-down credit?
- Is there a deadline driving the sale (1031 exchange, divorce, estate, relocation)? That informs how much negotiation room exists.
- Schools are A-rated — typically a magnet for longer-tenancy family renters. What's the average tenant stay here, and is there a school-zone premium baked into asking?
- The area grade is low — what's the realistic commute time and amenity access for the typical tenant pool here? Any planned neighborhood developments (good or bad) we should know about?
- What's the average days-on-market for RENTAL listings here right now (not sales)? A rising rental-DOM trend means longer vacancies and softer asking-rent achievability than the comps imply.
- What's the recent tenant-quality profile in this submarket — average credit score on applications, eviction rate, late-payment / NSF rate, and stable-employment percentage? A property-management company in the area should have these aggregated.
- How much new for-sale + rental construction is in the pipeline within 1–3 miles? Heavy new supply typically softens prices + rents 12–24 months out; constrained supply supports both.
Investment metrics
- 1% rule
- 0.67% ✗
- Cap rate
- 4.58%
- Cash-on-cash
- -6.11%
- DSCR
- 0.73
- GRM
- 12.5
CMA / ARV
- ARV (on-the-fly)
- $376,650
- Comps found
- 12
Show comp detail 12 sales within ~0.75 mi
| Address | Dist | Beds/Ba | Sqft | Sold | Price | $/sf | Match |
|---|---|---|---|---|---|---|---|
| 500 Ainsworth Cir | 0.39mi | 3/2.0 | 1,724 (+3%) | 4mo | $389,000 | $226 | 73 |
| 2530 Hanlon Ter | 0.58mi | 3/2.0 | 1,724 (+3%) | 7mo | $334,900 | $194 | 62 |
| 669 Pearson St | 0.63mi | 3/2.0 | 1,724 (+3%) | 5mo | $405,000 | $235 | 62 |
| 439 Grovewood Pl | 0.65mi | 3/2.0 | 1,602 (-4%) | 1mo | $374,900 | $234 | 61 |
| 2571 Foxbridge Ter | 0.49mi | 3/2.0 | 1,861 (+11%) | 4mo | $385,000 | $207 | 55 |
| 410 Ainsworth Cir | 0.41mi | 3/2.0 | 1,512 (-10%) | 12mo | $370,000 | $245 | 55 |
| 2519 Flintshire Ave | 0.62mi | 3/2.0 | 1,527 (-9%) | 3mo | $345,500 | $226 | 54 |
| 2519 Hanlon Ter | 0.57mi | 3/2.0 | 1,512 (-10%) | 5mo | $340,000 | $225 | 53 |
| 650 Bradford Loop | 0.56mi | 3/2.0 | 1,875 (+12%) | 1mo | $400,000 | $213 | 53 |
| 287 Ellenton Run | 0.37mi | 3/2.0 | 1,919 (+15%) | 12mo | $399,000 | $208 | 48 |
| 2543 Flintshire Ave | 0.60mi | 3/2.0 | 1,887 (+13%) | 7mo | $389,900 | $207 | 45 |
| 2518 Foxbridge Ter | 0.57mi | 3/2.0 | 1,887 (+13%) | 12mo | $360,000 | $191 | 42 |
Match score weights: distance 35% · size 25% · config 20% · recency 20%. Top-matched comps best support the ARV.
Projected returns pro-forma
10.0% appreciation · 3.0% rent growth · sell at horizon
- IRR
- 20.0%
- Equity multiple
- 2.62×
- Total profit
- $213,234
- Equity at exit
- $423,323
- IRR
- 18.3%
- Equity multiple
- 6.03×
- Total profit
- $661,466
- Equity at exit
- $912,912
Cash invested: $131,572 (down + closing). Projections, not guarantees.
Landlord ↔ Tenant lean methodology
- Overall (STATE)
- 87 Strongly Landlord-Friendly
- State Florida
- 87 Strongly Landlord-Friendly · R+3
- County
- — inherits STATE
- City
- — inherits STATE
ZIP-level market 32163
- Home prices YoY
- 9.8%
- Active inventory
- 269
- Price-to-rent
- 12.5×
Monthly cashflow live
- Estimated rent
- $3,135 high interval (Pro) →
- Mortgage (P&I)
- −$2,464
- Tax from tax record
- −$487 /mo · $5,842/yr
- Insurance
- −$196
- HOA
- −$0
- Vacancy / Maint / Mgmt
- −$658
- Net cashflow
- $-670
Break-even live
Sensitivity live
| Price | -10% $-404 | -5% $-537 | +0% $-670 | +5% $-803 | +10% $-936 |
|---|---|---|---|---|---|
| Rent | -10% $-918 | -5% $-794 | +0% $-670 | +5% $-546 | +10% $-422 |
| Rate | -1.0pp $-433 | -0.5pp $-550 | base $-670 | +0.5pp $-792 | +1.0pp $-916 |
UW: 25.0% down · 7.5% · 30yr · 1.5% tax · 5.0% vac · 8.0% maint · 8.0% mgmt
Financing live
Cash to close
- Down payment
- $117,475
- Closing costs
- $14,097
- Reserves months
- —
- Total cash needed
- —
Loan-product check · same deal, 3 products live
Conventional
25% down · 7.5% · 30yr
- Down + closing
- —
- Monthly P&I
- —
- Monthly cashflow
- —
- DSCR
- —
- Eligible?
- —
Personal DTI + credit; lowest rate.
DSCR
20% down · 8.5% · 30yr
- Down + closing
- —
- Monthly P&I
- —
- Monthly cashflow
- —
- DSCR
- —
- Eligible?
- —
No personal income docs; deal must DSCR.
Hard money
10% down · 12.0% · 12mo
- Down + closing
- —
- Monthly P&I
- —
- Monthly cashflow
- —
- DSCR
- —
- Eligible?
- —
Short-term bridge; refi at stabilization.
Rent comps 11 comps
| Address | Beds | Baths | Sqft | Rent | $/sqft | DOM | Units | Dist |
|---|---|---|---|---|---|---|---|---|
| 2614 Dartford Ter The Villages, FL | 3.0 | 2.0 | 1685 | $1,995 | $1.18 | 23d | 1 | 0.45mi |
| 3530 E Harbor Dr Fruitland Park, FL | 1.0–3.0 | 1.0–2.0 | 1061 | $2,014 | $1.90 | 0d | 36 | 0.55mi |
| 1069 Becker Ave The Villages, FL | 3.0 | 2.0 | 1656 | $5,000 | $3.02 | 25d | 1 | 0.63mi |
| 798 Journey Ln The Villages, FL | 3.0 | 2.0 | 1551 | $2,300 | $1.48 | 23d | 1 | 0.79mi |
| 2875 Rain Lily Loop The Villages, FL | 3.0 | 2.0 | 1965 | $4,490 | $2.28 | 23d | 1 | 0.96mi |
| 3225 Wise Way The Villages, FL | 3.0 | 2.0 | 1652 | $2,650 | $1.60 | 25d | 1 | 0.99mi |
| 3068 Islawild Way The Villages, FL | 3.0 | 2.0 | 1542 | $2,200 | $1.43 | 23d | 1 | 1.06mi |
| 731 Baisley Trl The Villages, FL | 2.0 | 2.0 | 1512 | $4,500 | $2.98 | 23d | 1 | 1.30mi |
| 1109 Alcove Loop The Villages, FL | 3.0 | 2.0 | 1970 | $3,000 | $1.52 | 23d | 1 | 1.30mi |
| 2111 Jem Path The Villages, FL | 3.0 | 2.0 | 2000 | $5,800 | $2.90 | 23d | 1 | 1.35mi |
| 470 Oboe Way The Villages, FL | 2.0 | 2.0 | 1240 | $2,200 | $1.77 | 23d | 1 | 1.40mi |
Listing history 18 events
-
2026-06-22days on market $469,900 Active 53 DOM
-
2026-06-19days on market $469,900 Active 51 DOM
-
2026-06-18days on market $469,900 Active 50 DOM
-
2026-06-17days on market $469,900 Active 49 DOM
-
2026-06-16days on market $469,900 Active 48 DOM
-
2026-06-15days on market $469,900 Active 47 DOM
-
2026-06-14days on market $469,900 Active 45 DOM
-
2026-06-13days on market $469,900 Active 44 DOM
-
2026-06-10days on market $469,900 Active 42 DOM
-
2026-06-09days on market $469,900 Active 41 DOM
-
2026-06-08days on market $469,900 Active 40 DOM
-
2026-06-07pricedays on market $469,900 Active 39 DOM
-
2026-06-02days on market $479,900 Active 34 DOM
-
2026-06-01days on market $479,900 Active 33 DOM
-
2026-05-31days on market $479,900 Active 32 DOM
-
2026-05-30days on market $479,900 Active 31 DOM
-
2026-04-30price $479,900
-
2026-04-29$469,900 Active
ⓘ Source: listings_history table (triggers on properties + properties_extension) + one-shot
backfill from property_details.listing_events for pre-trigger history.
Tax reassessment forecast FL · Resets to sale price
- Current annual tax
- $5,842 · $487/mo
- Projected year-2 tax
- $5,842 · $487/mo
- Expected delta
- $0/yr ($0/mo · 0.0%)
ⓘ Screening estimate from a state-policy table — verify with the county assessor before closing.
Climate risk First Street
- Flood 1/10 Low FEMA zone X (unshaded) · 0% chance over 30 yrs
- Wildfire 2/10 Low
- Heat 9/10 Extreme 7 d/yr ≥108°F today · 23 d/yr by 30 yrs out
- Wind 9/10 Extreme 99% chance of damaging wind over 30 yrs
- Air quality 3/10 Moderate 2 unhealthy d/yr today · 3 by 30 yrs out
Nearby sold comps map
Loading sold comps map…
Walkable amenities ~0.75 mi
Loading nearby amenities…
Taxation est. · year 1
- Rental income
- $37,623
- − Mortgage interest
- −$26,322
- − Property taxes
- −$5,842
- − Insurance
- −$2,350
- − Repairs & maintenance
- −$3,010
- − Management
- −$3,010
- − Depreciation
- −$13,670
- Taxable loss
- −$16,580
- Est. tax savings @ 24.0%
- +$3,979
- After-tax cash flow
- $-4,061/yr
For passive investors: Depreciation is non-cash, so a rental often shows a tax loss while cash-flowing — sheltering income. Rental losses are passive: they offset passive income freely, and up to $25,000/yr can offset ordinary (W-2) income if you actively participate and your MAGI is under $100k (phasing out to $0 by $150k); unused losses carry forward. On sale, claimed depreciation is recaptured at up to 25%, and gains may owe capital-gains tax (a 1031 exchange can defer both). Figures are a year-1 estimate at your 24.0% rate — not tax advice; consult a CPA.
Schools (NCES district)
- District
- Sumter
- NCES district ID
- 1201800
- Math proficiency
- 61% ▼ -4.00%
- Reading proficiency
- 61% ▼ -2.00%
- Median HH income
- $48,240
- Composite
- 51.74/100
- National rank
- #1682
- State rank
- #11 of 73 in FL
Livability — The Villages
- Score
- 70/100
- State rank
- #431
- US rank
- #7363
Category grades
Schools grade is shown separately in the Schools card above.
Census & demographics
- Census place
- The Villages, FL
- County
- Sumter County · 110,591 people
- City population
- 21,568
- Metro
- The Villages, FL
- Population (ZIP)
- 28,549
- Household income
- $96,775
- Rent vs Own
- Severe rent burden
- 307.0
Population outlook (Sumter County) Hauer SSP2
- Today (2025)
- 161,172 people
- By 2030
- 180,083 · +11.7%
- By 2040
- 209,892 · +30.2%
- By 2050
- 234,186 · +45.3%
- By 2075
- 284,602 · +76.6%
- By 2100
- 317,039 · +96.7%
Race, ethnicity, and origin ACS 2023
- Neighborhood character
- Predominantly White (95%)
- Race & ethnicity
- White 95% Two or more races 2% Hispanic / Latino 2% Asian 1%
- Common ancestry
- Romanian 6% Lithuanian 3% Iranian 3%
- Foreign-born
- 6% · Canada, Vietnam
- Languages at home
- 96% English-only · Spanish 2% Vietnamese 1% Other Indo-European 0%
Political lean MEDSL · Sumter
- 2024 margin
- Solid R (+37.6) · D 30.9% · R 68.6%
- 2008→2024 swing
- -10.6pp toward R · 2008: -27.0pp · 2024: -37.6pp
- All cycles
- 2024: R+37.6 2020: R+36.1 2016: R+39.2 2012: R+34.9 2008: R+27.0
Not yet ingested
- Civics
- —
Market trends
- HPI YoY
- ▲ 20.47%
- Current HPI
- 229.0075
- Rent YoY
- —
- Metro
- The Villages, FL
- State GDP YoY
- ▲ 3.28%
- F500 in state
- 36
Industry mix (Fortune 500 HQ in FL)
| Industry | F500 HQs | Revenue |
|---|---|---|
| Industrial Technology | 2 | $29B |
|
||
| Insurance | 2 | $17B |
|
||
| Retail | 1 | $60B |
|
||
| Technology Distribution | 1 | $58B |
|
||
| Homebuilding | 1 | $35B |
|
||
| Technology Manufacturing | 1 | $35B |
|
||
Price history
+2.1% since first listed2 events — show timeline
- 2026-04-30 Price Changed $479,900 Stellar MLS as Distributed by MLS Grid
- 2026-04-29 Listed $469,900 Stellar MLS as Distributed by MLS Grid
Property tax history
+13.5%/yrLatest (2025): $5,842 · -0.9% YoY. Source: county tax records.
Cash-flow waterfall
monthlySold comps — $/sqft
last 12 mo · ≤1 miLoading sold comps…