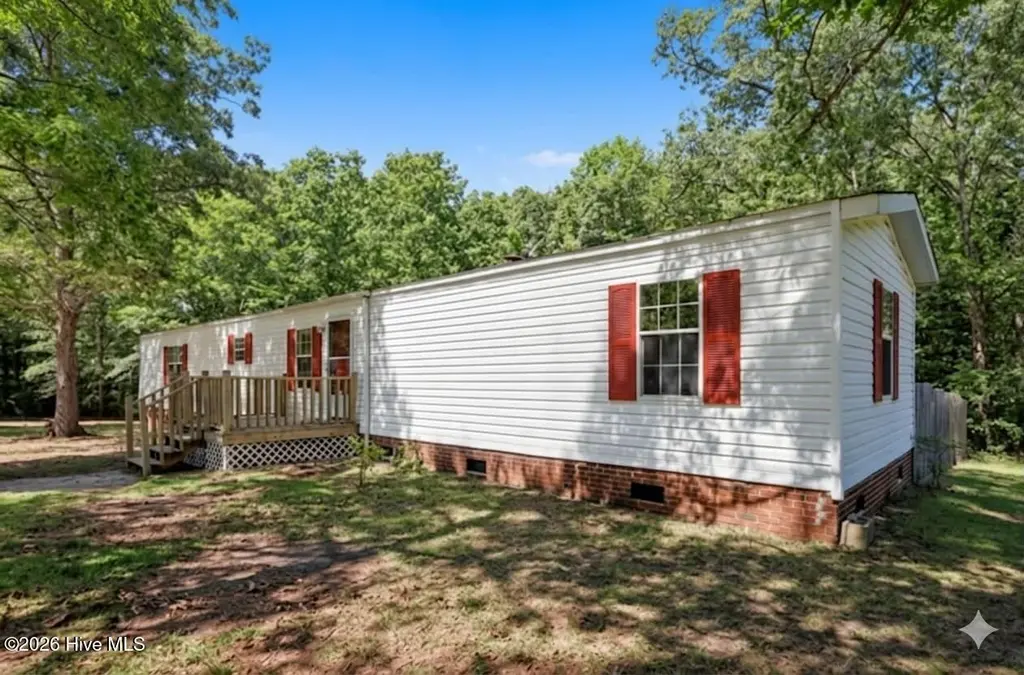
106 Mcclendon Ct · Richlands, NC
Flood risk 1/10 · Minimal
- FEMA flood zone
- X (unshaded)
- Chance of flooding over 30 yrs
- 0.0%
- Est. flood insurance / yr
- $507 – $1,088
Fire risk 7/10 · Major
- Est. fire insurance / yr
- $906 – $1,684
Heat risk 8/10 · Major
- Hot days now (above 107°F)
- 7 days/yr
- Hot days in 30 yrs
- 18 days/yr
Wind risk 8/10 · Major
- Chance of severe wind over 30 yrs
- 93.0%
Air-quality risk 2/10 · Minimal
- Unhealthy air days now
- 1 days/yr
- Unhealthy air days in 30 yrs
- 1 days/yr
Risk factors via First Street. Map © Google.
Why this score? — see what drove the C- grade
The composite is a weighted blend of 9 inputs, each scored 0–100. Each bar is that input's sub-score; the figure is the points it added to the 100-point composite (weight × sub-score).
- Cash flow +24.0/30.0
- DSCR +7.7/10.0
- 1% rule +5.0/10.0
- Schools +3.9/10.0
- Livability +3.5/5.0
- ARV discount +3.2/15.0
- Rent growth +2.5/5.0
- Condition / age +2.5/5.0
- Appreciation +0.0/10.0
$180,000
🖨 Deal sheet 📄 Offer letter ✓ Due diligence
Listing remarks MLS
Ideal rental property, this manufactured home sits on a quiet cul-de-sac in Richlands area. A little bit of elbow grease and this home will be tenant-ready! Unbelievable price $21,500. Sold ''''as is''''. Proof of funds required with all offers.
Key facts
- 1.43 acre lot
- Built 2001
- Listed 9 days
Property features AI
Finance
- Other: Zoning: R-8M
- HOA & community: No association amenities
Exterior
- Parking: On-site unpaved parking
- Security: Smoke detector(s)
- Utilities: Public water; Water connected; Septic tank
- Home design: Manufactured home (residential); One level / 1 story; Entry level is 1
- Construction: Vinyl siding with frame construction; Shingle roof
- Exterior features: Deck; Rear porch; Wood fencing in backyard; Shed(s); Has a view; Cul-de-sac lot
Interior
- Kitchen: Electric oven; Electric cooktop; Refrigerator; Dishwasher
- Bedrooms: Total rooms: 5
- Flooring: Carpet
- Bathrooms: 2 full bathrooms
- Heating & cooling: Heat pump heating and central air conditioning; Fireplace(s); Electric heating
- Interior features: Walk-in closets; Ceiling fans; Eat-in kitchen; Unfurnished; Crawl space basement
- Laundry & utility: Washer hookup in hall; Electric water heater
Neighborhood map
What this means for you Summary
Snapshot
- This is a 3-bed/2.0-bath manufactured listed at $180k.
Deal economics
- At list price, monthly cash flow is $352 ($4k/yr) — positive.
- The deal already cash-flows at list — no discount required.
- To meet the 1% rule (rent ≥ 1% of price), the offer needs to be $180k (0.1% below list).
- Recommended offer: $180k (0.1% below list) — sets the bar for 1% rule.
- Cap rate 8.6% vs local median 4.0% in Richlands — top-decile yield for the area; either an underpriced asset or a hidden risk that comps aren't pricing in. Stress-test before assuming the spread holds.
Location & tenants
- Location reads 69/100 on livability (#151 in NC) — a middle-class / working-renter tenant base. Strengths: crime A+, cost of living A+, housing A+; Watch: employment D, amenities F, commute F.
- Onslow County Schools (other): math 42% / reading 49% proficiency, ranked #84 of 178 in NC (top 47%) — families likely to look elsewhere, expect single-tenant / working-renter base with shorter leases.
- Zoned schools: Richlands Elementary (math 44% / reading 40%, grade F, #633 of 1,410 statewide, top 48%, 642 students, 52% FRL); Trexler Middle (math 37% / reading 46%, grade F, #206 of 475 statewide, top 44%, 825 students, 45% FRL); Richlands High (math 52% / reading 67%, grade C+, #216 of 535 statewide, top 43%, 960 students, 40% FRL).
- Market conditions: 200 active listings in the ZIP; 2 comparable units currently listed for rent nearby; 1,246 units permitted in Onslow County in 2024 (0 in 5+ unit buildings).
- This rent runs 32% of the median local income ($67k/yr) — at the standard rent-burdened threshold; future hikes will face affordability resistance.
Forward outlook
- Local home prices are declining (-3.0%/yr); year-one equity from $1k of loan paydown is wiped out by about $5k of value loss. Plan a longer hold.
Negotiation context
- Only 9 days on market — expect competitive offers; lowballing is unlikely to land.
- 3 sale attempts since 13y ago with the ask held roughly flat each time — persistent listings suggest the price (not the market) is what's stuck; bring a comps-based counter.
- Current owner paid $21k; list at $180k implies a 757% gain — meaningful room to come down on a strong offer.
Risks & watch-outs
- Climate carrying-cost: severe wind risk, 93% chance of damaging wind over 30y; major wildfire risk; extreme-heat days projected 7→18/yr by 2055 (HVAC capex compounding) — expect insurance premiums to compound above CPI over the hold.
Questions for the listing agent
- Is there a deadline driving the sale (1031 exchange, divorce, estate, relocation)? That informs how much negotiation room exists.
- What's the average days-on-market for RENTAL listings here right now (not sales)? A rising rental-DOM trend means longer vacancies and softer asking-rent achievability than the comps imply.
- What's the recent tenant-quality profile in this submarket — average credit score on applications, eviction rate, late-payment / NSF rate, and stable-employment percentage? A property-management company in the area should have these aggregated.
- How much new for-sale + rental construction is in the pipeline within 1–3 miles? Heavy new supply typically softens prices + rents 12–24 months out; constrained supply supports both.
Investment metrics
- 1% rule
- 1.00% ✗
- Cap rate
- 8.64%
- Cash-on-cash
- 8.38%
- DSCR
- 1.37
- GRM
- 8.3
CMA / ARV
- ARV (on-the-fly)
- $164,160
- Comps found
- 2
Show comp detail 2 sales within ~0.75 mi
| Address | Dist | Beds/Ba | Sqft | Sold | Price | $/sf | Match |
|---|---|---|---|---|---|---|---|
| 119 Edgewater Ln | 0.21mi | 2/2.0 (-1) | 1,064 (-12%) | 4mo | $95,000 | $89 | 61 |
| 115 Grassy Meadow Dr | 0.39mi | 3/2.0 | 1,372 (+13%) | 3mo | $185,000 | $135 | 58 |
Match score weights: distance 35% · size 25% · config 20% · recency 20%. Top-matched comps best support the ARV.
Projected returns pro-forma
-3.0% appreciation · 3.0% rent growth · sell at horizon
- IRR
- -3.6%
- Equity multiple
- 0.86×
- Total profit
- $-6,830
- Equity at exit
- $26,839
- IRR
- 6.0%
- Equity multiple
- 1.45×
- Total profit
- $22,591
- Equity at exit
- $15,563
Cash invested: $50,400 (down + closing). Projections, not guarantees.
Landlord ↔ Tenant lean methodology
- Overall (STATE)
- 85 Strongly Landlord-Friendly
- State North Carolina
- 85 Strongly Landlord-Friendly · R+3
- County
- — inherits STATE
- City
- — inherits STATE
ZIP-level market 28574
- Home prices YoY
- -8.9%
- Active inventory
- 200
- Price-to-rent
- 8.3×
Monthly cashflow live
- Estimated rent
- $1,798 medium interval (Pro) →
- Mortgage (P&I)
- −$944
- Tax from tax record
- −$50 /mo · $595/yr
- Insurance
- −$75
- HOA
- −$0
- Vacancy / Maint / Mgmt
- −$378
- Net cashflow
- $352
Break-even live
UW: 25.0% down · 7.5% · 30yr · 1.5% tax · 5.0% vac · 8.0% maint · 8.0% mgmt
Financing live
Cash to close
- Down payment
- $45,000
- Closing costs
- $5,400
- Reserves months
- —
- Total cash needed
- —
Loan-product check · same deal, 3 products live
Conventional
25% down · 7.5% · 30yr
- Down + closing
- —
- Monthly P&I
- —
- Monthly cashflow
- —
- DSCR
- —
- Eligible?
- —
Personal DTI + credit; lowest rate.
DSCR
20% down · 8.5% · 30yr
- Down + closing
- —
- Monthly P&I
- —
- Monthly cashflow
- —
- DSCR
- —
- Eligible?
- —
No personal income docs; deal must DSCR.
Hard money
10% down · 12.0% · 12mo
- Down + closing
- —
- Monthly P&I
- —
- Monthly cashflow
- —
- DSCR
- —
- Eligible?
- —
Short-term bridge; refi at stabilization.
Rent comps 2 comps
| Address | Beds | Baths | Sqft | Rent | $/sqft | DOM | Units | Dist |
|---|---|---|---|---|---|---|---|---|
| 203 Stockton Ct Richlands, NC | 3.0 | 2.0 | 1221 | $1,750 | $1.43 | 21d | 1 | 0.14mi |
| 2430 Catherine Lake Rd Richlands, NC | 2.0 | 1.0 | 980 | $850 | $0.87 | 13d | 1 | 0.55mi |
Listing history 10 events
-
2026-06-01status $180,000 Pending 9 DOM
-
2026-05-31days on market $180,000 Active 9 DOM
-
2026-05-30days on market $180,000 Active 8 DOM
-
2026-05-22$180,000 Active
-
2014-09-11soldstatus $21,000 245-char remark
Show marketing remark (245 chars)
Ideal rental property, this manufactured home sits on a quiet cul-de-sac in Richlands area. A little bit of elbow grease and this home will be tenant-ready! Unbelievable price $21,500. Sold ''''as is''''. Proof of funds required with all offers.
-
2014-07-31$21,500 245-char remark
Show marketing remark (245 chars)
Ideal rental property, this manufactured home sits on a quiet cul-de-sac in Richlands area. A little bit of elbow grease and this home will be tenant-ready! Unbelievable price $21,500. Sold ''''as is''''. Proof of funds required with all offers.
-
2013-11-04historical
-
2013-09-12$24,500
-
2010-03-30soldstatus $83,000
-
2007-06-11soldstatus $78,500
ⓘ Source: listings_history table (triggers on properties + properties_extension) + one-shot
backfill from property_details.listing_events for pre-trigger history.
Tax reassessment forecast NC · Resets to sale price
- Current annual tax
- $595 · $50/mo
- Projected year-2 tax
- $1,476 · $123/mo
- Expected delta
- +$881/yr (+$73/mo · 147.9%)
ⓘ Screening estimate from a state-policy table — verify with the county assessor before closing.
Climate risk First Street
- Flood 1/10 Low FEMA zone X (unshaded) · 0% chance over 30 yrs
- Wildfire 7/10 Severe
- Heat 8/10 Severe 7 d/yr ≥107°F today · 18 d/yr by 30 yrs out
- Wind 8/10 Severe 93% chance of damaging wind over 30 yrs
- Air quality 2/10 Low 1 unhealthy d/yr today · 1 by 30 yrs out
Nearby sold comps map
Loading sold comps map…
Walkable amenities ~0.75 mi
Loading nearby amenities…
Taxation est. · year 1
- Rental income
- $21,578
- − Mortgage interest
- −$10,083
- − Property taxes
- −$595
- − Insurance
- −$900
- − Repairs & maintenance
- −$1,726
- − Management
- −$1,726
- − Depreciation
- −$5,236
- Taxable income
- $1,311
- Est. tax owed @ 24.0%
- −$315
- After-tax cash flow
- $3,909/yr
For passive investors: Depreciation is non-cash, so a rental often shows a tax loss while cash-flowing — sheltering income. Rental losses are passive: they offset passive income freely, and up to $25,000/yr can offset ordinary (W-2) income if you actively participate and your MAGI is under $100k (phasing out to $0 by $150k); unused losses carry forward. On sale, claimed depreciation is recaptured at up to 25%, and gains may owe capital-gains tax (a 1031 exchange can defer both). Figures are a year-1 estimate at your 24.0% rate — not tax advice; consult a CPA.
Schools (NCES district)
- District
- Onslow County Schools
- NCES district ID
- 3703450
- Math proficiency
- 42% ▲ 6.00%
- Reading proficiency
- 49% ▲ 5.00%
- Median HH income
- $46,076
- Composite
- 38.66/100
- National rank
- #4148
- State rank
- #84 of 178 in NC
Livability — Richlands
- Score
- 69/100
- State rank
- #151
- US rank
- #8426
Category grades
Schools grade is shown separately in the Schools card above.
Census & demographics
- County
- Onslow County · 164,453 people
- City population
- 20,990
- Metro
- Jacksonville, NC
- Population (ZIP)
- 20,990
- Household income
- $67,416
- Rent vs Own
- Severe rent burden
- 287.0
Population outlook (Onslow County) Hauer SSP2
- Today (2025)
- 189,789 people
- By 2030
- 194,463 · +2.5%
- By 2040
- 193,629 · +2.0%
- By 2050
- 193,248 · +1.8%
- By 2075
- 196,995 · +3.8%
- By 2100
- 201,513 · +6.2%
Race, ethnicity, and origin ACS 2023
- Neighborhood character
- Predominantly White (74%)
- Race & ethnicity
- White 74% Two or more races 13% Hispanic / Latino 8% Black 7%
- Hispanic origin (detail)
- Mexican 4% Puerto Rican 2%
- Common ancestry
- Slovak 3% Romanian 2% Lithuanian 1%
- Foreign-born
- 2% · Canada
- Languages at home
- 92% English-only · Spanish 6%
Political lean MEDSL · Onslow
- 2024 margin
- Solid R (+35.9) · D 31.5% · R 67.5% · Other 1.0%
- 2008→2024 swing
- -14.5pp toward R · 2008: -21.5pp · 2024: -35.9pp
- All cycles
- 2024: R+35.9 2020: R+30.2 2016: R+34.6 2012: R+27.0 2008: R+21.5
Not yet ingested
- Civics
- —
Market trends
- HPI YoY
- ▼ -21.07%
- Current HPI
- 215.4574
- Rent YoY
- —
- Metro
- Jacksonville, NC
- State GDP YoY
- ▲ 3.28%
- F500 in state
- 26
Industry mix (Fortune 500 HQ in NC)
| Industry | F500 HQs | Revenue |
|---|---|---|
| Financial Services | 2 | $213B |
|
||
| Retail | 2 | $95B |
|
||
| Industrial Conglomerate | 1 | $38B |
|
||
| Metals / Steel | 1 | $35B |
|
||
| Utilities | 1 | $30B |
|
||
| Industrial Machinery | 1 | $19B |
|
||
Price history
+129.3% since first listed7 events — show timeline
- 2026-05-22 Listed $180,000 Hive MLS
- 2014-09-11 Sold (MLS) $21,000 Hive MLS
- 2014-07-31 Listed $21,500 Hive MLS
- 2013-11-04 Listing Removed — Hive MLS
- 2013-09-12 Listed $24,500 Hive MLS
- 2010-03-30 Sold (Public Records) $83,000 Public Records
- 2007-06-11 Sold (Public Records) $78,500 Public Records
Property tax history
+4.8%/yrLatest (2025): $595 · +0.0% YoY. Source: county tax records.
Cash-flow waterfall
monthlySold comps — $/sqft
last 12 mo · ≤1 miLoading sold comps…