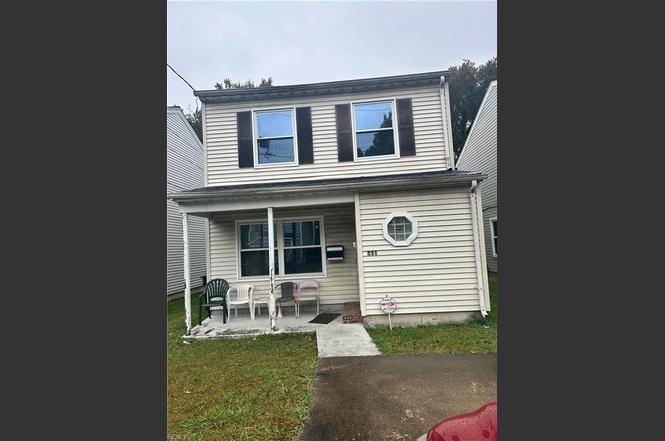
531 Greenbriar Ave · Hampton, VA
Flood risk 4/10 · Minor
- FEMA flood zone
- X (unshaded)
- Chance of flooding over 30 yrs
- 0.2%
- Est. flood insurance / yr
- $473 – $860
Fire risk 1/10 · Minimal
- Est. fire insurance / yr
- $666 – $1,236
Heat risk 9/10 · Severe
- Hot days now (above 106°F)
- 7 days/yr
- Hot days in 30 yrs
- 15 days/yr
Wind risk 8/10 · Major
- Chance of severe wind over 30 yrs
- 80.0%
Air-quality risk 2/10 · Minimal
- Unhealthy air days now
- 1 days/yr
- Unhealthy air days in 30 yrs
- 1 days/yr
Risk factors via First Street. Map © Google.
Why this score? — see what drove the C- grade
The composite is a weighted blend of 9 inputs, each scored 0–100. Each bar is that input's sub-score; the figure is the points it added to the 100-point composite (weight × sub-score).
- Cash flow +15.7/30.0
- ARV discount +13.7/15.0
- Schools +5.5/10.0
- Rent growth +5.0/5.0
- DSCR +4.8/10.0
- 1% rule +4.0/10.0
- Livability +3.8/5.0
- Condition / age +2.5/5.0
- Appreciation +0.0/10.0
$199,000
🖨 Deal sheet 📄 Offer letter ✓ Due diligence
Listing remarks
Looking for a great investment or a chance to add your personal touch? This 3-bedroom, 1.5-bath single-family home offers solid potential at a discounted price! Featuring a spacious living area, functional layout, and a large yard perfect for outdoor living, this property is ideal for investors, first-time buyers willing to do a little work, or anyone looking to build instant equity. Conveniently located near shopping, schools, and major highways, this home provides an excellent opportunity to own in a desirable area without breaking the bank. Sold As-Is – seller will make no repairs. Bring your vision and make this home shine again!
Key facts
- Spacious living area
- Large yard
- Functional layout
Tags
Neighborhood map
What this means for you Summary
Snapshot
- This is a 3-bed/1.5-bath single-family listed at $199k.
Deal economics
- At list price, monthly cash flow is $87 ($1k/yr) — positive.
- The deal already cash-flows at list — no discount required.
- To meet the 1% rule (rent ≥ 1% of price), the offer needs to be $179k (10.1% below list).
- Recommended offer: $179k (10.1% below list) — sets the bar for 1% rule.
- Cap rate 6.8% vs local median 4.5% in Hampton — top-decile yield for the area; either an underpriced asset or a hidden risk that comps aren't pricing in. Stress-test before assuming the spread holds.
Location & tenants
- Location reads 75/100 on livability (#133 in VA, #4,302 nationally) — a middle-class / working-renter tenant base. Strengths: housing A+, health & safety A+, cost of living A; Watch: crime C-, amenities D+, commute F.
- Hampton City Public School District (urban): math 60% / reading 70% proficiency, ranked #40 of 131 in VA (top 30%) — acceptable for families but not a draw, mixed tenant base, ~2y average lease.
- Zoned schools: Hunter B. Andrews (math 65% / reading 72%, grade B+, #357 of 1,108 statewide, top 33%, 1,131 students, 81% FRL); Hampton High (math 60% / reading 75%, grade B, #183 of 319 statewide, top 58%, 1,359 students, 86% FRL) — zoned schools average 84% FRL vs 49% district-wide (35 pts higher); higher-poverty schools than district average — tighter screening recommended.
- Market conditions: Rents rising fast (+21.4%/yr); 123 active listings in the ZIP; 37 comparable units currently listed for rent nearby; rentals at typical pace (median 24d on market — plan ~3-4 weeks tenant-placement turnaround); 68 units permitted in Hampton city in 2024 (0 in 5+ unit buildings).
- This rent runs 33% of the median local income ($65k/yr) — at the standard rent-burdened threshold; future hikes will face affordability resistance.
Forward outlook
- Local home prices are declining (-3.0%/yr); year-one equity from $1k of loan paydown is wiped out by about $6k of value loss. Plan a longer hold.
- Hampton County population projected at -13% by 2050 — secular population decline; favor cash flow + early exit over multi-decade hold.
Negotiation context
- It's been on market 41 days — a 3% lower offer ($193k) is reasonable based on typical stale-listing flexibility.
- Current owner paid $58k; list at $199k implies a 243% gain — meaningful room to come down on a strong offer.
Risks & watch-outs
- Climate carrying-cost: severe wind risk, 80% chance of damaging wind over 30y; extreme-heat days projected 7→15/yr by 2055 (HVAC capex compounding) — expect insurance premiums to compound above CPI over the hold.
Questions for the listing agent
- It's been on market 41 days. Have you received any prior offers? Is the seller open to a 10% concession, seller financing, or rate buy-down credit?
- Is there a deadline driving the sale (1031 exchange, divorce, estate, relocation)? That informs how much negotiation room exists.
- Schools are B-rated — typically a magnet for longer-tenancy family renters. What's the average tenant stay here, and is there a school-zone premium baked into asking?
- What's the average days-on-market for RENTAL listings here right now (not sales)? A rising rental-DOM trend means longer vacancies and softer asking-rent achievability than the comps imply.
- What's the recent tenant-quality profile in this submarket — average credit score on applications, eviction rate, late-payment / NSF rate, and stable-employment percentage? A property-management company in the area should have these aggregated.
- How much new for-sale + rental construction is in the pipeline within 1–3 miles? Heavy new supply typically softens prices + rents 12–24 months out; constrained supply supports both.
Investment metrics
- 1% rule
- 0.90% ✗
- Cap rate
- 6.82%
- Cash-on-cash
- 1.86%
- DSCR
- 1.08
- GRM
- 9.3
CMA / ARV
- ARV (on-the-fly)
- $230,912
- Comps found
- 12
Show comp detail 12 sales within ~0.75 mi
| Address | Dist | Beds/Ba | Sqft | Sold | Price | $/sf | Match |
|---|---|---|---|---|---|---|---|
| 535 Greenbriar Ave | 0.01mi | 3/1.5 | 1,282 (-9%) | 1mo | $260,000 | $203 | 84 |
| 1106 Victoria Blvd | 0.25mi | 3/2.0 | 1,368 (-3%) | 4mo | $225,000 | $164 | 78 |
| 690 Greenbriar Ave | 0.35mi | 3/1.5 | 1,426 (+1%) | 4mo | $175,000 | $123 | 78 |
| 733 Spruce St | 0.42mi | 3/2.5 | 1,458 (+4%) | 1mo | $300,000 | $206 | 70 |
| 1218 Shell Rd | 0.42mi | 3/1.0 | 1,325 (-6%) | 1mo | $168,000 | $127 | 67 |
| 15 Phenix Ct | 0.15mi | 3/1.5 | 1,595 (+13%) | 4mo | $245,000 | $154 | 67 |
| 241 Maple Ave | 0.64mi | 3/1.5 | 1,388 (-1%) | 2mo | $199,000 | $143 | 67 |
| 211 Greenbriar Ave | 0.45mi | 3/2.0 | 1,335 (-5%) | 2mo | $257,000 | $193 | 66 |
| 146 Pear Ave | 0.58mi | 3/2.0 | 1,375 (-2%) | 4mo | $267,000 | $194 | 64 |
| 705 Maryland Ave | 0.70mi | 3/1.0 | 1,401 (-0%) | 6mo | $152,700 | $109 | 60 |
| 610 Delaware Ave | 0.55mi | 4/2.0 (+1) | 1,489 (+6%) | 4mo | $260,000 | $175 | 55 |
| 323 Poplar Ave | 0.64mi | 3/1.0 | 1,581 (+12%) | 4mo | $115,000 | $73 | 44 |
Match score weights: distance 35% · size 25% · config 20% · recency 20%. Top-matched comps best support the ARV.
Projected returns pro-forma
-3.0% appreciation · 8.0% rent growth · sell at horizon
- IRR
- -8.0%
- Equity multiple
- 0.69×
- Total profit
- $-17,285
- Equity at exit
- $29,672
- IRR
- 6.9%
- Equity multiple
- 1.63×
- Total profit
- $35,049
- Equity at exit
- $17,206
Cash invested: $55,720 (down + closing). Projections, not guarantees.
Landlord ↔ Tenant lean methodology
- Overall (STATE)
- 55 Moderately Landlord-Leaning
- State Virginia
- 55 Moderately Landlord-Leaning · D+2
- County
- — inherits STATE
- City
- — inherits STATE
ZIP-level market 23661
- Home prices YoY
- -16.7%
- Rents YoY
- 21.4%
- Active inventory
- 123
- Price-to-rent
- 9.3×
Monthly cashflow live
- Estimated rent
- $1,788 high interval (Pro) →
- Mortgage (P&I)
- −$1,044
- Tax from tax record
- −$200 /mo · $2,395/yr
- Insurance
- −$83
- HOA
- −$0
- Vacancy / Maint / Mgmt
- −$376
- Net cashflow
- $87
Break-even live
UW: 25.0% down · 7.5% · 30yr · 1.5% tax · 5.0% vac · 8.0% maint · 8.0% mgmt
Financing live
Cash to close
- Down payment
- $49,750
- Closing costs
- $5,970
- Reserves months
- —
- Total cash needed
- —
Loan-product check · same deal, 3 products live
Conventional
25% down · 7.5% · 30yr
- Down + closing
- —
- Monthly P&I
- —
- Monthly cashflow
- —
- DSCR
- —
- Eligible?
- —
Personal DTI + credit; lowest rate.
DSCR
20% down · 8.5% · 30yr
- Down + closing
- —
- Monthly P&I
- —
- Monthly cashflow
- —
- DSCR
- —
- Eligible?
- —
No personal income docs; deal must DSCR.
Hard money
10% down · 12.0% · 12mo
- Down + closing
- —
- Monthly P&I
- —
- Monthly cashflow
- —
- DSCR
- —
- Eligible?
- —
Short-term bridge; refi at stabilization.
Rent comps 37 comps
| Address | Beds | Baths | Sqft | Rent | $/sqft | DOM | Units | Dist |
|---|---|---|---|---|---|---|---|---|
| 417 Greenbriar Ave Hampton, VA | 3.0 | 2.0 | 1007 | $1,695 | $1.68 | 7d | 1 | 0.16mi |
| 633 Hemlock Ave Hampton, VA | 3.0 | 1.0 | 1056 | $1,757 | $1.66 | 12d | 1 | 0.32mi |
| 327 Locust Ave Hampton, VA | 4.0 | 2.0 | 1500 | $2,000 | $1.33 | 43d | 1 | 0.32mi |
| 1212 Shell Rd Hampton, VA | 3.0 | 2.0 | 960 | $1,995 | $2.08 | 14d | 1 | 0.42mi |
| 321 Pine Ave Newport News, VA | 3.0 | 2.5 | 1349 | $1,990 | $1.48 | 23d | 1 | 0.54mi |
| 624 Pennsylvania Ave Hampton, VA | 3.0 | 1.0 | 912 | $1,600 | $1.75 | 23d | 1 | 0.54mi |
| 613 Delaware Ave Hampton, VA | 3.0 | 2.0 | 1082 | $1,900 | $1.76 | 3d | 1 | 0.54mi |
| 104 Greenbriar Ave Hampton, VA | 2.0 | 1.0 | 1146 | $1,390 | $1.21 | 12d | 1 | 0.60mi |
| 233 Pine Ave Newport News, VA | 3.0 | 2.0 | 1213 | $2,100 | $1.73 | 23d | 1 | 0.61mi |
| 2113 Victoria Blvd Hampton, VA | 3.0 | 1.0 | 1005 | $1,595 | $1.59 | 43d | 1 | 0.70mi |
| 1943 Kecoughtan Rd Unit G Hampton, VA | 2.0 | 1.0 | 900 | $1,150 | $1.28 | 12d | 1 | 0.71mi |
| 1943 Kecoughtan Rd Hampton, VA | 2.0 | 1.0 | 900 | $1,150 | $1.28 | 4d | 1 | 0.71mi |
| 1348 28th St Unit NA Newport News, VA | 2.0 | 1.0 | 997 | $1,350 | $1.35 | 23d | 1 | 0.83mi |
| 1348 28th St Newport News, VA | 2.0 | 1.0 | 997 | $1,350 | $1.35 | 4d | 1 | 0.83mi |
| 640 Rolfe St Hampton, VA | 3.0 | 2.0 | 1100 | $2,000 | $1.82 | 43d | 1 | 0.87mi |
| 1227 31st St Newport News, VA | 3.0 | 2.0 | 1500 | $2,495 | $1.66 | 1d | 1 | 0.95mi |
| 236 Pocahontas Pl Hampton, VA | 2.0 | 1.0 | 1262 | $1,795 | $1.42 | 2d | 1 | 0.95mi |
| 40 Buxton Ave Unit C Newport News, VA | 3.0 | 1.0 | 1750 | $1,795 | $1.03 | 43d | 1 | 0.95mi |
| 35 Cedar Ave Newport News, VA | 3.0 | 1.5 | 1138 | $1,595 | $1.40 | 43d | 1 | 1.02mi |
| 1242 26th St Newport News, VA | 3.0 | 4.0 | 1704 | $2,400 | $1.41 | 3d | 1 | 1.02mi |
| 130 Pocahontas Pl Hampton, VA | 3.0 | 1.0 | 1415 | $1,695 | $1.20 | 43d | 1 | 1.02mi |
| 41 Ash Ave Unit B Newport News, VA | 2.0 | 1.0 | 930 | $1,500 | $1.61 | 23d | 1 | 1.05mi |
| 1239 24th St Newport News, VA | 3.0 | 1.0 | 880 | $1,495 | $1.70 | 43d | 1 | 1.07mi |
| 100 Chesterfield Rd Hampton, VA | 3.0 | 1.5 | 1742 | $2,200 | $1.26 | 4d | 1 | 1.07mi |
| 1124 33rd St Newport News, VA | 3.0 | 1.5 | 1386 | $1,600 | $1.15 | 23d | 1 | 1.10mi |
| 2314 Chestnut Ave Newport News, VA | 2.0 | 1.0 | 900 | $12,900 | $14.33 | 1d | 1 | 1.15mi |
| 1032 37th St Newport News, VA | 3.0 | 2.0 | 1191 | $1,450 | $1.22 | 43d | 1 | 1.23mi |
| 1216 21st St Newport News, VA | 3.0 | 3.5 | 1446 | $1,700 | $1.18 | 23d | 1 | 1.25mi |
| 1034 26th St Newport News, VA | 4.0 | 2.0 | 1579 | $1,600 | $1.01 | 43d | 1 | 1.32mi |
| 7 Briar Dr Hampton, VA | 3.0 | 1.5 | 1626 | $1,850 | $1.14 | 14d | 1 | 1.34mi |
| 1625 W Pembroke Ave Unit 7 Hampton, VA | 2.0 | 1.5 | 950 | $1,250 | $1.32 | 43d | 1 | 1.36mi |
| 1625 W Pembroke Ave Hampton, VA | 2.0 | 1.5 | 950 | $1,250 | $1.32 | 23d | 1 | 1.36mi |
| 1035 23rd St Newport News, VA | 3.0 | 2.0 | 1378 | $1,600 | $1.16 | 43d | 1 | 1.37mi |
| 1110 21st St Newport News, VA | 4.0 | 2.0 | 1613 | $1,850 | $1.15 | 43d | 1 | 1.39mi |
| 4200 Newsome Dr Newport News, VA | 2.0 | 1.0 | 895 | $795 | $0.89 | 23d | 1 | 1.40mi |
| 1020 23rd St Newport News, VA | 4.0 | 3.0 | 1710 | $2,195 | $1.28 | 43d | 1 | 1.42mi |
| 1587 Briarfield Rd Hampton, VA | 2.0–3.0 | 1.5–2.0 | 985 | $1,495 | $1.52 | 2d | 9 | 1.44mi |
Listing history 5 events
-
2025-12-09status Under Contract
-
2025-11-25historical Active Under Contract
-
2025-10-29$199,000 Active
-
1997-03-01soldstatus $58,000
-
1996-06-01soldstatus $40,001
ⓘ Source: listings_history table (triggers on properties + properties_extension) + one-shot
backfill from property_details.listing_events for pre-trigger history.
Tax reassessment forecast VA · Resets to sale price
- Current annual tax
- $2,395 · $200/mo
- Projected year-2 tax
- $2,395 · $200/mo
- Expected delta
- $0/yr ($0/mo · 0.0%)
ⓘ Screening estimate from a state-policy table — verify with the county assessor before closing.
Climate risk First Street
- Flood 4/10 Moderate FEMA zone X (unshaded) · 20% chance over 30 yrs
- Wildfire 1/10 Low
- Heat 9/10 Extreme 7 d/yr ≥106°F today · 15 d/yr by 30 yrs out
- Wind 8/10 Severe 80% chance of damaging wind over 30 yrs
- Air quality 2/10 Low 1 unhealthy d/yr today · 1 by 30 yrs out
Nearby sold comps map
Loading sold comps map…
Walkable amenities ~0.75 mi
Loading nearby amenities…
Taxation est. · year 1
- Rental income
- $21,458
- − Mortgage interest
- −$11,147
- − Property taxes
- −$2,395
- − Insurance
- −$995
- − Repairs & maintenance
- −$1,717
- − Management
- −$1,717
- − Depreciation
- −$5,789
- Taxable loss
- −$2,301
- Est. tax savings @ 24.0%
- +$552
- After-tax cash flow
- $1,591/yr
For passive investors: Depreciation is non-cash, so a rental often shows a tax loss while cash-flowing — sheltering income. Rental losses are passive: they offset passive income freely, and up to $25,000/yr can offset ordinary (W-2) income if you actively participate and your MAGI is under $100k (phasing out to $0 by $150k); unused losses carry forward. On sale, claimed depreciation is recaptured at up to 25%, and gains may owe capital-gains tax (a 1031 exchange can defer both). Figures are a year-1 estimate at your 24.0% rate — not tax advice; consult a CPA.
Schools (NCES district)
- District
- Hampton City Public School District
- NCES district ID
- 5101800
- Math proficiency
- 60% ▼ -21.00%
- Reading proficiency
- 70% ▼ -4.00%
- Median HH income
- $50,089
- Composite
- 55.19/100
- National rank
- #1272
- State rank
- #40 of 131 in VA
Livability — Hampton
- Score
- 75/100
- State rank
- #133
- US rank
- #4302
Category grades
Schools grade is shown separately in the Schools card above.
Census & demographics
- Census place
- Hampton, VA
- County
- Hampton City · 132,421 people
- City population
- 132,421
- Metro
- Virginia Beach-Norfolk-Newport News, VA-NC
- Population (ZIP)
- 14,005
- Household income
- $65,446
- Rent vs Own
- Severe rent burden
- 704.0
Population outlook (Hampton County) Hauer SSP2
- Today (2025)
- 134,055 people
- By 2030
- 131,753 · -1.7%
- By 2040
- 125,017 · -6.7%
- By 2050
- 116,825 · -12.9%
- By 2075
- 97,033 · -27.6%
- By 2100
- 76,188 · -43.2%
Race, ethnicity, and origin ACS 2023
- Neighborhood character
- Diverse neighborhood (Simpson 0.56)
- Race & ethnicity
- Black 59% White 31% Two or more races 6% Hispanic / Latino 4%
- Common ancestry
- Serbian 2% Italian 2% Romanian 1%
- Foreign-born
- 3% · Canada
- Languages at home
- 95% English-only · Spanish 2% French/Haitian/Cajun 1% Arabic 1%
Political lean MEDSL · Hampton
- 2024 margin
- Solid D (+39.9) · D 69.2% · R 29.4% · Other 1.4%
- 2008→2024 swing
- +1.0pp no change · 2008: 38.9pp · 2024: 39.9pp
- All cycles
- 2024: D+39.9 2020: D+42.2 2016: D+37.8 2012: D+45.4 2008: D+38.9
Not yet ingested
- Civics
- —
Market trends
- HPI YoY
- ▼ -54.95%
- Current HPI
- 274.2769
- Rent YoY
- ▲ 21.35%
- Metro
- Virginia Beach-Norfolk-Newport News, VA-NC
- State GDP YoY
- ▲ 2.40%
- F500 in state
- 50
Industry mix (Fortune 500 HQ in VA)
| Industry | F500 HQs | Revenue |
|---|---|---|
| Aerospace / Defense | 4 | $236B |
|
||
| Technology / Defense | 3 | $32B |
|
||
| Financial Services | 2 | $176B |
|
||
| Utilities | 2 | $27B |
|
||
| Insurance | 2 | $25B |
|
||
| Technology | 2 | $15B |
|
||
Price history
+397.5% since first listed5 events — show timeline
- 2025-12-09 Pending — REINMLS
- 2025-11-25 Contingent — REINMLS
- 2025-10-29 Listed $199,000 REINMLS
- 1997-03-01 Sold (Public Records) $58,000 Public Records
- 1996-06-01 Sold (Public Records) $40,001 Public Records
Property tax history
+9.9%/yrLatest (2025): $2,395 · +6.9% YoY. Source: county tax records.
Cash-flow waterfall
monthlySold comps — $/sqft
last 12 mo · ≤1 miLoading sold comps…