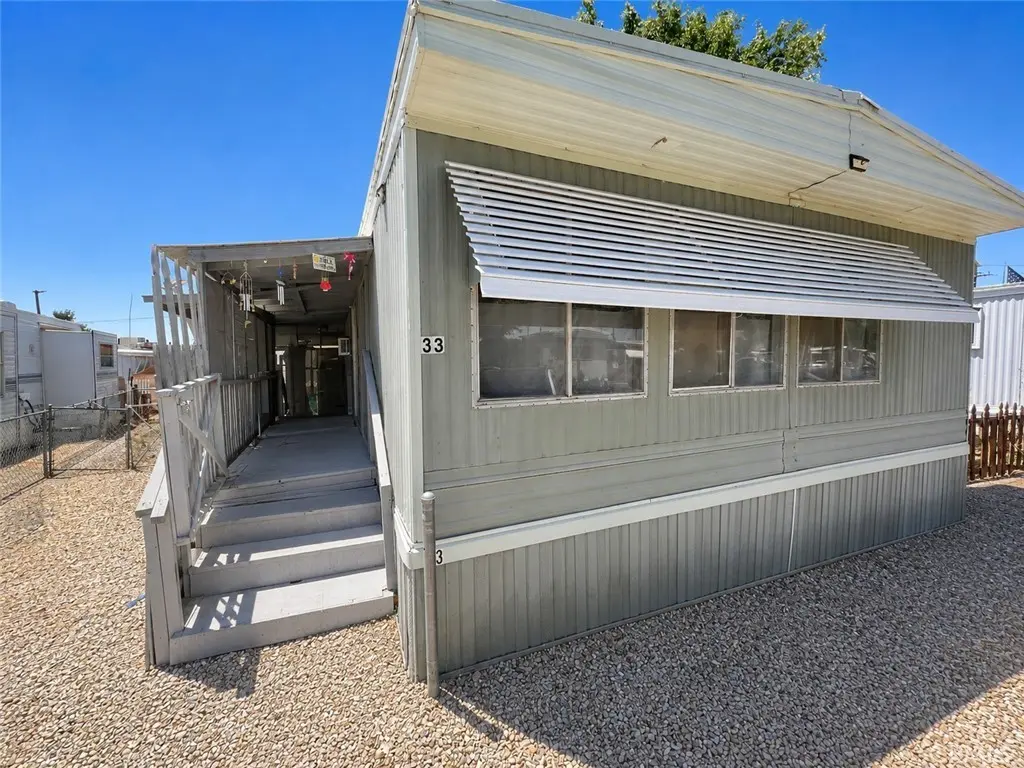
22325 US Highway 18 #33 · Apple Valley, CA
Flood risk 1/10 · Minimal
- FEMA flood zone
- D
- Chance of flooding over 30 yrs
- 0.0%
- Est. flood insurance / yr
- $544 – $1,084
Fire risk 6/10 · Moderate
- Est. fire insurance / yr
- $659 – $1,223
Heat risk 7/10 · Major
- Hot days now (above 100°F)
- 1 days/yr
- Hot days in 30 yrs
- 4 days/yr
Wind risk 1/10 · Minimal
- Chance of severe wind over 30 yrs
- —
Air-quality risk 10/10 · Severe
- Unhealthy air days now
- 25 days/yr
- Unhealthy air days in 30 yrs
- 30 days/yr
Risk factors via First Street. Map © Google.
Why this score? — see what drove the B grade
The composite is a weighted blend of 9 inputs, each scored 0–100. Each bar is that input's sub-score; the figure is the points it added to the 100-point composite (weight × sub-score).
- Cash flow +30.0/30.0
- 1% rule +10.0/10.0
- DSCR +10.0/10.0
- ARV discount +9.4/15.0
- Rent growth +3.6/5.0
- Schools +3.1/10.0
- Livability +3.1/5.0
- Condition / age +2.2/5.0
- Appreciation +0.0/10.0
$49,000
🖨 Deal sheet (PDF) 📄 Offer letter ✓ Due diligence
Listing remarks MLS
Move right in nothing to do. 2 bedroom with bonus room or 3 bedroom!!! New kitchen floor. Seller will leave island for kitchen, pantry, washer and dryer. Check it out!!!!! Cash only or large down and owner carry # of RV Spaces: 0 Special Features: Breakfast Nook, Storage ShedNONE Lot Location Type: Standard Location FireplaceFeatures: None Zoning: Manufacturing # of Attached Spaces: 0 # of Detached Spaces: 0 # of RV Spaces: 0
Key facts
- Expansive side yard
- Built-in shed
- 6-car parking
Tags
Property features AI
Finance
- Other: Suburban neighborhood
- HOA & community: Land lease
Exterior
- Parking: Located in Apple Valley Mobile Home Lodge
- Utilities: Public sewer; Private water
- Home design: Single-story; Mobile home (24' x 36') — mobile home remains; Entry level is on the first floor
- Construction: Year built per public records
- Exterior features: Community pool; Patio-home setting
Interior
- Bathrooms: 1 full bathroom
- Interior features: Side entry
- Laundry & utility: Laundry area in kitchen
Neighborhood map
What this means for you Summary
Snapshot
- This is a 2-bed/1.0-bath manufactured listed at $49k. Condition is rated fair.
Deal economics
- At list price, monthly cash flow is $725 ($9k/yr) — positive.
- The deal already cash-flows at list — no discount required.
- Meets the 1% rule at list price ($1k rent vs $49k).
- Recommended offer: $48k (3.0% below list) — sets the bar for market timing.
- Cap rate 24.0% vs local median 3.5% in Apple Valley — top-decile yield for the area; either an underpriced asset or a hidden risk that comps aren't pricing in. Stress-test before assuming the spread holds.
Location & tenants
- Location reads 61/100 on livability (#532 in CA) — a middle-class / working-renter tenant base. Strengths: housing A+, commute B+; Watch: employment D+, crime D-, amenities F.
- Apple Valley Unified (suburban): math 25% / reading 40% proficiency, ranked #955 of 1,400 in CA (top 68%) — families likely to look elsewhere, expect single-tenant / working-renter base with shorter leases; 60% free/reduced lunch — lower-income household profile, screen leases tightly.
- Zoned schools: Vanguard Preparatory (1,135 students, 69% FRL); Apple Valley High (2,206 students, 62% FRL).
- Market conditions: Rents rising fast (+4.3%/yr); 432 active listings in the ZIP; 3 comparable units currently listed for rent nearby; rentals at typical pace (median 27d on market — plan ~3-4 weeks tenant-placement turnaround); 5,458 units permitted in San Bernardino County in 2024 (1,500 in 5+ unit buildings).
Forward outlook
- Local home prices are declining (-3.0%/yr); year-one equity from $339 of loan paydown is wiped out by about $1k of value loss. Plan a longer hold.
- San Bernardino County population projected at +15% by 2050 — modest demand growth; plan on rents tracking national, not racing it.
- At projected returns (-3.0% appreciation + 4.3% rent growth), your $14k cash investment doubles in ~2 years — after that, you're playing with house money.
Negotiation context
- It's been on market 38 days — a 3% lower offer ($48k) is reasonable based on typical stale-listing flexibility.
- 2 sale attempts since 8y ago with the ask held roughly flat each time — persistent listings suggest the price (not the market) is what's stuck; bring a comps-based counter.
- Current owner paid $14k; list at $49k implies a 250% gain — meaningful room to come down on a strong offer.
Risks & watch-outs
- Climate carrying-cost: major wildfire risk; extreme-heat days projected 1→4/yr by 2055 (HVAC capex compounding) — expect insurance premiums to compound above CPI over the hold.
Questions for the listing agent
- It's been on market 38 days. Have you received any prior offers? Is the seller open to a 3% concession, seller financing, or rate buy-down credit?
- Have any recent inspections been done? Can we get a copy of the seller's disclosures and any deferred-maintenance estimates?
- Built in 1971 — when were the roof, HVAC, electrical panel, plumbing, and water heater last replaced?
- Is there a deadline driving the sale (1031 exchange, divorce, estate, relocation)? That informs how much negotiation room exists.
- Schools are F-rated, which usually means shorter tenancies and higher turnover. Who's the typical renter profile here, and what's been the actual vacancy rate?
- Crime grade is D in this area — have there been break-ins, vandalism, or insurance claims at this property in the last 3 years? What carrier currently insures it and at what premium?
- What's the average days-on-market for RENTAL listings here right now (not sales)? A rising rental-DOM trend means longer vacancies and softer asking-rent achievability than the comps imply.
- What's the recent tenant-quality profile in this submarket — average credit score on applications, eviction rate, late-payment / NSF rate, and stable-employment percentage? A property-management company in the area should have these aggregated.
- How much new for-sale + rental construction is in the pipeline within 1–3 miles? Heavy new supply typically softens prices + rents 12–24 months out; constrained supply supports both.
Investment metrics
- 1% rule
- 2.75% ✓
- Cap rate
- 24.04%
- Cash-on-cash
- 63.38%
- DSCR
- 3.82
- GRM
- 3.0
CMA / ARV
- ARV (on-the-fly)
- $51,120
- Comps found
- 2
Show comp detail 2 sales within ~0.75 mi
| Address | Dist | Beds/Ba | Sqft | Sold | Price | $/sf | Match |
|---|---|---|---|---|---|---|---|
| 22325 US Highway 18 #7 | 0.18mi | 3/1.0 (+1) | 700 (-3%) | 6mo | $49,500 | $71 | 77 |
| 22325 Highway 18 #8 | 0.02mi | 1/1.0 (-1) | 650 (-10%) | 4mo | $14,000 | $22 | 75 |
Match score weights: distance 35% · size 25% · config 20% · recency 20%. Top-matched comps best support the ARV.
Projected returns pro-forma
-3.0% appreciation · 4.3% rent growth · sell at horizon
- IRR
- 63.9%
- Equity multiple
- 3.92×
- Total profit
- $40,014
- Equity at exit
- $7,306
- IRR
- 68.7%
- Equity multiple
- 8.42×
- Total profit
- $101,866
- Equity at exit
- $4,237
Cash invested: $13,720 (down + closing). Projections, not guarantees.
Landlord ↔ Tenant lean methodology
- Overall (STATE)
- 18 Strongly Tenant-Friendly
- State California
- 18 Strongly Tenant-Friendly · D+13
- County
- — inherits STATE
- City
- — inherits STATE
ZIP-level market 92308
- Home prices YoY
- -28.8%
- Rents YoY
- 4.3%
- Active inventory
- 432
- Price-to-rent
- 3.0×
Monthly cashflow live
- Estimated rent
- $1,346 medium interval (Pro) →
- Mortgage (P&I)
- −$257
- Tax est. 1.5%
- −$61 /mo · $735/yr
- Insurance
- −$20
- HOA
- −$0
- Lot rent leased land?
- −$0
- Vacancy / Maint / Mgmt
- −$283
- Net cashflow
- $725
Break-even live
Sensitivity live
| Price | -10% $758 | -5% $742 | +0% $725 | +5% $708 | +10% $691 |
|---|---|---|---|---|---|
| Rent | -10% $618 | -5% $671 | +0% $725 | +5% $778 | +10% $831 |
| Rate | -1.0pp $749 | -0.5pp $737 | base $725 | +0.5pp $712 | +1.0pp $699 |
UW: 25.0% down · 7.5% · 30yr · 1.5% tax · 5.0% vac · 8.0% maint · 8.0% mgmt
Financing live
Cash to close
- Down payment
- $12,250
- Closing costs
- $1,470
- Reserves months
- —
- Total cash needed
- —
Loan-product check · same deal, 3 products live
Conventional
25% down · 7.5% · 30yr
- Down + closing
- —
- Monthly P&I
- —
- Monthly cashflow
- —
- DSCR
- —
- Eligible?
- —
Personal DTI + credit; lowest rate.
DSCR
20% down · 8.5% · 30yr
- Down + closing
- —
- Monthly P&I
- —
- Monthly cashflow
- —
- DSCR
- —
- Eligible?
- —
No personal income docs; deal must DSCR.
Hard money
10% down · 12.0% · 12mo
- Down + closing
- —
- Monthly P&I
- —
- Monthly cashflow
- —
- DSCR
- —
- Eligible?
- —
Short-term bridge; refi at stabilization.
Rent comps 3 comps
| Address | Beds | Baths | Sqft | Rent | $/sqft | DOM | Units | Dist |
|---|---|---|---|---|---|---|---|---|
| 13193 Navajo Rd Unit 3 Apple Valley, CA | 1.0 | 1.0 | 614 | $1,350 | $2.20 | 46d | 1 | 0.99mi |
| 14080 Mohawk Rd Apple Valley, CA | 2.0 | 2.0 | 748 | $1,849 | $2.47 | 7d | 1 | 0.99mi |
| 14080 Mohawk Rd Apple Valley, CA | 2.0 | 2.0 | 748 | $1,850 | $2.47 | 26d | 1 | 0.99mi |
Listing history 19 events
-
2026-06-22days on market $49,000 Active 38 DOM
-
2026-06-21days on market $49,000 Active 37 DOM
-
2026-06-18days on market $49,000 Active 34 DOM
-
2026-06-17days on market $49,000 Active 33 DOM
-
2026-06-16days on market $49,000 Active 32 DOM
-
2026-06-15days on market $49,000 Active 31 DOM
-
2026-06-13days on market $49,000 Active 29 DOM
-
2026-06-13days on market $49,000 Active 28 DOM
-
2026-06-09days on market $49,000 Active 25 DOM
-
2026-06-08days on market $49,000 Active 24 DOM
-
2026-06-07days on market $49,000 Active 23 DOM
-
2026-06-04days on market $49,000 Active 20 DOM
-
2026-06-03days on market $49,000 Active 19 DOM
-
2026-06-02days on market $49,000 Active 18 DOM
-
2026-06-01days on market $49,000 Active 17 DOM
-
2026-05-31days on market $49,000 Active 16 DOM
-
2026-05-15$49,000 Active
-
2018-12-14soldstatus $14,000 431-char remark
Show marketing remark (431 chars)
Move right in nothing to do. 2 bedroom with bonus room or 3 bedroom!!! New kitchen floor. Seller will leave island for kitchen, pantry, washer and dryer. Check it out!!!!! Cash only or large down and owner carry # of RV Spaces: 0 Special Features: Breakfast Nook, Storage ShedNONE Lot Location Type: Standard Location FireplaceFeatures: None Zoning: Manufacturing # of Attached Spaces: 0 # of Detached Spaces: 0 # of RV Spaces: 0
-
2018-11-07$18,900 431-char remark
Show marketing remark (431 chars)
Move right in nothing to do. 2 bedroom with bonus room or 3 bedroom!!! New kitchen floor. Seller will leave island for kitchen, pantry, washer and dryer. Check it out!!!!! Cash only or large down and owner carry # of RV Spaces: 0 Special Features: Breakfast Nook, Storage ShedNONE Lot Location Type: Standard Location FireplaceFeatures: None Zoning: Manufacturing # of Attached Spaces: 0 # of Detached Spaces: 0 # of RV Spaces: 0
ⓘ Source: listings_history table (triggers on properties + properties_extension) + one-shot
backfill from property_details.listing_events for pre-trigger history.
Climate risk First Street
- Flood 1/10 Low FEMA zone D · 0% chance over 30 yrs
- Wildfire 6/10 Major
- Heat 7/10 Severe 1 d/yr ≥100°F today · 4 d/yr by 30 yrs out
- Wind 1/10 Low
- Air quality 10/10 Extreme 25 unhealthy d/yr today · 30 by 30 yrs out
Nearby sold comps map
Loading sold comps map…
Walkable amenities ~0.75 mi
Loading nearby amenities…
Taxation est. · year 1
- Rental income
- $16,150
- − Mortgage interest
- −$2,745
- − Property taxes
- −$735
- − Insurance
- −$245
- − Repairs & maintenance
- −$1,292
- − Management
- −$1,292
- − Depreciation
- −$1,425
- Taxable income
- $8,416
- Est. tax owed @ 24.0%
- −$2,020
- After-tax cash flow
- $6,675/yr
For passive investors: Depreciation is non-cash, so a rental often shows a tax loss while cash-flowing — sheltering income. Rental losses are passive: they offset passive income freely, and up to $25,000/yr can offset ordinary (W-2) income if you actively participate and your MAGI is under $100k (phasing out to $0 by $150k); unused losses carry forward. On sale, claimed depreciation is recaptured at up to 25%, and gains may owe capital-gains tax (a 1031 exchange can defer both). Figures are a year-1 estimate at your 24.0% rate — not tax advice; consult a CPA.
Condition & rehab AI · 10 photos
This doublewide mobile home requires moderate repairs and maintenance to improve its condition and value. Paint, awning, and HVAC upgrades are recommended to enhance its appeal and functionality.
Repairs flagged
- Minor Awning — Slight wear
- Minor Air conditioning unit — Standard unit, no visible damage
Value-add opportunities
- Resale Paint interior walls — Fresh paint enhances curb appeal and interior aesthetics
- Resale Replace awning — Fresh awning improves curb appeal and functionality
- Both Upgrade HVAC system — Modern HVAC system improves comfort and energy efficiency
Renovation cost estimate screening
| Repair item | Severity | Est. cost |
|---|---|---|
| Awning · Slight wear | Minor | $500–3,000 |
| Air conditioning unit · Standard unit, no visible damage | Minor | $500–3,000 |
| Total estimated repair cost · 2 items | $1,000–6,000 |
Value-add ROI direction
- Resale Paint interior walls — Fresh paint enhances curb appeal and interior aesthetics ↑
- Resale Replace awning — Fresh awning improves curb appeal and functionality ↑
- Both Upgrade HVAC system — Modern HVAC system improves comfort and energy efficiency ↑
ⓘ Cost ranges are severity-bucket heuristics (US national rule-of-thumb). Get contractor quotes + a written scope before underwriting a rehab budget.
Schools (NCES district)
- District
- Apple Valley Unified
- NCES district ID
- 0600017
- Math proficiency
- 25% ▬ 0.00%
- Reading proficiency
- 40% ▬ 0.00%
- Median HH income
- $49,264
- Composite
- 30.91/100
- National rank
- #11351
- State rank
- #955 of 1400 in CA
Livability — Apple Valley
- Score
- 61/100
- State rank
- #532
- US rank
- #17800
Category grades
Schools grade is shown separately in the Schools card above.
Census & demographics
- Census place
- Apple Valley, CA
- County
- San Bernardino County · 2,030,291 people
- City population
- 83,889
- Metro
- Riverside-San Bernardino-Ontario, CA
- Population (ZIP)
- 42,709
- Household income
- $66,568
- Rent vs Own
- Severe rent burden
- 1389.0
Population outlook (San Bernardino County) Hauer SSP2
- Today (2025)
- 2,300,329 people
- By 2030
- 2,378,907 · +3.4%
- By 2040
- 2,523,137 · +9.7%
- By 2050
- 2,642,388 · +14.9%
- By 2075
- 2,880,769 · +25.2%
- By 2100
- 2,909,436 · +26.5%
Race, ethnicity, and origin ACS 2023
- Neighborhood character
- Diverse neighborhood (Simpson 0.65)
- Race & ethnicity
- White 44% Hispanic / Latino 38% Two or more races 19% Black 9% Asian 3%
- Hispanic origin (detail)
- Mexican 34%
- Common ancestry
- Italian 1% Iranian 1% Slovak 1%
- Foreign-born
- 11% · Canada, South Korea
- Languages at home
- 75% English-only · Spanish 20% Tagalog/Filipino 1% Other Asian/Pacific 1%
Political lean MEDSL · San Bernardino
- 2024 margin
- Toss-up / Even · D 47.5% · R 49.7% · Other 2.8%
- 2008→2024 swing
- -8.5pp toward R · 2008: 6.3pp · 2024: -2.1pp
- All cycles
- 2024: R+2.1 2020: D+10.7 2016: D+9.8 2012: D+5.4 2008: D+6.3
Not yet ingested
- Civics
- —
Market trends
- HPI YoY
- ▼ -145.60%
- Current HPI
- 359.2305
- Rent YoY
- ▲ 4.30%
- Metro
- Riverside-San Bernardino-Ontario, CA
- State GDP YoY
- ▲ 3.21%
- F500 in state
- 116
Industry mix (Fortune 500 HQ in CA)
| Industry | F500 HQs | Revenue |
|---|---|---|
| Technology | 27 | $1,492B |
|
||
| Financial Services | 3 | $174B |
|
||
| Retail | 3 | $44B |
|
||
| Insurance | 3 | $26B |
|
||
| Media / Entertainment | 2 | $115B |
|
||
| Pharmaceuticals / Biotech | 2 | $62B |
|
||
Price history
+159.3% since first listed3 events — show timeline
- 2026-05-15 Listed $49,000 CRMLS
- 2018-12-14 Sold (MLS) $14,000 CRMLS
- 2018-11-07 Listed $18,900 CRMLS
Cash-flow waterfall
monthlySold comps — $/sqft
last 12 mo · ≤1 miLoading sold comps…