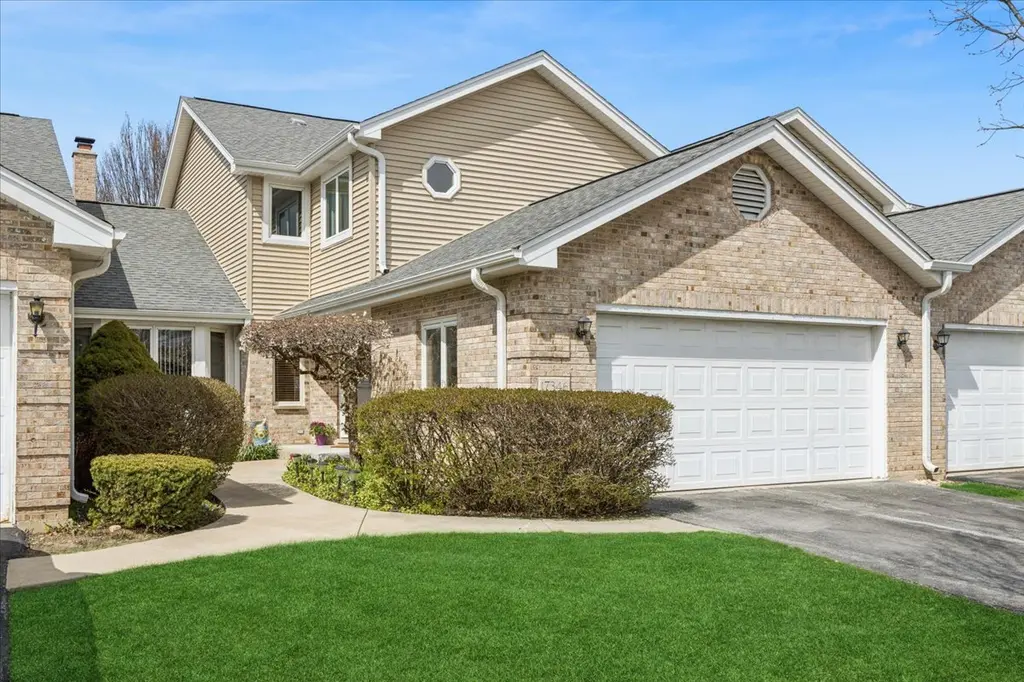
17346 Brook Crossing Ct · Orland Park, IL
Flood risk 1/10 · Minimal
- FEMA flood zone
- X (unshaded)
- Chance of flooding over 30 yrs
- 0.0%
- Est. flood insurance / yr
- $473 – $860
Fire risk 1/10 · Minimal
- Est. fire insurance / yr
- $804 – $1,492
Heat risk 3/10 · Minor
- Hot days now (above 102°F)
- 7 days/yr
- Hot days in 30 yrs
- 15 days/yr
Wind risk 2/10 · Minimal
- Chance of severe wind over 30 yrs
- —
Air-quality risk 2/10 · Minimal
- Unhealthy air days now
- 1 days/yr
- Unhealthy air days in 30 yrs
- 1 days/yr
Risk factors via First Street. Map © Google.
Why this score? — see what drove the C- grade
The composite is a weighted blend of 9 inputs, each scored 0–100. Each bar is that input's sub-score; the figure is the points it added to the 100-point composite (weight × sub-score).
- Cash flow +21.3/30.0
- DSCR +6.8/10.0
- 1% rule +6.0/10.0
- ARV discount +4.5/15.0
- Livability +4.2/5.0
- Schools +3.4/10.0
- Rent growth +2.5/5.0
- Condition / age +2.5/5.0
- Appreciation +0.0/10.0
$345,000
🖨 Deal sheet (PDF) 📄 Offer letter ✓ Due diligence
Listing remarks
Spacious Brook Hills, 2 bd, 2.5 bath, 2-story townhome with 2-car attached garage, back deck with new privacy fence, private courtyard views and finished basement (with potential 3rd bedroom option). HUGE primary bedroom with skylights, attached bathroom with luxurious whirlpool tub. Many updates: NEW flooring throughout, updated kitchen, completely remodeled main floor bathroom, new/ newer toilets throughout, updated lighting and most rooms freshly painted. Newer roof and new vinyl siding. Many windows have been replaced, HVAC 2017. Super clean, move-in ready. Located in a convenient location near shopping, train and parks/walking paths.
Key facts
- Privacy fence
- Finished basement
- Back deck
Tags
Property features AI
Finance
- Other: Six units in building; Living area based on assessor
- HOA & community: Monthly association fee of $235; HOA covers insurance, exterior maintenance, lawn care, and snow removal; Community amenities include park and trails; Manager off-site; Pets allowed with number limits
Exterior
- Parking: Attached garage (owned) with 2 garage spaces; Asphalt driveway; Garage door opener
- Utilities: Water from Lake Michigan; Public sewer
- Home design: Attached single property; Townhouse — 2 story; Entry level is 1; Fee simple ownership with homeowners association
- Construction: Built approximately 31–40 years ago; Vinyl siding and brick exterior; Asphalt roof; Concrete perimeter foundation
- Exterior features: Deck; School bus service and commuter train nearby
Interior
- Kitchen: Eating area/breakfast bar; Custom cabinetry; Granite counters; Range; Dishwasher; Refrigerator
- Bedrooms: Master bedroom on second level with full bath featuring whirlpool and separate shower; Additional bedroom on second level (14 x 17)
- Flooring: Laminate flooring in main living areas; Wood laminate in dining room, kitchen, and living room; Carpet in bedrooms and basement family room
- Bathrooms: Two full bathrooms; One half bathroom
- Fireplace: One wood-burning fireplace with gas starter in the living room
- Heating & cooling: Natural gas heating with forced air; Central air conditioning
- Interior features: Granite counters; Skylights; Partially finished full basement; Six total rooms
- Laundry & utility: Upper-level laundry; In-unit laundry with gas dryer hookup; Washer; Dryer
Neighborhood map
What this means for you Summary
Snapshot
- This is a 2-bed/2.5-bath townhouse listed at $345k.
Deal economics
- At list price, monthly cash flow is $505 ($6k/yr) — positive.
- The deal already cash-flows at list — no discount required.
- Meets the 1% rule at list price ($4k rent vs $345k).
- Cap rate 8.1% vs local median 4.3% in Orland Park — top-decile yield for the area; either an underpriced asset or a hidden risk that comps aren't pricing in. Stress-test before assuming the spread holds.
Location & tenants
- Location reads 85/100 on livability (#29 in IL, #529 nationally) — a professional / high-income tenant draw. Strengths: crime A+, amenities A+, commute A+.
- Cons Hsd 230 (suburban): math 35% / reading 39% proficiency, ranked #146 of 620 in IL (top 24%) — families likely to look elsewhere, expect single-tenant / working-renter base with shorter leases.
- Zoned schools: Carl Sandburg High School (math 41% / reading 45%, grade F, #72 of 693 statewide, top 10%, 2,894 students, 0% FRL).
- Market conditions: 118 active listings in the ZIP; 1 comparable units currently listed for rent nearby; 6,272 units permitted in Cook County in 2024 (4,658 in 5+ unit buildings).
Forward outlook
- Local home prices are declining (-3.0%/yr); year-one equity from $2k of loan paydown is wiped out by about $10k of value loss. Plan a longer hold.
Negotiation context
- Only 13 days on market — expect competitive offers; lowballing is unlikely to land.
- Current owner paid $269k; 28% above their basis — modest negotiation headroom, anchor on the comps not their cost.
Questions for the listing agent
- What does the HOA fee cover, when was the last increase, and are there any pending special assessments or reserve-fund shortfalls?
- Is there a deadline driving the sale (1031 exchange, divorce, estate, relocation)? That informs how much negotiation room exists.
- What's the average days-on-market for RENTAL listings here right now (not sales)? A rising rental-DOM trend means longer vacancies and softer asking-rent achievability than the comps imply.
- What's the recent tenant-quality profile in this submarket — average credit score on applications, eviction rate, late-payment / NSF rate, and stable-employment percentage? A property-management company in the area should have these aggregated.
- How much new for-sale + rental construction is in the pipeline within 1–3 miles? Heavy new supply typically softens prices + rents 12–24 months out; constrained supply supports both.
Investment metrics
- 1% rule
- 1.10% ✓
- Cap rate
- 8.05%
- Cash-on-cash
- 6.28%
- DSCR
- 1.28
- GRM
- 7.6
CMA / ARV
- ARV (on-the-fly)
- $323,750
- Comps found
- 12
Show comp detail 12 sales within ~0.75 mi
| Address | Dist | Beds/Ba | Sqft | Sold | Price | $/sf | Match |
|---|---|---|---|---|---|---|---|
| 17292 Lakebrook Dr | 0.16mi | 2/2.5 | 1,750 (0%) | 7mo | $324,000 | $185 | 87 |
| 17396 Brook Crossing Ln | 0.13mi | 2/2.5 | 1,645 (-6%) | 8mo | $335,000 | $204 | 78 |
| 17394 Brook Crossing Ln | 0.13mi | 2/3.0 | 1,645 (-6%) | 8mo | $335,000 | $204 | 75 |
| 11238 Cameron Pkwy | 0.49mi | 2/2.0 | 1,785 (+2%) | 5mo | $325,000 | $182 | 68 |
| 17800 Cameron Pkwy #17800 | 0.51mi | 2/2.0 | 1,822 (+4%) | 0mo | $320,000 | $176 | 67 |
| 17758 New Hampshire Ct | 0.68mi | 2/2.0 | 1,675 (-4%) | 2mo | $350,000 | $209 | 58 |
| 17708 Pennsylvania Ct | 0.56mi | 2/2.5 | 1,868 (+7%) | 7mo | $309,900 | $166 | 57 |
| 11053 Louetta Ln #193 | 0.48mi | 2/2.5 | 1,920 (+10%) | 6mo | $309,000 | $161 | 56 |
| 17816 New Hampshire Ct #137 | 0.71mi | 2/2.0 | 1,675 (-4%) | 8mo | $310,000 | $185 | 52 |
| 11011 New Mexico Ct #11011 | 0.63mi | 2/2.0 | 1,500 (-14%) | 4mo | $330,000 | $220 | 42 |
| 10958 New Mexico Ct #166 | 0.61mi | 2/2.5 | 2,000 (+14%) | 8mo | $293,000 | $147 | 41 |
| 10816 Kimberly Ln #48 | 0.66mi | 2/2.0 | 2,000 (+14%) | 7mo | $385,000 | $193 | 37 |
Match score weights: distance 35% · size 25% · config 20% · recency 20%. Top-matched comps best support the ARV.
Projected returns pro-forma
-3.0% appreciation · 3.0% rent growth · sell at horizon
- IRR
- -6.6%
- Equity multiple
- 0.76×
- Total profit
- $-23,598
- Equity at exit
- $51,441
- IRR
- 3.1%
- Equity multiple
- 1.22×
- Total profit
- $21,402
- Equity at exit
- $29,829
Cash invested: $96,600 (down + closing). Projections, not guarantees.
Landlord ↔ Tenant lean methodology
- Overall (STATE)
- 43 Moderately Tenant-Leaning
- State Illinois
- 43 Moderately Tenant-Leaning · D+7
- County
- — inherits STATE
- City
- — inherits STATE
ZIP-level market 60467
- Home prices YoY
- -30.4%
- Active inventory
- 118
- Price-to-rent
- 7.6×
Monthly cashflow live
- Estimated rent
- $3,800 medium interval (Pro) →
- Mortgage (P&I)
- −$1,809
- Tax from tax record
- −$309 /mo · $3,705/yr
- Insurance
- −$144
- HOA
- −$235
- Vacancy / Maint / Mgmt
- −$798
- Net cashflow
- $505
Break-even live
Sensitivity live
| Price | -10% $701 | -5% $603 | +0% $505 | +5% $408 | +10% $310 |
|---|---|---|---|---|---|
| Rent | -10% $205 | -5% $355 | +0% $505 | +5% $655 | +10% $805 |
| Rate | -1.0pp $679 | -0.5pp $593 | base $505 | +0.5pp $416 | +1.0pp $325 |
UW: 25.0% down · 7.5% · 30yr · 1.5% tax · 5.0% vac · 8.0% maint · 8.0% mgmt
Financing live
Cash to close
- Down payment
- $86,250
- Closing costs
- $10,350
- Reserves months
- —
- Total cash needed
- —
Loan-product check · same deal, 3 products live
Conventional
25% down · 7.5% · 30yr
- Down + closing
- —
- Monthly P&I
- —
- Monthly cashflow
- —
- DSCR
- —
- Eligible?
- —
Personal DTI + credit; lowest rate.
DSCR
20% down · 8.5% · 30yr
- Down + closing
- —
- Monthly P&I
- —
- Monthly cashflow
- —
- DSCR
- —
- Eligible?
- —
No personal income docs; deal must DSCR.
Hard money
10% down · 12.0% · 12mo
- Down + closing
- —
- Monthly P&I
- —
- Monthly cashflow
- —
- DSCR
- —
- Eligible?
- —
Short-term bridge; refi at stabilization.
Rent comps 1 comps
| Address | Beds | Baths | Sqft | Rent | $/sqft | DOM | Units | Dist |
|---|---|---|---|---|---|---|---|---|
| 16527 Orange Ave Orland Park, IL | 3.0 | 3.5 | 1870 | $3,800 | $2.03 | 4d | 1 | 1.04mi |
HOA detail
- Monthly dues
- $235 · $2,820/yr
- Likely covers
- pool
Listing history 23 events
-
2026-06-21days on market $345,000 Active 13 DOM
-
2026-06-18price $345,000 Active 10 DOM
-
2026-06-18days on market $349,900 Active 10 DOM
-
2026-06-17days on market $349,900 Active 9 DOM
-
2026-06-16days on market $349,900 Active 8 DOM
-
2026-06-15days on market $349,900 Active 7 DOM
-
2026-06-13days on market $349,900 Active 5 DOM
-
2026-06-08remarks 646-char remark
-
2026-06-08pricedays on market $349,900 Active 1 DOM
-
2026-06-07days on market $350,000 Active 58 DOM
-
2026-06-04days on market $350,000 Active 55 DOM
-
2026-06-03days on market $350,000 Active 54 DOM
-
2026-06-02days on market $350,000 Active 53 DOM
-
2026-06-01days on market $350,000 Active 52 DOM
-
2026-05-31days on market $350,000 Active 51 DOM
-
2026-05-13price $350,000
-
2026-04-24price $352,500
-
2026-04-10$355,000 Active
-
2026-04-09historical
-
2005-11-04soldstatus $269,000
-
2000-07-27soldstatus $167,500
-
1995-12-05soldstatus $237,000
-
1992-06-05soldstatus $154,000
ⓘ Source: listings_history table (triggers on properties + properties_extension) + one-shot
backfill from property_details.listing_events for pre-trigger history.
Tax reassessment forecast IL · Partial reset (capped growth)
- Current annual tax
- $3,705 · $309/mo
- Projected year-2 tax
- $5,768 · $481/mo
- Expected delta
- +$2,063/yr (+$172/mo · 55.7%)
ⓘ Screening estimate from a state-policy table — verify with the county assessor before closing.
Climate risk First Street
- Flood 1/10 Low FEMA zone X (unshaded) · 0% chance over 30 yrs
- Wildfire 1/10 Low
- Heat 3/10 Moderate 7 d/yr ≥102°F today · 15 d/yr by 30 yrs out
- Wind 2/10 Low
- Air quality 2/10 Low 1 unhealthy d/yr today · 1 by 30 yrs out
Nearby sold comps map
Loading sold comps map…
Walkable amenities ~0.75 mi
Loading nearby amenities…
Taxation est. · year 1
- Rental income
- $45,600
- − Mortgage interest
- −$19,325
- − Property taxes
- −$3,705
- − Insurance
- −$1,725
- − Repairs & maintenance
- −$3,648
- − Management
- −$3,648
- − HOA
- −$2,820
- − Depreciation
- −$10,036
- Taxable income
- $692
- Est. tax owed @ 24.0%
- −$166
- After-tax cash flow
- $5,897/yr
For passive investors: Depreciation is non-cash, so a rental often shows a tax loss while cash-flowing — sheltering income. Rental losses are passive: they offset passive income freely, and up to $25,000/yr can offset ordinary (W-2) income if you actively participate and your MAGI is under $100k (phasing out to $0 by $150k); unused losses carry forward. On sale, claimed depreciation is recaptured at up to 25%, and gains may owe capital-gains tax (a 1031 exchange can defer both). Figures are a year-1 estimate at your 24.0% rate — not tax advice; consult a CPA.
Schools (NCES district)
- District
- Cons Hsd 230
- NCES district ID
- 1708400
- Math proficiency
- 35% ▼ -8.00%
- Reading proficiency
- 39% ▼ -6.00%
- Median HH income
- $73,953
- Composite
- 34.29/100
- National rank
- #5244
- State rank
- #146 of 620 in IL
Livability — Orland Park
- Score
- 85/100
- State rank
- #29
- US rank
- #529
Category grades
Schools grade is shown separately in the Schools card above.
Census & demographics
- Census place
- Orland Park, IL
- City population
- 41,456
- Population (ZIP)
- 24,952
Population outlook (Cook County) Hauer SSP2
- Today (2025)
- 5,347,519 people
- By 2030
- 5,357,703 · +0.2%
- By 2040
- 5,324,924 · -0.4%
- By 2050
- 5,230,762 · -2.2%
- By 2075
- 4,785,735 · -10.5%
- By 2100
- 4,188,836 · -21.7%
Race, ethnicity, and origin ACS 2023
- Neighborhood character
- Predominantly White (83%)
- Race & ethnicity
- White 83% Hispanic / Latino 6% Asian 5% Two or more races 4% Black 4%
- Hispanic origin (detail)
- Mexican 5%
- Common ancestry
- Romanian 15% Armenian 2% Iranian 2%
- Foreign-born
- 14% · Canada, South Korea, China
- Languages at home
- 78% English-only · Arabic 9% Russian/Polish/Slavic 4% Other Indo-European 4%
Political lean MEDSL · Cook
- 2024 margin
- Solid D (+42.0) · D 70.4% · R 28.4% · Other 1.2%
- 2008→2024 swing
- -11.4pp toward R · 2008: 53.4pp · 2024: 42.0pp
- All cycles
- 2024: D+42.0 2020: D+50.3 2016: D+53.0 2012: D+49.4 2008: D+53.4
Not yet ingested
- Civics
- —
Market trends
- HPI YoY
- ▼ -82.13%
- Current HPI
- 188.3676
- Rent YoY
- —
- Metro
- —
- State GDP YoY
- ▲ 1.59%
- F500 in state
- 60
Industry mix (Fortune 500 HQ in IL)
| Industry | F500 HQs | Revenue |
|---|---|---|
| Insurance | 4 | $201B |
|
||
| Consumer Goods | 4 | $87B |
|
||
| Industrial Machinery | 3 | $64B |
|
||
| Healthcare | 2 | $55B |
|
||
| Retail / Pharmacy | 1 | $148B |
|
||
| Agriculture / Food | 1 | $86B |
|
||
Price history
+127.3% since first listed8 events — show timeline
- 2026-05-13 Price Changed $350,000 MRED as Distributed by MLS Grid
- 2026-04-24 Price Changed $352,500 MRED as Distributed by MLS Grid
- 2026-04-10 Listed $355,000 MRED as Distributed by MLS Grid
- 2026-04-09 Listing Removed — MRED as Distributed by MLS Grid
- 2005-11-04 Sold (Public Records) $269,000 Public Records
- 2000-07-27 Sold (Public Records) $167,500 Public Records
- 1995-12-05 Sold (Public Records) $237,000 Public Records
- 1992-06-05 Sold (Public Records) $154,000 Public Records
Property tax history
+0.1%/yrLatest (2023): $3,705 · -15.2% YoY. Source: county tax records.
Cash-flow waterfall
monthlySold comps — $/sqft
last 12 mo · ≤1 miLoading sold comps…