2827 E Michigan St · Indianapolis city (balance), IN
Flood risk 1/10 · Minimal
- FEMA flood zone
- X (unshaded)
- Chance of flooding over 30 yrs
- 0.0%
- Est. flood insurance / yr
- $507 – $1,088
Fire risk 1/10 · Minimal
- Est. fire insurance / yr
- $717 – $1,331
Heat risk 4/10 · Minor
- Hot days now (above 101°F)
- 7 days/yr
- Hot days in 30 yrs
- 19 days/yr
Wind risk 2/10 · Minimal
- Chance of severe wind over 30 yrs
- 1.0%
Air-quality risk 4/10 · Minor
- Unhealthy air days now
- 5 days/yr
- Unhealthy air days in 30 yrs
- 7 days/yr
Risk factors via First Street. Map © Google.
Why this score? — see what drove the C grade
The composite is a weighted blend of 9 inputs, each scored 0–100. Each bar is that input's sub-score; the figure is the points it added to the 100-point composite (weight × sub-score).
- Cash flow +23.0/30.0
- 1% rule +10.0/10.0
- ARV discount +7.5/15.0
- DSCR +7.4/10.0
- Rent growth +4.3/5.0
- Livability +2.5/5.0
- Condition / age +2.2/5.0
- Schools +1.4/10.0
- Appreciation +0.0/10.0
$75,000
🖨 Deal sheet 📄 Offer letter ✓ Due diligence
Listing remarks MLS
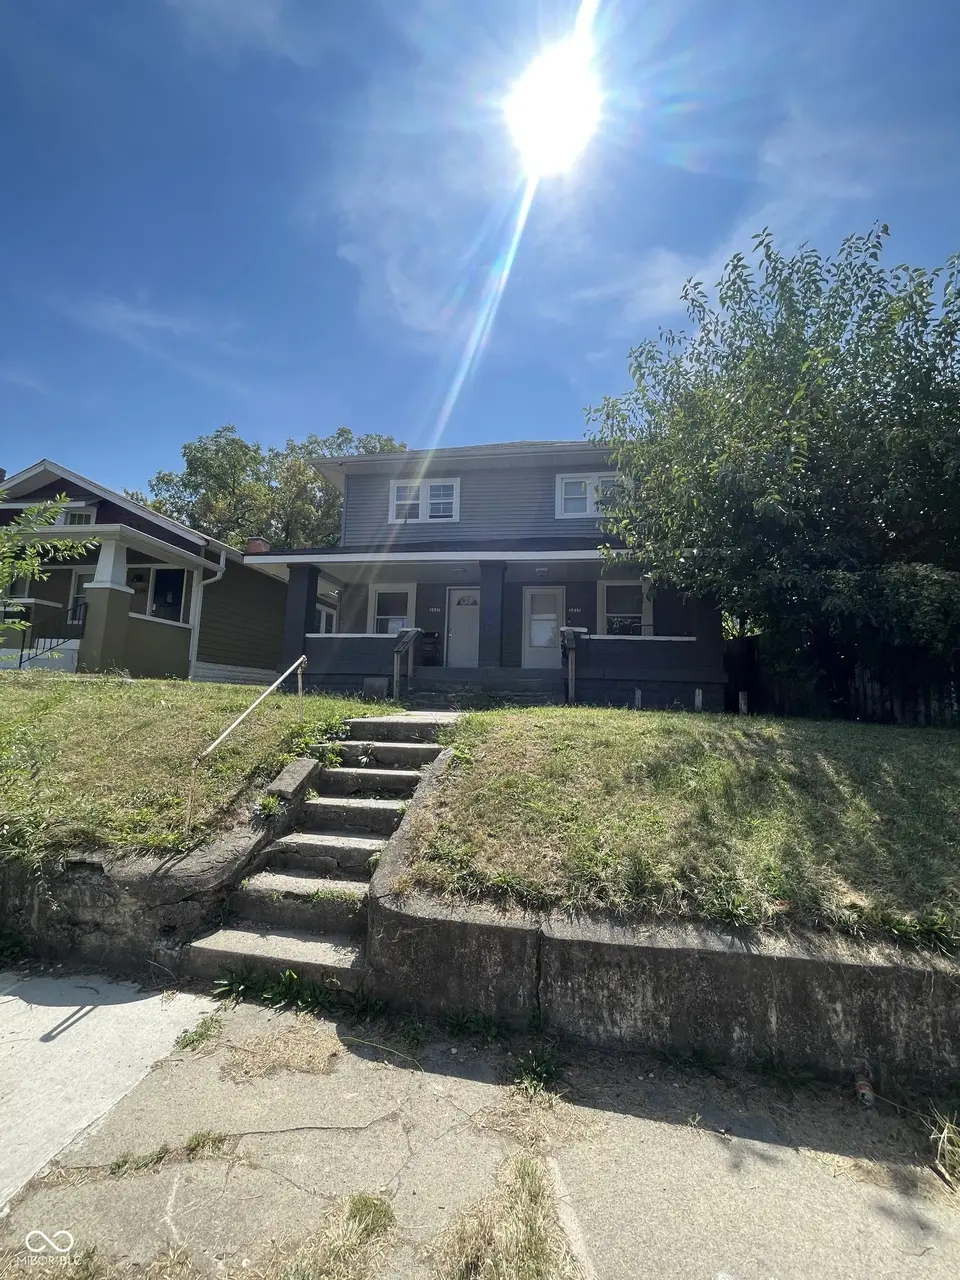
Discover the charm of 2825 E Michigan ST, INDIANAPOLIS, IN, USA. This inviting condominium, built in 1923, offers 1064 square feet of living space. The residence encompasses two comfortable bedrooms. A well-appointed full bathroom serves the home, designed for both functionality and ease. This two-story condominium also features an inviting porch, extending your living space outdoors for relaxation or welcoming guests. Put your own touch and complete the rehab to be a perfect home or rental. 2825 Michigan is also for sale and can be purchased together or individually.
Key facts
- Two distinct stories
- Inviting porch
- $185 HOA
Tags
Neighborhood map
What this means for you Summary
Snapshot
- This is a 2-bed/1.0-bath condo listed at $75k. Condition is rated fair.
Deal economics
- At list price, monthly cash flow is $134 ($2k/yr) — positive.
- The deal already cash-flows at list — no discount required.
- Meets the 1% rule at list price ($1k rent vs $75k).
- Recommended offer: $70k (6.0% below list) — sets the bar for market timing.
- Cap rate 8.4% vs local median 4.4% in Indianapolis city (balance) — top-decile yield for the area; either an underpriced asset or a hidden risk that comps aren't pricing in. Stress-test before assuming the spread holds.
Location & tenants
- Location reads: area grade C — affects rentability + tenant quality, not the cash-flow math above.
- Indianapolis Public Schools (urban): math 14% / reading 20% proficiency, ranked #286 of 301 in IN (top 95%) — low school quality limits family demand, transient renter base, plan for 1-2y turnover; 77% free/reduced lunch — lower-income household profile, screen leases tightly.
- Market conditions: Rents rising fast (+7.3%/yr); 480 active listings in the ZIP; 40 comparable units currently listed for rent nearby; rentals at typical pace (median 24d on market — plan ~3-4 weeks tenant-placement turnaround); 48% of comp listings sitting > 30 days — soft ceiling on asking rent; 1,906 units permitted in Marion County in 2024 (621 in 5+ unit buildings).
- This rent runs 32% of the median local income ($49k/yr) — at the standard rent-burdened threshold; future hikes will face affordability resistance.
Forward outlook
- Local home prices are declining (-3.0%/yr); year-one equity from $519 of loan paydown is wiped out by about $2k of value loss. Plan a longer hold.
- Marion County population projected at +18% by 2050 — long-run rental-demand tailwind backs the buy-and-hold thesis.
- At projected returns (-3.0% appreciation + 7.3% rent growth), your $21k cash investment doubles in ~8 years — after that, you're playing with house money.
Negotiation context
- It's been on market 61 days — a 6% lower offer ($70k) is reasonable based on typical stale-listing flexibility.
Risks & watch-outs
- Watch-outs: property tax is 4.8% of price; built in 1923 — expect roof / HVAC / electrical / plumbing capex.
Questions for the listing agent
- It's been on market 61 days. Have you received any prior offers? Is the seller open to a 6% concession, seller financing, or rate buy-down credit?
- Have any recent inspections been done? Can we get a copy of the seller's disclosures and any deferred-maintenance estimates?
- Built in 1923 — when were the roof, HVAC, electrical panel, plumbing, and water heater last replaced?
- Property tax is high relative to price — has the assessment been appealed recently, and will the sale trigger a re-assessment?
- What does the HOA fee cover, when was the last increase, and are there any pending special assessments or reserve-fund shortfalls?
- Any open or pending special assessments — roof, HVAC, plumbing, elevator, façade? What's the per-unit balance and payoff schedule, and is the seller paying it off at close or rolling it to the buyer?
- Why hasn't it sold? Are there any deal-killer items the seller is aware of (foundation, flood, title, zoning, code violations)?
- Is there a deadline driving the sale (1031 exchange, divorce, estate, relocation)? That informs how much negotiation room exists.
- What's the average days-on-market for RENTAL listings here right now (not sales)? A rising rental-DOM trend means longer vacancies and softer asking-rent achievability than the comps imply.
- What's the recent tenant-quality profile in this submarket — average credit score on applications, eviction rate, late-payment / NSF rate, and stable-employment percentage? A property-management company in the area should have these aggregated.
- How much new apartment / multifamily construction is in the pipeline within 1–3 miles? Heavy new supply (>2% of stock underway) typically softens rents 12–24 months out; light construction supports rent growth.
Investment metrics
- 1% rule
- 1.76% ✓
- Cap rate
- 8.43%
- Cash-on-cash
- 7.63%
- DSCR
- 1.34
- GRM
- 4.7
CMA / ARV
No comps found within radius.
Projected returns pro-forma
-3.0% appreciation · 7.31% rent growth · sell at horizon
- IRR
- 3.0%
- Equity multiple
- 1.12×
- Total profit
- $2,572
- Equity at exit
- $11,183
- IRR
- 18.0%
- Equity multiple
- 2.95×
- Total profit
- $40,970
- Equity at exit
- $6,485
Cash invested: $21,000 (down + closing). Projections, not guarantees.
Landlord ↔ Tenant lean methodology
- Overall (STATE)
- 90 Strongly Landlord-Friendly
- State Indiana
- 90 Strongly Landlord-Friendly · R+11
- County
- — inherits STATE
- City
- — inherits STATE
ZIP-level market 46201
- Home prices YoY
- -33.9%
- Rents YoY
- 7.3%
- Active inventory
- 480
- Price-to-rent
- 4.7×
Monthly cashflow live
- Estimated rent
- $1,317 high interval (Pro) →
- Mortgage (P&I)
- −$393
- Tax from tax record
- −$297 /mo · $3,564/yr
- Insurance
- −$31
- HOA
- −$185
- Vacancy / Maint / Mgmt
- −$277
- Net cashflow
- $134
Break-even live
UW: 25.0% down · 7.5% · 30yr · 1.5% tax · 5.0% vac · 8.0% maint · 8.0% mgmt
Financing live
Cash to close
- Down payment
- $18,750
- Closing costs
- $2,250
- Reserves months
- —
- Total cash needed
- —
Loan-product check · same deal, 3 products live
Conventional
25% down · 7.5% · 30yr
- Down + closing
- —
- Monthly P&I
- —
- Monthly cashflow
- —
- DSCR
- —
- Eligible?
- —
Personal DTI + credit; lowest rate.
DSCR
20% down · 8.5% · 30yr
- Down + closing
- —
- Monthly P&I
- —
- Monthly cashflow
- —
- DSCR
- —
- Eligible?
- —
No personal income docs; deal must DSCR.
Hard money
10% down · 12.0% · 12mo
- Down + closing
- —
- Monthly P&I
- —
- Monthly cashflow
- —
- DSCR
- —
- Eligible?
- —
Short-term bridge; refi at stabilization.
Rent comps 40 comps
| Address | Beds | Baths | Sqft | Rent | $/sqft | DOM | Units | Dist |
|---|---|---|---|---|---|---|---|---|
| 2903 E Michigan St Indianapolis, IN | 3.0 | 2.0 | 1310 | $1,650 | $1.26 | 14d | 1 | 0.04mi |
| 2814 E Michigan St Unit D Indianapolis, IN | 2.0 | 1.5 | 949 | $1,350 | $1.42 | 43d | 1 | 0.08mi |
| 2810 E Michigan St Unit C Indianapolis, IN | 2.0 | 1.5 | 949 | $1,350 | $1.42 | 43d | 1 | 0.09mi |
| 613-615 N Jefferson Indianapolis, IN | 3.0 | 1.0 | 1030 | $1,600 | $1.55 | 14d | 1 | 0.09mi |
| 408 N Oakland Ave Unit A Indianapolis, IN | 2.0 | 2.0 | 1100 | $995 | $0.90 | 17d | 1 | 0.11mi |
| 409 N Oakland Ave Unit 411 Indianapolis, IN | 3.0 | 2.0 | 1300 | $1,495 | $1.15 | 43d | 1 | 0.13mi |
| 418 Eastern Ave Indianapolis, IN | 3.0 | 1.0 | 1008 | $1,325 | $1.31 | 23d | 1 | 0.16mi |
| 313 Eastern Ave Indianapolis, IN | 2.0 | 1.0 | 1040 | $950 | $0.91 | 21d | 1 | 0.18mi |
| 619 N Rural St Indianapolis, IN | 3.0 | 2.0 | 1300 | $1,600 | $1.23 | 23d | 1 | 0.20mi |
| 430 N Dearborn St Indianapolis, IN | 3.0 | 1.0 | 1128 | $1,300 | $1.15 | 43d | 1 | 0.22mi |
| 510 N Dearborn St Indianapolis, IN | 3.0 | 1.0 | 1008 | $1,350 | $1.34 | 43d | 1 | 0.22mi |
| 235 N Oakland Ave Indianapolis, IN | 2.0 | 1.0 | 800 | $1,000 | $1.25 | 43d | 1 | 0.23mi |
| 639 N Rural St Indianapolis, IN | 3.0 | 1.0 | 1000 | $1,675 | $1.68 | 17d | 1 | 0.24mi |
| 253 N Gray St Indianapolis, IN | 3.0 | 1.5 | 1176 | $1,660 | $1.41 | 7d | 1 | 0.25mi |
| 632 N Gray St Indianapolis, IN | 3.0 | 1.0 | 960 | $1,800 | $1.88 | 43d | 1 | 0.27mi |
| 637 N Gray St Indianapolis, IN | 3.0 | 1.5 | 1120 | $1,150 | $1.03 | 44d | 1 | 0.29mi |
| 639 N Gray St Indianapolis, IN | 3.0 | 1.5 | 1120 | $1,220 | $1.09 | 43d | 1 | 0.29mi |
| 439 N Forest Ave Indianapolis, IN | 3.0 | 2.0 | 1030 | $1,200 | $1.17 | 23d | 1 | 0.30mi |
| 818 N Oakland Ave Unit 46201 Indianapolis, IN | 3.0 | 1.5 | 1332 | $1,550 | $1.16 | 43d | 1 | 0.31mi |
| 625 N Tacoma Ave Indianapolis, IN | 3.0 | 1.0 | 1160 | $1,350 | $1.16 | 10d | 1 | 0.35mi |
| 627 N Tacoma Ave Indianapolis, IN | 3.0 | 1.0 | 1160 | $1,350 | $1.16 | 10d | 1 | 0.35mi |
| 228 N Tacoma Ave Indianapolis, IN | 3.0 | 1.0 | 1200 | $1,100 | $0.92 | 10d | 1 | 0.35mi |
| 20 N Gray St Indianapolis, IN | 3.0 | 2.0 | 1300 | $1,800 | $1.38 | 43d | 1 | 0.35mi |
| 224 N Tacoma Ave Unit B TACOMA Indianapolis, IN | 1.0 | 1.0 | 1200 | $799 | $0.67 | 7d | 1 | 0.36mi |
| 849 N Rural St Unit 849 Indianapolis, IN | 3.0 | 2.5 | 1300 | $2,000 | $1.54 | 43d | 1 | 0.36mi |
| 851 N Rural St Indianapolis, IN | 3.0 | 2.5 | 1300 | $1,700 | $1.31 | 23d | 1 | 0.37mi |
| 39 N Tacoma Ave Indianapolis, IN | 3.0 | 1.0 | 1233 | $895 | $0.73 | 43d | 1 | 0.40mi |
| 850 N Dearborn St Indianapolis, IN | 1.0 | 1.0 | 784 | $750 | $0.96 | 43d | 1 | 0.40mi |
| 840 N Lasalle St Indianapolis, IN | 3.0 | 1.0 | 1215 | $1,100 | $0.91 | 23d | 1 | 0.42mi |
| 28 S Dearborn St Unit B Indianapolis, IN | 2.0 | 1.5 | 1166 | $1,150 | $0.99 | 23d | 1 | 0.48mi |
| 28 S Dearborn St Unit A Indianapolis, IN | 3.0 | 1.0 | 1100 | $1,400 | $1.27 | 10d | 1 | 0.48mi |
| 933 N Dearborn St Indianapolis, IN | 3.0 | 1.5 | 1204 | $1,500 | $1.25 | 43d | 1 | 0.48mi |
| 49 S Rural St Indianapolis, IN | 2.0 | 1.5 | 750 | $950 | $1.27 | 10d | 1 | 0.49mi |
| 3101 E 10th St #301 Indianapolis, IN | 2.0 | 1.0 | 921 | $1,195 | $1.30 | 43d | 1 | 0.51mi |
| 3030 E 10th St Indianapolis, IN | 2.0 | 1.0 | 950 | $900 | $0.95 | 21d | 1 | 0.53mi |
| 826 N Beville Ave Indianapolis, IN | 3.0 | 1.0 | 1472 | $1,295 | $0.88 | 2d | 1 | 0.53mi |
| 826 N Beville Ave Indianapolis, IN | 3.0 | 1.0 | 1472 | $1,295 | $0.88 | 4d | 1 | 0.53mi |
| 37 S Tuxedo St Indianapolis, IN | 3.0 | 1.0 | 950 | $1,150 | $1.21 | 43d | 1 | 0.56mi |
| 83 N Ewing St Unit 83 Indianapolis, IN | 3.0 | 1.0 | 1016 | $1,199 | $1.18 | 43d | 1 | 0.57mi |
| 416 N Hamilton Ave Unit 416-A Indianapolis, IN | 3.0 | 2.0 | 1350 | $1,500 | $1.11 | 43d | 1 | 0.57mi |
HOA detail condo
- Monthly dues
- $185 · $2,220/yr
- Assessments
- None detected in remarks — confirm with the listing agent.
Listing history 5 events
-
2026-06-03days on market $75,000 Active 61 DOM
-
2026-06-02days on market $75,000 Active 60 DOM
-
2026-06-01days on market $75,000 Active 59 DOM
-
2026-05-31days on market $75,000 Active 58 DOM
-
2026-04-03$75,000 Active 574-char remark
Show marketing remark (574 chars)
Discover the charm of 2825 E Michigan ST, INDIANAPOLIS, IN, USA. This inviting condominium, built in 1923, offers 1064 square feet of living space. The residence encompasses two comfortable bedrooms. A well-appointed full bathroom serves the home, designed for both functionality and ease. This two-story condominium also features an inviting porch, extending your living space outdoors for relaxation or welcoming guests. Put your own touch and complete the rehab to be a perfect home or rental. 2825 Michigan is also for sale and can be purchased together or individually.
ⓘ Source: listings_history table (triggers on properties + properties_extension) + one-shot
backfill from property_details.listing_events for pre-trigger history.
Tax reassessment forecast IN · Partial reset (capped growth)
- Current annual tax
- $3,564 · $297/mo
- Projected year-2 tax
- $3,564 · $297/mo
- Expected delta
- $0/yr ($0/mo · 0.0%)
ⓘ Screening estimate from a state-policy table — verify with the county assessor before closing.
Climate risk First Street
- Flood 1/10 Low FEMA zone X (unshaded) · 0% chance over 30 yrs
- Wildfire 1/10 Low
- Heat 4/10 Moderate 7 d/yr ≥101°F today · 19 d/yr by 30 yrs out
- Wind 2/10 Low 100% chance of damaging wind over 30 yrs
- Air quality 4/10 Moderate 5 unhealthy d/yr today · 7 by 30 yrs out
Nearby sold comps map
Loading sold comps map…
Walkable amenities ~0.75 mi
Loading nearby amenities…
Taxation est. · year 1
- Rental income
- $15,800
- − Mortgage interest
- −$4,201
- − Property taxes
- −$3,564
- − Insurance
- −$375
- − Repairs & maintenance
- −$1,264
- − Management
- −$1,264
- − HOA
- −$2,220
- − Depreciation
- −$2,182
- Taxable income
- $730
- Est. tax owed @ 24.0%
- −$175
- After-tax cash flow
- $1,428/yr
For passive investors: Depreciation is non-cash, so a rental often shows a tax loss while cash-flowing — sheltering income. Rental losses are passive: they offset passive income freely, and up to $25,000/yr can offset ordinary (W-2) income if you actively participate and your MAGI is under $100k (phasing out to $0 by $150k); unused losses carry forward. On sale, claimed depreciation is recaptured at up to 25%, and gains may owe capital-gains tax (a 1031 exchange can defer both). Figures are a year-1 estimate at your 24.0% rate — not tax advice; consult a CPA.
Condition & rehab AI · 4 photos
This two-story condominium requires moderate repairs and maintenance, including roof and exterior siding work, to improve its condition and value.
Repairs flagged
- Major roof — Signs of significant wear
- Major exterior siding — Weathered and peeling
- Major fencing — Old and in need of repair
Value-add opportunities
- Both Landscaping and exterior painting — Enhances curb appeal and value
- Both Roof repair — Critical for structural integrity and safety
- Both Exterior siding repair — Improves aesthetics and energy efficiency
Renovation cost estimate screening
| Repair item | Severity | Est. cost |
|---|---|---|
| roof · Signs of significant wear | Major | $15,000–50,000 |
| exterior siding · Weathered and peeling | Major | $15,000–50,000 |
| fencing · Old and in need of repair | Major | $15,000–50,000 |
| Total estimated repair cost · 3 items | $45,000–150,000 |
Value-add ROI direction
- Both Landscaping and exterior painting — Enhances curb appeal and value ↑
- Both Roof repair — Critical for structural integrity and safety ↑
- Both Exterior siding repair — Improves aesthetics and energy efficiency ↑
ⓘ Cost ranges are severity-bucket heuristics (US national rule-of-thumb). Get contractor quotes + a written scope before underwriting a rehab budget.
Schools (NCES district)
- District
- Indianapolis Public Schools
- NCES district ID
- 1804770
- Math proficiency
- 14% ▼ -7.00%
- Reading proficiency
- 20% ▼ -3.00%
- Median HH income
- $32,034
- Composite
- 13.69/100
- National rank
- #9499
- State rank
- #286 of 301 in IN
Livability — Indianapolis city (balance)
No livability data for this city. (Only ~50 U.S. cities are tracked.)
Census & demographics
- Census place
- Indianapolis city (balance), IN
- County
- Marion County · 998,460 people
- City population
- 881,119
- Metro
- Indianapolis-Carmel-Anderson, IN
- Population (ZIP)
- 30,335
- Household income
- $49,195
- Rent vs Own
- Severe rent burden
- 1906.0
Population outlook (Marion County) Hauer SSP2
- Today (2025)
- 1,025,572 people
- By 2030
- 1,065,727 · +3.9%
- By 2040
- 1,141,577 · +11.3%
- By 2050
- 1,208,920 · +17.9%
- By 2075
- 1,367,288 · +33.3%
- By 2100
- 1,438,201 · +40.2%
Race, ethnicity, and origin ACS 2023
- Neighborhood character
- Diverse neighborhood (Simpson 0.63)
- Race & ethnicity
- White 53% Hispanic / Latino 23% Black 18% Two or more races 9%
- Hispanic origin (detail)
- Mexican 14% Puerto Rican 2%
- Common ancestry
- Slovak 2% Lithuanian 2% Italian 1%
- Foreign-born
- 9% · Canada
- Languages at home
- 81% English-only · Spanish 17%
Political lean MEDSL · Marion
- 2024 margin
- Strong D (+27.7) · D 63.0% · R 35.3% · Other 1.7%
- 2008→2024 swing
- -0.7pp no change · 2008: 28.4pp · 2024: 27.7pp
- All cycles
- 2024: D+27.7 2020: D+29.1 2016: D+22.8 2012: D+22.2 2008: D+28.4
Not yet ingested
- Civics
- —
Market trends
- HPI YoY
- ▼ -192.51%
- Current HPI
- 375.0969
- Rent YoY
- ▲ 7.31%
- Metro
- Indianapolis-Carmel-Anderson, IN
- State GDP YoY
- ▲ 2.90%
- F500 in state
- 18
Industry mix (Fortune 500 HQ in IN)
| Industry | F500 HQs | Revenue |
|---|---|---|
| Industrial Machinery | 2 | $37B |
|
||
| Healthcare | 1 | $177B |
|
||
| Pharmaceuticals | 1 | $45B |
|
||
| Metals / Steel | 1 | $18B |
|
||
| Agriculture | 1 | $17B |
|
||
| Packaging | 1 | $12B |
|
||
Price history
1 event — show timeline
- 2026-04-03 Listed $75,000 MIBOR as Distributed by MLS Grid
Property tax history
+12.8%/yrLatest (2025): $3,564 · +15.3% YoY. Source: county tax records.
Cash-flow waterfall
monthlySold comps — $/sqft
last 12 mo · ≤1 miLoading sold comps…