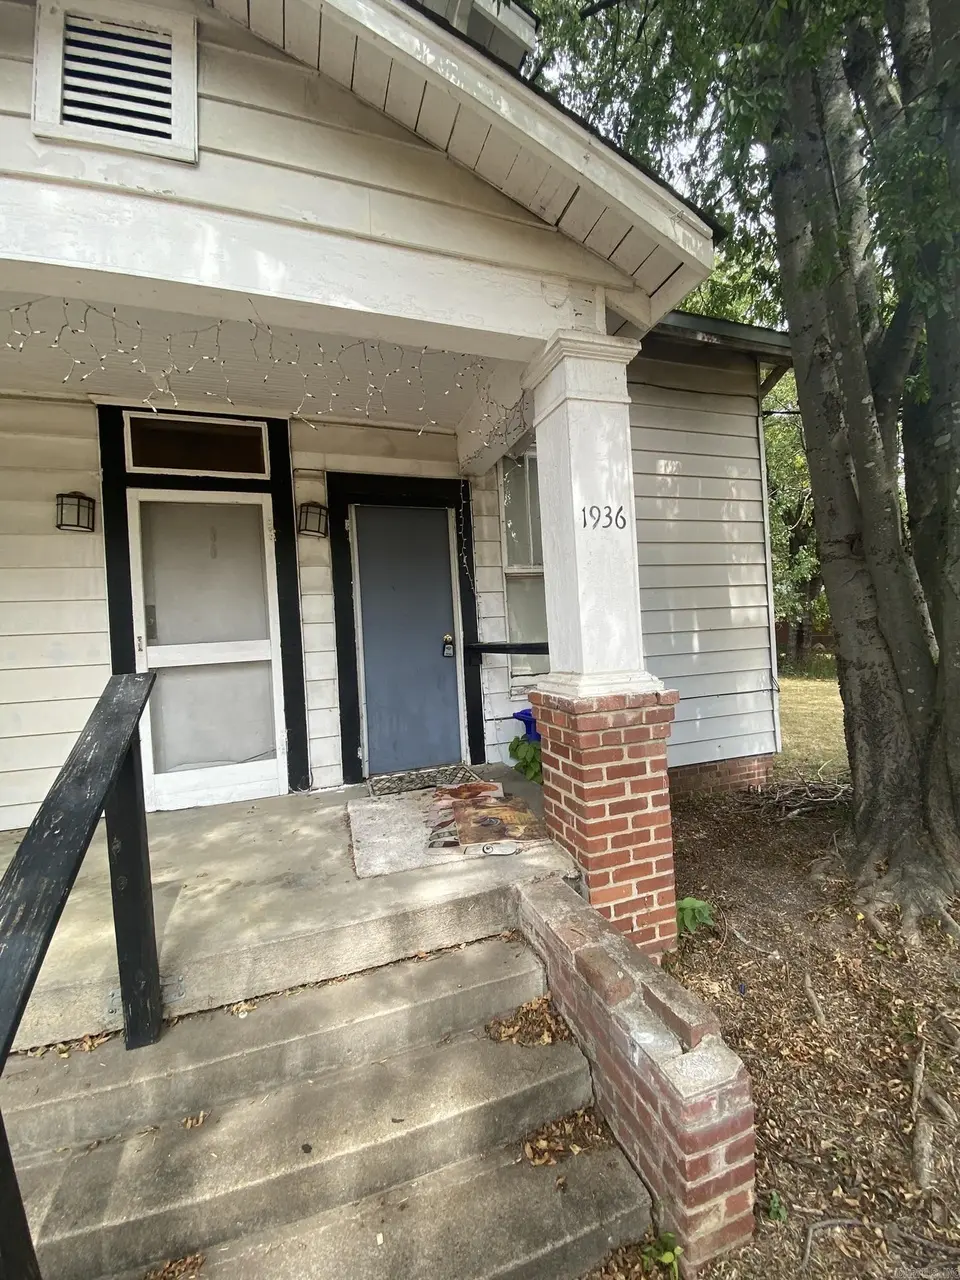
1936-1940 College Ave · Conway, AR
Flood risk 3/10 · Minor
- FEMA flood zone
- X (shaded)
- Chance of flooding over 30 yrs
- 0.2%
- Est. flood insurance / yr
- $507 – $1,088
Fire risk 2/10 · Minimal
- Est. fire insurance / yr
- $1,499 – $2,785
Heat risk 6/10 · Moderate
- Hot days now (above 111°F)
- 7 days/yr
- Hot days in 30 yrs
- 19 days/yr
Wind risk 4/10 · Minor
- Chance of severe wind over 30 yrs
- 8.0%
Air-quality risk 2/10 · Minimal
- Unhealthy air days now
- 0 days/yr
- Unhealthy air days in 30 yrs
- 1 days/yr
Risk factors via First Street. Map © Google.
Why this score? — see what drove the C+ grade
The composite is a weighted blend of 9 inputs, each scored 0–100. Each bar is that input's sub-score; the figure is the points it added to the 100-point composite (weight × sub-score).
- Cash flow +25.9/30.0
- DSCR +8.7/10.0
- ARV discount +7.5/15.0
- 1% rule +5.8/10.0
- Schools +3.8/10.0
- Livability +3.5/5.0
- Condition / age +2.5/5.0
- Rent growth +2.4/5.0
- Appreciation +0.0/10.0
$230,000
🖨 Deal sheet 📄 Offer letter ✓ Due diligence
Listing remarks MLS
Great location and income source. Quaint charm, with tall ceilings, original built-ins, some with glass fronts. All appliances in units will convey. Property sold "as is".
Key facts
- Rental property
- Investment property
- Triplex
Tags
Property features AI
Finance
- Financial info: Financing available: FHA, Conventional, or Cash
Exterior
- Parking: Parking pads for 3 cars
- Utilities: Public sewer; Public water; Municipal electric (Entergy); Natural gas
- Home design: Frame construction
- Construction: Frame exterior; Piers foundation; Pitch roof
- Exterior features: Front porch; Partially fenced yard; Paved road access; Level lot in a subdivision; Inside city limits
Interior
- Kitchen: Free-standing stove; Gas range; Electric range
- Flooring: Carpet; Vinyl
- Bathrooms: 3 full bathrooms
- Heating & cooling: Window units; Gas space heater
- Interior features: Washer connection; Electric dryer connection; Den/Family room
- Laundry & utility: Washer connection; Electric dryer connection
Neighborhood map
What this means for you Summary
Snapshot
- This is a 4-bed/3.0-bath townhouse listed at $230k.
Deal economics
- At list price, monthly cash flow is $566 ($7k/yr) — positive.
- The deal already cash-flows at list — no discount required.
- Meets the 1% rule at list price ($2k rent vs $230k).
- Recommended offer: $216k (6.0% below list) — sets the bar for market timing.
- Cap rate 9.2% vs local median 3.9% in Conway — top-decile yield for the area; either an underpriced asset or a hidden risk that comps aren't pricing in. Stress-test before assuming the spread holds.
Location & tenants
- Location reads 69/100 on livability (#71 in AR) — a middle-class / working-renter tenant base. Strengths: cost of living A+, housing A+, schools B; Watch: employment C-, crime F, amenities F.
- Conway School District (urban): math 43% / reading 47% proficiency, ranked #36 of 238 in AR (top 15%) — families likely to look elsewhere, expect single-tenant / working-renter base with shorter leases.
- Market conditions: Rents soft (-0.3%/yr); 262 active listings in the ZIP; 6 comparable units currently listed for rent nearby; rentals at typical pace (median 24d on market — plan ~3-4 weeks tenant-placement turnaround); 865 units permitted in Faulkner County in 2024 (451 in 5+ unit buildings).
- At $2,482/mo this rent would consume 45% of the median local household income ($66k/yr) (locally 2282% of renters already pay >50% of income on rent) — very limited rent-growth headroom before tenants either downsize or default.
Forward outlook
- Local home prices are declining (-3.0%/yr); year-one equity from $2k of loan paydown is wiped out by about $7k of value loss. Plan a longer hold.
- Faulkner County population projected at +32% by 2050 — long-run rental-demand tailwind backs the buy-and-hold thesis.
Negotiation context
- It's been on market 82 days — a 6% lower offer ($216k) is reasonable based on typical stale-listing flexibility.
- 2 sale attempts since 14y ago with the ask held roughly flat each time — persistent listings suggest the price (not the market) is what's stuck; bring a comps-based counter.
- Current owner paid $61k; list at $230k implies a 277% gain — meaningful room to come down on a strong offer.
Risks & watch-outs
- Watch-outs: built in 1937 — expect roof / HVAC / electrical / plumbing capex.
- Climate carrying-cost: extreme-heat days projected 7→19/yr by 2055 (HVAC capex compounding) — expect insurance premiums to compound above CPI over the hold.
Questions for the listing agent
- It's been on market 82 days. Have you received any prior offers? Is the seller open to a 6% concession, seller financing, or rate buy-down credit?
- Built in 1937 — when were the roof, HVAC, electrical panel, plumbing, and water heater last replaced?
- Why hasn't it sold? Are there any deal-killer items the seller is aware of (foundation, flood, title, zoning, code violations)?
- Is there a deadline driving the sale (1031 exchange, divorce, estate, relocation)? That informs how much negotiation room exists.
- Schools are B-rated — typically a magnet for longer-tenancy family renters. What's the average tenant stay here, and is there a school-zone premium baked into asking?
- Crime grade is F in this area — have there been break-ins, vandalism, or insurance claims at this property in the last 3 years? What carrier currently insures it and at what premium?
- What's the average days-on-market for RENTAL listings here right now (not sales)? A rising rental-DOM trend means longer vacancies and softer asking-rent achievability than the comps imply.
- What's the recent tenant-quality profile in this submarket — average credit score on applications, eviction rate, late-payment / NSF rate, and stable-employment percentage? A property-management company in the area should have these aggregated.
- How much new for-sale + rental construction is in the pipeline within 1–3 miles? Heavy new supply typically softens prices + rents 12–24 months out; constrained supply supports both.
Investment metrics
- 1% rule
- 1.08% ✓
- Cap rate
- 9.24%
- Cash-on-cash
- 10.54%
- DSCR
- 1.47
- GRM
- 7.7
CMA / ARV
No comps found within radius.
Projected returns pro-forma
-3.0% appreciation · 0.0% rent growth · sell at horizon
- IRR
- -3.7%
- Equity multiple
- 0.87×
- Total profit
- $-8,589
- Equity at exit
- $34,294
- IRR
- 2.6%
- Equity multiple
- 1.16×
- Total profit
- $10,483
- Equity at exit
- $19,886
Cash invested: $64,400 (down + closing). Projections, not guarantees.
Landlord ↔ Tenant lean methodology
- Overall (STATE)
- 92 Strongly Landlord-Friendly
- State Arkansas
- 92 Strongly Landlord-Friendly · R+14
- County
- — inherits STATE
- City
- — inherits STATE
ZIP-level market 72034
- Rents YoY
- -0.3%
- Active inventory
- 262
- Price-to-rent
- 7.7×
Monthly cashflow live
- Estimated rent
- $2,482 high interval (Pro) →
- Mortgage (P&I)
- −$1,206
- Tax from tax record
- −$93 /mo · $1,113/yr
- Insurance
- −$96
- HOA
- −$0
- Vacancy / Maint / Mgmt
- −$521
- Net cashflow
- $566
Break-even live
UW: 25.0% down · 7.5% · 30yr · 1.5% tax · 5.0% vac · 8.0% maint · 8.0% mgmt
Financing live
Cash to close
- Down payment
- $57,500
- Closing costs
- $6,900
- Reserves months
- —
- Total cash needed
- —
Loan-product check · same deal, 3 products live
Conventional
25% down · 7.5% · 30yr
- Down + closing
- —
- Monthly P&I
- —
- Monthly cashflow
- —
- DSCR
- —
- Eligible?
- —
Personal DTI + credit; lowest rate.
DSCR
20% down · 8.5% · 30yr
- Down + closing
- —
- Monthly P&I
- —
- Monthly cashflow
- —
- DSCR
- —
- Eligible?
- —
No personal income docs; deal must DSCR.
Hard money
10% down · 12.0% · 12mo
- Down + closing
- —
- Monthly P&I
- —
- Monthly cashflow
- —
- DSCR
- —
- Eligible?
- —
Short-term bridge; refi at stabilization.
Rent comps 6 comps
| Address | Beds | Baths | Sqft | Rent | $/sqft | DOM | Units | Dist |
|---|---|---|---|---|---|---|---|---|
| 1930 College Ave Conway, AR | 3.0 | 2.0 | 1926 | $3,100 | $1.61 | 23d | 1 | 0.03mi |
| 22 Timothy Ln Conway, AR | 4.0 | 2.0 | 1901 | $2,000 | $1.05 | 23d | 1 | 0.47mi |
| 235 Oliver St Conway, AR | 3.0 | 2.0 | 1414 | $1,450 | $1.03 | 23d | 1 | 0.64mi |
| 2004 Hairston St Conway, AR | 3.0 | 2.0 | 1703 | $2,650 | $1.56 | 23d | 1 | 1.00mi |
| 513 3rd St Conway, AR | 3.0 | 2.0 | 1428 | $1,250 | $0.88 | 23d | 1 | 1.10mi |
| 2730 Dave Ward Dr Conway, AR | 2.0–4.0 | 2.0–4.0 | 1302 | $1,450 | $1.11 | 14d | 3 | 1.25mi |
Listing history 14 events
-
2026-06-10days on market $230,000 Active 82 DOM
-
2026-06-09days on market $230,000 Active 81 DOM
-
2026-06-08days on market $230,000 Active 80 DOM
-
2026-06-07days on market $230,000 Active 79 DOM
-
2026-06-03days on market $230,000 Active 75 DOM
-
2026-06-02days on market $230,000 Active 74 DOM
-
2026-06-01days on market $230,000 Active 73 DOM
-
2026-05-31days on market $230,000 Active 72 DOM
-
2026-05-31days on market $230,000 Active 71 DOM
-
2026-03-20$230,000 New Listing
-
2012-12-14soldstatus $61,000 181-char remark
Show marketing remark (181 chars)
Great location and income source. Quaint charm, with tall ceilings, original built-ins, some with glass fronts. All appliances in units will convey. Property sold "as is".
-
2012-12-11historical 181-char remark
Show marketing remark (181 chars)
Great location and income source. Quaint charm, with tall ceilings, original built-ins, some with glass fronts. All appliances in units will convey. Property sold "as is".
-
2012-12-03$61,000 181-char remark
Show marketing remark (181 chars)
Great location and income source. Quaint charm, with tall ceilings, original built-ins, some with glass fronts. All appliances in units will convey. Property sold "as is".
-
1978-07-18soldstatus $30,000
ⓘ Source: listings_history table (triggers on properties + properties_extension) + one-shot
backfill from property_details.listing_events for pre-trigger history.
Tax reassessment forecast AR · Resets to sale price
- Current annual tax
- $1,113 · $93/mo
- Projected year-2 tax
- $1,472 · $123/mo
- Expected delta
- +$359/yr (+$30/mo · 32.2%)
ⓘ Screening estimate from a state-policy table — verify with the county assessor before closing.
Climate risk First Street
- Flood 3/10 Moderate FEMA zone X (shaded) · 20% chance over 30 yrs
- Wildfire 2/10 Low
- Heat 6/10 Major 7 d/yr ≥111°F today · 19 d/yr by 30 yrs out
- Wind 4/10 Moderate 8% chance of damaging wind over 30 yrs
- Air quality 2/10 Low 0 unhealthy d/yr today · 1 by 30 yrs out
Nearby sold comps map
Loading sold comps map…
Walkable amenities ~0.75 mi
Loading nearby amenities…
Taxation est. · year 1
- Rental income
- $29,781
- − Mortgage interest
- −$12,884
- − Property taxes
- −$1,113
- − Insurance
- −$1,150
- − Repairs & maintenance
- −$2,382
- − Management
- −$2,382
- − Depreciation
- −$6,691
- Taxable income
- $3,178
- Est. tax owed @ 24.0%
- −$763
- After-tax cash flow
- $6,027/yr
For passive investors: Depreciation is non-cash, so a rental often shows a tax loss while cash-flowing — sheltering income. Rental losses are passive: they offset passive income freely, and up to $25,000/yr can offset ordinary (W-2) income if you actively participate and your MAGI is under $100k (phasing out to $0 by $150k); unused losses carry forward. On sale, claimed depreciation is recaptured at up to 25%, and gains may owe capital-gains tax (a 1031 exchange can defer both). Figures are a year-1 estimate at your 24.0% rate — not tax advice; consult a CPA.
Schools (NCES district)
- District
- Conway School District
- NCES district ID
- 0504590
- Math proficiency
- 43% ▼ -17.00%
- Reading proficiency
- 47% ▼ -9.00%
- Median HH income
- $46,270
- Composite
- 38.27/100
- National rank
- #4236
- State rank
- #36 of 238 in AR
Livability — Conway
- Score
- 69/100
- State rank
- #71
- US rank
- #8673
Category grades
Schools grade is shown separately in the Schools card above.
Census & demographics
- Census place
- Conway, AR
- County
- Faulkner County · 103,634 people
- City population
- 84,754
- Metro
- Little Rock-North Little Rock-Conway, AR
- Population (ZIP)
- 50,285
- Household income
- $65,635
- Rent vs Own
- Severe rent burden
- 2282.0
Population outlook (Faulkner County) Hauer SSP2
- Today (2025)
- 138,985 people
- By 2030
- 148,264 · +6.7%
- By 2040
- 166,010 · +19.4%
- By 2050
- 183,362 · +31.9%
- By 2075
- 224,593 · +61.6%
- By 2100
- 250,603 · +80.3%
Race, ethnicity, and origin ACS 2023
- Neighborhood character
- Predominantly White (71%)
- Race & ethnicity
- White 71% Black 17% Hispanic / Latino 5% Two or more races 5% Asian 2%
- Hispanic origin (detail)
- Mexican 3%
- Common ancestry
- Slovak 2% Lithuanian 2% Italian 1%
- Foreign-born
- 4% · Canada, South Korea
- Languages at home
- 94% English-only · Spanish 3% Korean 1%
Political lean MEDSL · Faulkner
- 2024 margin
- Solid R (+32.3) · D 32.6% · R 64.9% · Other 2.5%
- 2008→2024 swing
- -7.1pp toward R · 2008: -25.3pp · 2024: -32.3pp
- All cycles
- 2024: R+32.3 2020: R+29.5 2016: R+31.6 2012: R+31.7 2008: R+25.3
Not yet ingested
- Civics
- —
Market trends
- HPI YoY
- ▼ -122.99%
- Current HPI
- 225.7805
- Rent YoY
- ▼ -0.28%
- Metro
- Little Rock-North Little Rock-Conway, AR
- State GDP YoY
- ▲ 3.80%
- F500 in state
- 10
Industry mix (Fortune 500 HQ in AR)
| Industry | F500 HQs | Revenue |
|---|---|---|
| Retail | 1 | $681B |
|
||
| Food / Agriculture | 1 | $53B |
|
||
| Retail / Energy | 1 | $22B |
|
||
| Transportation / Logistics | 1 | $12B |
|
||
| Energy | 1 | $4B |
|
||
Price history
+666.7% since first listed5 events — show timeline
- 2026-03-20 Listed $230,000 CARMLS
- 2012-12-14 Sold (MLS) $61,000 CARMLS
- 2012-12-11 Listing Removed — CARMLS
- 2012-12-03 Listed $61,000 CARMLS
- 1978-07-18 Sold (Public Records) $30,000 Public Records
Property tax history
+3.7%/yrLatest (2025): $1,113 · +9.1% YoY. Source: county tax records.
Cash-flow waterfall
monthlySold comps — $/sqft
last 12 mo · ≤1 miLoading sold comps…