 10-Plex
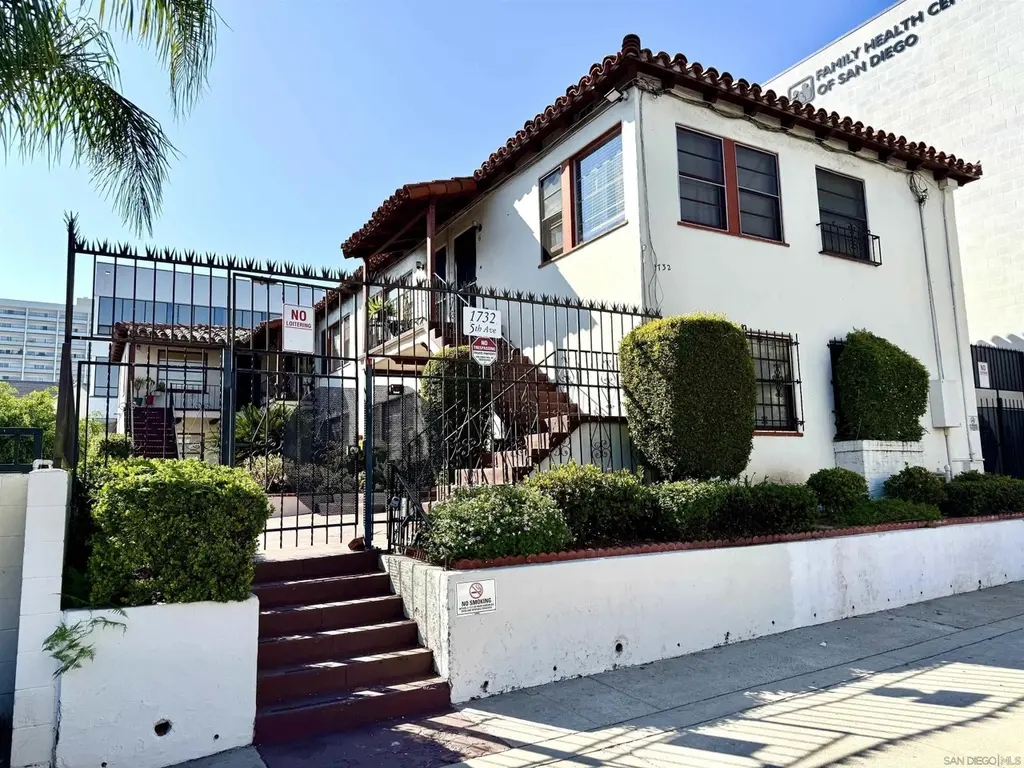
1732 5th Ave · San Diego, CA
Flood risk 1/10 · Minimal
- FEMA flood zone
- X (unshaded)
- Chance of flooding over 30 yrs
- 0.0%
- Est. flood insurance / yr
- $507 – $1,088
Fire risk 1/10 · Minimal
- Est. fire insurance / yr
- $659 – $1,223
Heat risk 4/10 · Minor
- Hot days now (above 84°F)
- 7 days/yr
- Hot days in 30 yrs
- 20 days/yr
Wind risk 1/10 · Minimal
- Chance of severe wind over 30 yrs
- —
Air-quality risk 4/10 · Minor
- Unhealthy air days now
- 4 days/yr
- Unhealthy air days in 30 yrs
- 4 days/yr
Risk factors via First Street. Map © Google.
Why this score? — see what drove the B- grade
The composite is a weighted blend of 9 inputs, each scored 0–100. Each bar is that input's sub-score; the figure is the points it added to the 100-point composite (weight × sub-score).
- Cash flow +27.3/30.0
- DSCR +9.5/10.0
- ARV discount +7.5/15.0
- 1% rule +6.5/10.0
- Appreciation +4.1/10.0
- Livability +3.8/5.0
- Rent growth +2.6/5.0
- Condition / age +2.5/5.0
- Schools +2.2/10.0
$2,490,000
🖨 Deal sheet 📄 Offer letter ✓ Due diligence
Multi-family units
County records classify this as Multi-Family (5+ Unit). Listing-text estimate: 10 units. confirmed
5+ unit building — per-unit beds/baths from public records are typically unavailable; the breakdown below (if shown) is an estimate from the listing text.
Listing remarks
pleased to present 1732 5th Avenue, a 10-unit apartment community located in the heart of Downtown San Diego. Originally constructed in 1938, the property features a unit mix of eight (8) studio units and two (2) one-bedroom / one-bath units, catering to a wide range of urban renters. The property is an extremely well-maintained vintage asset with long-term tenants currently paying below-market rents, presenting a compelling value-add opportunity through renovation and repositioning of units. Many units retain original finishes, offering investors the ability to modernize interiors and capture significant rental upside. 1732 5th Avenue offers a unique blend of historic charm and functional
Key facts
- Historic charm
- Roof replacement
- Functional layouts
Tags
Property features AI
Exterior
- Utilities: Lot size reported in acres
- Home design: Residential income property (Commercial-Residential Income subtype)
- Construction: Approximately 4,624 total building area
Interior
- Bathrooms: 10 full bathrooms
- Interior features: Ten full bathrooms
Neighborhood map
What this means for you Summary
Snapshot
- This is a 10 × 2-bed/1.0-bath units multifamily listed at $2.49M.
Deal economics
- At list price, monthly cash flow is $7k ($87k/yr) — positive. Per door: $724/mo.
- The deal already cash-flows at list — no discount required.
- Meets the 1% rule at list price ($29k rent vs $2.49M).
- Recommended offer: $2.42M (3.0% below list) — sets the bar for market timing.
- Cap rate 9.8% vs local median 2.0% in San Diego — top-decile yield for the area; either an underpriced asset or a hidden risk that comps aren't pricing in. Stress-test before assuming the spread holds.
Location & tenants
- Location reads 75/100 on livability (#123 in CA, #4,206 nationally) — a middle-class / working-renter tenant base. Strengths: amenities A+, commute A+, employment A+; Watch: health & safety C-, crime D+, cost of living F.
- San Diego Unified (urban): math 19% / reading 29% proficiency, ranked #393 of 517 in CA (top 76%) — low school quality limits family demand, transient renter base, plan for 1-2y turnover.
- Market conditions: Rents flat; 515 active listings in the ZIP; solid renter incomes; 11,759 units permitted in San Diego County in 2024 (7,244 in 5+ unit buildings).
- At $28,714/mo this rent would consume 376% of the median local household income ($92k/yr) (locally 5603% of renters already pay >50% of income on rent) — very limited rent-growth headroom before tenants either downsize or default.
Forward outlook
- Local home prices are declining (-1.8%/yr); year-one equity from $17k of loan paydown is wiped out by about $45k of value loss. Plan a longer hold.
- San Diego County population projected at +20% by 2050 — long-run rental-demand tailwind backs the buy-and-hold thesis.
- At projected returns (-1.8% appreciation + 0.3% rent growth), your $697k cash investment doubles in ~10 years — after that, you're playing with house money.
Negotiation context
- It's been on market 37 days — a 3% lower offer ($2.42M) is reasonable based on typical stale-listing flexibility.
- 2 sale attempts since 3y ago with the ask held roughly flat each time — persistent listings suggest the price (not the market) is what's stuck; bring a comps-based counter.
- Current owner paid $1.20M; list at $2.49M implies a 108% gain — meaningful room to come down on a strong offer.
Risks & watch-outs
- Watch-outs: built in 1945 — expect roof / HVAC / electrical / plumbing capex.
Questions for the listing agent
- It's been on market 37 days. Have you received any prior offers? Is the seller open to a 3% concession, seller financing, or rate buy-down credit?
- Can we see the unit-by-unit rent roll, current vacancy, and any below-market leases? What's the average tenancy length?
- What capital expenditures (roof, boiler, parking lot, exteriors) have been made in the last 5 years, and what's planned in the next 2?
- Built in 1945 — when were the roof, HVAC, electrical panel, plumbing, and water heater last replaced?
- Is there a deadline driving the sale (1031 exchange, divorce, estate, relocation)? That informs how much negotiation room exists.
- Schools are B-rated — typically a magnet for longer-tenancy family renters. What's the average tenant stay here, and is there a school-zone premium baked into asking?
- Crime grade is D in this area — have there been break-ins, vandalism, or insurance claims at this property in the last 3 years? What carrier currently insures it and at what premium?
- What's the average days-on-market for RENTAL listings here right now (not sales)? A rising rental-DOM trend means longer vacancies and softer asking-rent achievability than the comps imply.
- What's the recent tenant-quality profile in this submarket — average credit score on applications, eviction rate, late-payment / NSF rate, and stable-employment percentage? A property-management company in the area should have these aggregated.
- How much new apartment / multifamily construction is in the pipeline within 1–3 miles? Heavy new supply (>2% of stock underway) typically softens rents 12–24 months out; light construction supports rent growth.
Investment metrics
- 1% rule
- 1.15% ✓
- Cap rate
- 9.78%
- Cash-on-cash
- 12.45%
- DSCR
- 1.55
- GRM
- 7.2
CMA / ARV
No comps found within radius.
Projected returns pro-forma
-1.82% appreciation · 0.35% rent growth · sell at horizon
- IRR
- 3.8%
- Equity multiple
- 1.15×
- Total profit
- $107,856
- Equity at exit
- $505,061
- IRR
- 9.1%
- Equity multiple
- 1.73×
- Total profit
- $507,646
- Equity at exit
- $452,265
Cash invested: $697,200 (down + closing). Projections, not guarantees.
Landlord ↔ Tenant lean methodology
- Overall (STATE)
- 18 Strongly Tenant-Friendly
- State California
- 18 Strongly Tenant-Friendly · D+13
- County
- — inherits STATE
- City
- — inherits STATE
ZIP-level market 92101
- Home prices YoY
- -0.8%
- Rents YoY
- 0.3%
- Active inventory
- 515
- Price-to-rent
- 72.3×
Monthly cashflow live
- Estimated rent
- $28,714 high interval (Pro) →
- Mortgage (P&I)
- −$13,058
- Tax from tax record
- −$1,354 /mo · $16,242/yr
- Insurance
- −$1,038
- HOA
- −$0
- Vacancy / Maint / Mgmt
- −$6,030
- Net cashflow
- $7,235
Break-even live
10-unit breakdown (identical units grouped — click to expand)
| Units | Beds | Baths | Est. rent |
|---|---|---|---|
| 10× units | 2 | 1 | $28,710 |
| #1 | 2 | 1 | $2,871 |
| #2 | 2 | 1 | $2,871 |
| #3 | 2 | 1 | $2,871 |
| #4 | 2 | 1 | $2,871 |
| #5 | 2 | 1 | $2,871 |
| #6 | 2 | 1 | $2,871 |
| #7 | 2 | 1 | $2,871 |
| #8 | 2 | 1 | $2,871 |
| #9 | 2 | 1 | $2,871 |
| #10 | 2 | 1 | $2,871 |
| Total (10 units) | $28,714 | ||
UW: 25.0% down · 7.5% · 30yr · 1.5% tax · 5.0% vac · 8.0% maint · 8.0% mgmt
Financing live
Cash to close
- Down payment
- $622,500
- Closing costs
- $74,700
- Reserves months
- —
- Total cash needed
- —
Loan-product check · same deal, 3 products live
Conventional
25% down · 7.5% · 30yr
- Down + closing
- —
- Monthly P&I
- —
- Monthly cashflow
- —
- DSCR
- —
- Eligible?
- —
Personal DTI + credit; lowest rate.
DSCR
20% down · 8.5% · 30yr
- Down + closing
- —
- Monthly P&I
- —
- Monthly cashflow
- —
- DSCR
- —
- Eligible?
- —
No personal income docs; deal must DSCR.
Hard money
10% down · 12.0% · 12mo
- Down + closing
- —
- Monthly P&I
- —
- Monthly cashflow
- —
- DSCR
- —
- Eligible?
- —
Short-term bridge; refi at stabilization.
Listing history 19 events
-
2026-06-18days on market $2,490,000 Active 37 DOM
-
2026-06-17days on market $2,490,000 Active 36 DOM
-
2026-06-16days on market $2,490,000 Active 35 DOM
-
2026-06-15days on market $2,490,000 Active 34 DOM
-
2026-06-13days on market $2,490,000 Active 32 DOM
-
2026-06-09days on market $2,490,000 Active 28 DOM
-
2026-06-08days on market $2,490,000 Active 27 DOM
-
2026-06-07days on market $2,490,000 Active 26 DOM
-
2026-06-04days on market $2,490,000 Active 23 DOM
-
2026-06-03days on market $2,490,000 Active 22 DOM
-
2026-06-02days on market $2,490,000 Active 21 DOM
-
2026-06-01days on market $2,490,000 Active 20 DOM
-
2026-05-31days on market $2,490,000 Active 19 DOM
-
2026-05-12$2,490,000 Active
-
2023-11-17historical $1,495
-
2023-10-29$1,495
-
2004-08-20soldstatus $1,200,000
-
2002-12-13soldstatus $1,000,000
-
1996-10-25soldstatus $337,000
ⓘ Source: listings_history table (triggers on properties + properties_extension) + one-shot
backfill from property_details.listing_events for pre-trigger history.
Tax reassessment forecast CA · Resets to sale price
- Current annual tax
- $16,242 · $1,354/mo
- Projected year-2 tax
- $18,924 · $1,577/mo
- Expected delta
- +$2,682/yr (+$223/mo · 16.5%)
ⓘ Screening estimate from a state-policy table — verify with the county assessor before closing.
Climate risk First Street
- Flood 1/10 Low FEMA zone X (unshaded) · 0% chance over 30 yrs
- Wildfire 1/10 Low
- Heat 4/10 Moderate 7 d/yr ≥84°F today · 20 d/yr by 30 yrs out
- Wind 1/10 Low
- Air quality 4/10 Moderate 4 unhealthy d/yr today · 4 by 30 yrs out
Nearby sold comps map
Loading sold comps map…
Walkable amenities ~0.75 mi
Loading nearby amenities…
Taxation est. · year 1
- Rental income
- $344,568
- − Mortgage interest
- −$139,479
- − Property taxes
- −$16,242
- − Insurance
- −$12,450
- − Repairs & maintenance
- −$27,565
- − Management
- −$27,565
- − Depreciation
- −$72,436
- Taxable income
- $48,830
- Est. tax owed @ 24.0%
- −$11,719
- After-tax cash flow
- $75,103/yr
For passive investors: Depreciation is non-cash, so a rental often shows a tax loss while cash-flowing — sheltering income. Rental losses are passive: they offset passive income freely, and up to $25,000/yr can offset ordinary (W-2) income if you actively participate and your MAGI is under $100k (phasing out to $0 by $150k); unused losses carry forward. On sale, claimed depreciation is recaptured at up to 25%, and gains may owe capital-gains tax (a 1031 exchange can defer both). Figures are a year-1 estimate at your 24.0% rate — not tax advice; consult a CPA.
Schools (NCES district)
- District
- San Diego Unified
- NCES district ID
- 0634320
- Math proficiency
- 19% ▼ -29.00%
- Reading proficiency
- 29% ▼ -28.00%
- Median HH income
- $61,673
- Composite
- 22.31/100
- National rank
- #8135
- State rank
- #393 of 517 in CA
Livability — San Diego
- Score
- 75/100
- State rank
- #123
- US rank
- #4206
Category grades
Schools grade is shown separately in the Schools card above.
Census & demographics
- Census place
- San Diego, CA
- County
- San Diego County · 3,178,799 people
- City population
- 1,397,612
- Metro
- San Diego-Chula Vista-Carlsbad, CA
- Population (ZIP)
- 51,805
- Household income
- $91,566
- Rent vs Own
- Severe rent burden
- 5603.0
Population outlook (San Diego County) Hauer SSP2
- Today (2025)
- 3,678,185 people
- By 2030
- 3,856,546 · +4.8%
- By 2040
- 4,171,407 · +13.4%
- By 2050
- 4,421,607 · +20.2%
- By 2075
- 4,831,599 · +31.4%
- By 2100
- 4,832,502 · +31.4%
Race, ethnicity, and origin ACS 2023
- Neighborhood character
- Diverse neighborhood (Simpson 0.64)
- Race & ethnicity
- White 54% Hispanic / Latino 24% Two or more races 12% Asian 10% Black 8%
- Hispanic origin (detail)
- Mexican 16%
- Common ancestry
- Romanian 3% Lithuanian 2% Italian 2%
- Foreign-born
- 19% · Canada, China, Vietnam
- Languages at home
- 74% English-only · Spanish 15% Other Indo-European 3% Other Asian/Pacific 1%
Political lean MEDSL · San Diego
- 2024 margin
- D (+16.8) · D 56.9% · R 40.1% · Other 2.9%
- 2008→2024 swing
- +6.6pp toward D · 2008: 10.2pp · 2024: 16.8pp
- All cycles
- 2024: D+16.8 2020: D+22.8 2016: D+17.8 2012: D+5.1 2008: D+10.2
Not yet ingested
- Civics
- —
Market trends
- HPI YoY
- ▼ -1.82%
- Current HPI
- 224.0762
- Rent YoY
- ▲ 0.35%
- Metro
- San Diego-Chula Vista-Carlsbad, CA
- State GDP YoY
- ▲ 3.21%
- F500 in state
- 116
Industry mix (Fortune 500 HQ in CA)
| Industry | F500 HQs | Revenue |
|---|---|---|
| Technology | 27 | $1,492B |
|
||
| Financial Services | 3 | $174B |
|
||
| Retail | 3 | $44B |
|
||
| Insurance | 3 | $26B |
|
||
| Media / Entertainment | 2 | $115B |
|
||
| Pharmaceuticals / Biotech | 2 | $62B |
|
||
Price history
+638.9% since first listed6 events — show timeline
- 2026-05-12 Listed $2,490,000 SDMLS
- 2023-11-17 Rental Removed $1,495 APPFOLIO
- 2023-10-29 Listed for Rent $1,495 APPFOLIO
- 2004-08-20 Sold (Public Records) $1,200,000 Public Records
- 2002-12-13 Sold (Public Records) $1,000,000 Public Records
- 1996-10-25 Sold (Public Records) $337,000 Public Records
Property tax history
+0.9%/yrLatest (2025): $16,242 · +3.9% YoY. Source: county tax records.
Cash-flow waterfall
monthlySold comps — $/sqft
last 12 mo · ≤1 miLoading sold comps…