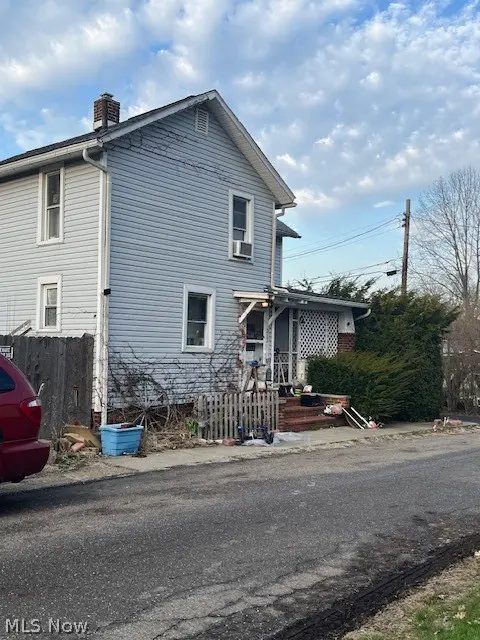
313 Ickes Ct · Louisville, OH
Flood risk 4/10 · Minor
- FEMA flood zone
- X (unshaded)
- Chance of flooding over 30 yrs
- 0.21%
- Est. flood insurance / yr
- $473 – $860
Fire risk 1/10 · Minimal
- Est. fire insurance / yr
- $713 – $1,323
Heat risk 3/10 · Minor
- Hot days now (above 96°F)
- 7 days/yr
- Hot days in 30 yrs
- 17 days/yr
Wind risk 1/10 · Minimal
- Chance of severe wind over 30 yrs
- —
Air-quality risk 2/10 · Minimal
- Unhealthy air days now
- 1 days/yr
- Unhealthy air days in 30 yrs
- 2 days/yr
Risk factors via First Street. Map © Google.
Why this score? — see what drove the D grade
The composite is a weighted blend of 9 inputs, each scored 0–100. Each bar is that input's sub-score; the figure is the points it added to the 100-point composite (weight × sub-score).
- Cash flow +12.1/30.0
- ARV discount +8.6/15.0
- Schools +5.9/10.0
- Livability +4.0/5.0
- Rent growth +3.9/5.0
- DSCR +3.6/10.0
- 1% rule +2.5/10.0
- Condition / age +2.5/5.0
- Appreciation +0.0/10.0
$149,900
🖨 Deal sheet (PDF) 📄 Offer letter ✓ Due diligence
Listing remarks MLS
So many possibilities! Situated in a prime location, this versitile property boasts an enviable position within the Louisville School district, rendering it an ideal sanctuary for families seeking a nurturing environment. Envision being part of a vibrant community where everyday presents an opportunity to thrive. This charming residence, set on 3 parcels (each 60x60), offers an optimal blend of serenity and accessability. Covenience of proximity to schools, bus stop, at the end of the road, nearby ammenities including a newly updated splash park, state-of- the- art library, park facilities, monthly community events, YMCA, Giant Eagle, Dollar Tree and other convenience stores. With some TCL and personal touches, this property offers the best of both worlds. The house is accompanied by a 2 car garage and a 1 car garage, both with electricity and ample storage. Enjoy the safety for your kids and pets with a side door leading to a fenced- in back yard. This property is ideal to become a loving home, rental opportunity or investment venture.
Key facts
- Park facilities
- Fenced-in back yard
- Prime location
Tags
Neighborhood map
What this means for you Summary
Snapshot
- This is a 2-bed/1.0-bath single-family listed at $150k.
Deal economics
- At list price, monthly cash flow is $-33 ($-392/yr) — negative.
- To cash-flow at today's rent, offer at most $144k (3.8% below list).
- To meet the 1% rule (rent ≥ 1% of price), the offer needs to be $112k (25.3% below list).
- Recommended offer: $112k (25.3% below list) — sets the bar for 1% rule.
- Cap rate 6.0% vs local median 3.4% in Louisville — top-decile yield for the area; either an underpriced asset or a hidden risk that comps aren't pricing in. Stress-test before assuming the spread holds.
Location & tenants
- Location reads 79/100 on livability (#142 in OH, #2,205 nationally) — a middle-class / working-renter tenant base. Strengths: crime A+, cost of living A+, housing A+; Watch: amenities F, commute F.
- Louisville City (suburban): math 67% / reading 70% proficiency, ranked #162 of 656 in OH (top 25%) — acceptable for families but not a draw, mixed tenant base, ~2y average lease.
- Zoned schools: Louisville Elementary School (math 76% / reading 72%, grade A, #301 of 1,584 statewide, top 20%, 913 students, 30% FRL); Louisville Middle School (math 65% / reading 64%, grade A-, #205 of 654 statewide, top 34%, 673 students, 32% FRL); Louisville High School (math 49% / reading 82%, grade B, #159 of 781 statewide, top 21%, 787 students, 32% FRL) — zoned schools at 32% FRL track the district average.
- Market conditions: Rents rising fast (+5.6%/yr); 88 active listings in the ZIP; 5 comparable units currently listed for rent nearby; rentals lingering (median 46d on market — plan ~5-8 weeks vacancy on turnover, expect pricing pressure); 100% of comp listings sitting > 30 days — soft ceiling on asking rent; solid renter incomes; 528 units permitted in Stark County in 2024 (84 in 5+ unit buildings).
- This rent is only 17% of the median local income ($80k/yr) — well below the 30% rent-burden line; pricing power to push rent on renewal without tenant pushback.
Forward outlook
- Local home prices are declining (-3.0%/yr); year-one equity from $1k of loan paydown is wiped out by about $4k of value loss. Plan a longer hold.
- Stark County population projected to shrink 8% by 2050 — rents likely to lag national; underwrite the cash flow, not the appreciation.
Negotiation context
- It's been on market 77 days — a 6% lower offer ($141k) is reasonable based on typical stale-listing flexibility.
- 3 sale attempts since 26y ago with the ask held roughly flat each time — persistent listings suggest the price (not the market) is what's stuck; bring a comps-based counter.
- Current owner paid $44k; list at $150k implies a 241% gain — meaningful room to come down on a strong offer.
Risks & watch-outs
- Watch-outs: built in 1929 — expect roof / HVAC / electrical / plumbing capex.
Questions for the listing agent
- What do current leases actually rent for vs. the listed asking? Can we see a recent rent roll and the last 12 months of T-12 income?
- It's been on market 77 days. Have you received any prior offers? Is the seller open to a 25% concession, seller financing, or rate buy-down credit?
- Built in 1929 — when were the roof, HVAC, electrical panel, plumbing, and water heater last replaced?
- Why hasn't it sold? Are there any deal-killer items the seller is aware of (foundation, flood, title, zoning, code violations)?
- Is there a deadline driving the sale (1031 exchange, divorce, estate, relocation)? That informs how much negotiation room exists.
- Schools are A-rated — typically a magnet for longer-tenancy family renters. What's the average tenant stay here, and is there a school-zone premium baked into asking?
- The area grade is low — what's the realistic commute time and amenity access for the typical tenant pool here? Any planned neighborhood developments (good or bad) we should know about?
- What's the average days-on-market for RENTAL listings here right now (not sales)? A rising rental-DOM trend means longer vacancies and softer asking-rent achievability than the comps imply.
- What's the recent tenant-quality profile in this submarket — average credit score on applications, eviction rate, late-payment / NSF rate, and stable-employment percentage? A property-management company in the area should have these aggregated.
- How much new for-sale + rental construction is in the pipeline within 1–3 miles? Heavy new supply typically softens prices + rents 12–24 months out; constrained supply supports both.
Investment metrics
- 1% rule
- 0.75% ✗
- Cap rate
- 6.03%
- Cash-on-cash
- -0.93%
- DSCR
- 0.96
- GRM
- 11.2
CMA / ARV
- ARV (median comp)
- $153,503
- List price
- $149,900
- Delta
- -2.35%
- Verdict
- FAIR
- Comps
- 20 within 1.0 mi
Show comp detail 12 sales within ~0.75 mi
| Address | Dist | Beds/Ba | Sqft | Sold | Price | $/sf | Match |
|---|---|---|---|---|---|---|---|
| 509 E Broad St | 0.08mi | 2/1.0 | 1,092 (+5%) | 5mo | $123,600 | $113 | 84 |
| 904 High St | 0.26mi | 3/2.0 (+1) | 1,053 (+1%) | 8mo | $215,000 | $204 | 70 |
| 202 High St | 0.09mi | 2/1.0 | 1,158 (+11%) | 12mo | $156,000 | $135 | 67 |
| 1104 E Broad St | 0.34mi | 3/1.5 (+1) | 1,007 (-3%) | 8mo | $194,000 | $193 | 65 |
| 325 Lincoln Ave | 0.42mi | 2/1.0 | 968 (-7%) | 6mo | $139,000 | $144 | 64 |
| 630 N Lincoln Ct | 0.47mi | 2/2.0 | 1,068 (+3%) | 9mo | $125,000 | $117 | 62 |
| 928 Parkview Dr | 0.32mi | 3/2.0 (+1) | 1,016 (-2%) | 13mo | $233,000 | $229 | 61 |
| 211 Brunner Ct | 0.42mi | 3/2.0 (+1) | 1,026 (-1%) | 14mo | $173,250 | $169 | 57 |
| 1010 Washington Ave | 0.43mi | 3/1.0 (+1) | 1,152 (+11%) | 3mo | $182,500 | $158 | 55 |
| 1442 Monter Ave | 0.58mi | 3/1.5 (+1) | 1,104 (+6%) | 3mo | $215,000 | $195 | 53 |
| 1027 Romary Ln | 0.39mi | 2/2.0 | 1,196 (+15%) | 14mo | $233,000 | $195 | 41 |
| 1445 Washington Blvd | 0.72mi | 3/2.0 (+1) | 1,170 (+12%) | 8mo | $168,000 | $144 | 30 |
Match score weights: distance 35% · size 25% · config 20% · recency 20%. Top-matched comps best support the ARV.
Projected returns pro-forma
-3.0% appreciation · 5.57% rent growth · sell at horizon
- IRR
- -15.4%
- Equity multiple
- 0.44×
- Total profit
- $-23,456
- Equity at exit
- $22,351
- IRR
- -3.4%
- Equity multiple
- 0.75×
- Total profit
- $-10,488
- Equity at exit
- $12,961
Cash invested: $41,972 (down + closing). Projections, not guarantees.
Landlord ↔ Tenant lean methodology
- Overall (STATE)
- 73 Landlord-Friendly
- State Ohio
- 73 Landlord-Friendly · R+6
- County
- — inherits STATE
- City
- — inherits STATE
ZIP-level market 44641
- Rents YoY
- 5.6%
- Active inventory
- 88
- Price-to-rent
- 11.2×
Monthly cashflow live
- Estimated rent
- $1,119 high interval (Pro) →
- Mortgage (P&I)
- −$786
- Tax from tax record
- −$68 /mo · $820/yr
- Insurance
- −$62
- HOA
- −$0
- Vacancy / Maint / Mgmt
- −$235
- Net cashflow
- $-33
Break-even live
Sensitivity live
| Price | -10% $52 | -5% $10 | +0% $-33 | +5% $-75 | +10% $-117 |
|---|---|---|---|---|---|
| Rent | -10% $-121 | -5% $-77 | +0% $-33 | +5% $12 | +10% $56 |
| Rate | -1.0pp $43 | -0.5pp $5 | base $-33 | +0.5pp $-71 | +1.0pp $-111 |
UW: 25.0% down · 7.5% · 30yr · 1.5% tax · 5.0% vac · 8.0% maint · 8.0% mgmt
Financing live
Cash to close
- Down payment
- $37,475
- Closing costs
- $4,497
- Reserves months
- —
- Total cash needed
- —
Loan-product check · same deal, 3 products live
Conventional
25% down · 7.5% · 30yr
- Down + closing
- —
- Monthly P&I
- —
- Monthly cashflow
- —
- DSCR
- —
- Eligible?
- —
Personal DTI + credit; lowest rate.
DSCR
20% down · 8.5% · 30yr
- Down + closing
- —
- Monthly P&I
- —
- Monthly cashflow
- —
- DSCR
- —
- Eligible?
- —
No personal income docs; deal must DSCR.
Hard money
10% down · 12.0% · 12mo
- Down + closing
- —
- Monthly P&I
- —
- Monthly cashflow
- —
- DSCR
- —
- Eligible?
- —
Short-term bridge; refi at stabilization.
Rent comps 5 comps
| Address | Beds | Baths | Sqft | Rent | $/sqft | DOM | Units | Dist |
|---|---|---|---|---|---|---|---|---|
| 519 Taff Cir Louisville, OH | 2.0 | 1.0 | 768 | $895 | $1.17 | 45d | 1 | 0.62mi |
| 525 S Marion Ave Louisville, OH | 2.0 | 1.5 | 1056 | $1,200 | $1.14 | 45d | 1 | 0.71mi |
| 1332 N Chapel St Unit 4 Louisville, OH | 2.0 | 1.0 | 800 | $875 | $1.09 | 45d | 1 | 0.98mi |
| 1424 N Chapel St Unit 12 Louisville, OH | 2.0 | 1.5 | 1000 | $1,050 | $1.05 | 45d | 1 | 1.10mi |
| 1424 N Chapel St Unit 2 Louisville, OH | 2.0 | 1.5 | 1000 | $1,000 | $1.00 | 45d | 1 | 1.10mi |
Listing history 15 events
-
2026-06-08days on market $149,900 Active 77 DOM
-
2026-06-07days on market $149,900 Active 76 DOM
-
2026-06-05days on market $149,900 Active 73 DOM
-
2026-06-02days on market $149,900 Active 71 DOM
-
2026-06-01days on market $149,900 Active 70 DOM
-
2026-05-31days on market $149,900 Active 69 DOM
-
2026-05-30days on market $149,900 Active 68 DOM
-
2026-03-20$149,900 Active 1053-char remark
Show marketing remark (1053 chars)
So many possibilities! Situated in a prime location, this versitile property boasts an enviable position within the Louisville School district, rendering it an ideal sanctuary for families seeking a nurturing environment. Envision being part of a vibrant community where everyday presents an opportunity to thrive. This charming residence, set on 3 parcels (each 60x60), offers an optimal blend of serenity and accessability. Covenience of proximity to schools, bus stop, at the end of the road, nearby ammenities including a newly updated splash park, state-of- the- art library, park facilities, monthly community events, YMCA, Giant Eagle, Dollar Tree and other convenience stores. With some TCL and personal touches, this property offers the best of both worlds. The house is accompanied by a 2 car garage and a 1 car garage, both with electricity and ample storage. Enjoy the safety for your kids and pets with a side door leading to a fenced- in back yard. This property is ideal to become a loving home, rental opportunity or investment venture.
-
2009-12-04soldstatus $44,000
-
2009-11-30soldstatus $44,000 165-char remark
Show marketing remark (165 chars)
FHA Case No. 412-454623. Real Estate offers sold as is. (Escrow Amount $715). If agent doesn't have hud key see your own broker. See broker remarks for bidding info.
-
2009-05-29$44,000 165-char remark
Show marketing remark (165 chars)
FHA Case No. 412-454623. Real Estate offers sold as is. (Escrow Amount $715). If agent doesn't have hud key see your own broker. See broker remarks for bidding info.
-
2009-04-21soldstatus $58,000
-
2001-01-19soldstatus $74,500
-
2001-01-04historical
-
2000-09-06$76,900
ⓘ Source: listings_history table (triggers on properties + properties_extension) + one-shot
backfill from property_details.listing_events for pre-trigger history.
Tax reassessment forecast OH · Partial reset (capped growth)
- Current annual tax
- $820 · $68/mo
- Projected year-2 tax
- $1,579 · $132/mo
- Expected delta
- +$759/yr (+$63/mo · 92.6%)
ⓘ Screening estimate from a state-policy table — verify with the county assessor before closing.
Climate risk First Street
- Flood 4/10 Moderate FEMA zone X (unshaded) · 21% chance over 30 yrs
- Wildfire 1/10 Low
- Heat 3/10 Moderate 7 d/yr ≥96°F today · 17 d/yr by 30 yrs out
- Wind 1/10 Low
- Air quality 2/10 Low 1 unhealthy d/yr today · 2 by 30 yrs out
Nearby sold comps map
Loading sold comps map…
Walkable amenities ~0.75 mi
Loading nearby amenities…
Taxation est. · year 1
- Rental income
- $13,432
- − Mortgage interest
- −$8,397
- − Property taxes
- −$820
- − Insurance
- −$750
- − Repairs & maintenance
- −$1,075
- − Management
- −$1,075
- − Depreciation
- −$4,361
- Taxable loss
- −$3,044
- Est. tax savings @ 24.0%
- +$731
- After-tax cash flow
- $339/yr
For passive investors: Depreciation is non-cash, so a rental often shows a tax loss while cash-flowing — sheltering income. Rental losses are passive: they offset passive income freely, and up to $25,000/yr can offset ordinary (W-2) income if you actively participate and your MAGI is under $100k (phasing out to $0 by $150k); unused losses carry forward. On sale, claimed depreciation is recaptured at up to 25%, and gains may owe capital-gains tax (a 1031 exchange can defer both). Figures are a year-1 estimate at your 24.0% rate — not tax advice; consult a CPA.
Schools (NCES district)
- District
- Louisville City
- NCES district ID
- 3904987
- Math proficiency
- 67% ▼ -11.00%
- Reading proficiency
- 70% ▼ -4.00%
- Median HH income
- $54,455
- Composite
- 58.54/100
- National rank
- #992
- State rank
- #162 of 656 in OH
Livability — Louisville
- Score
- 79/100
- State rank
- #142
- US rank
- #2205
Category grades
Schools grade is shown separately in the Schools card above.
Census & demographics
- Census place
- Louisville, OH
- County
- Stark County · 272,865 people
- City population
- 20,031
- Metro
- Canton-Massillon, OH
- Population (ZIP)
- 20,031
- Household income
- $80,303
- Rent vs Own
- Severe rent burden
- 344.0
Population outlook (Stark County) Hauer SSP2
- Today (2025)
- 373,708 people
- By 2030
- 371,245 · -0.7%
- By 2040
- 361,331 · -3.3%
- By 2050
- 345,290 · -7.6%
- By 2075
- 302,669 · -19.0%
- By 2100
- 238,870 · -36.1%
Race, ethnicity, and origin ACS 2023
- Neighborhood character
- Predominantly White (95%)
- Race & ethnicity
- White 95% Two or more races 2% Hispanic / Latino 1% Black 1%
- Common ancestry
- Italian 6% Lithuanian 5% Romanian 2%
- Foreign-born
- 1% · Canada
- Languages at home
- 98% English-only · German/W. Germanic 1%
Political lean MEDSL · Stark
- 2024 margin
- Strong R (+21.9) · D 38.6% · R 60.5%
- 2008→2024 swing
- -27.4pp toward R · 2008: 5.5pp · 2024: -21.9pp
- All cycles
- 2024: R+21.9 2020: R+18.5 2016: R+17.4 2012: R+0.4 2008: D+5.5
Not yet ingested
- Civics
- —
Market trends
- HPI YoY
- ▼ -203.38%
- Current HPI
- 214.6849
- Rent YoY
- ▲ 5.57%
- Metro
- Canton-Massillon, OH
- State GDP YoY
- ▲ 1.98%
- F500 in state
- 48
Industry mix (Fortune 500 HQ in OH)
| Industry | F500 HQs | Revenue |
|---|---|---|
| Insurance | 3 | $145B |
|
||
| Industrial Machinery | 3 | $49B |
|
||
| Financial Services | 3 | $24B |
|
||
| Consumer Goods | 2 | $93B |
|
||
| Aerospace / Defense | 2 | $47B |
|
||
| Utilities | 2 | $33B |
|
||
Price history
+94.9% since first listed8 events — show timeline
- 2026-03-20 Listed $149,900 MLSNOW
- 2009-12-04 Sold (Public Records) $44,000 Public Records
- 2009-11-30 Sold (MLS) $44,000 MLSNOW
- 2009-05-29 Listed $44,000 MLSNOW
- 2009-04-21 Sold (Public Records) $58,000 Public Records
- 2001-01-19 Sold (Public Records) $74,500 Public Records
- 2001-01-04 Listing Removed — MLSNOW
- 2000-09-06 Listed $76,900 MLSNOW
Property tax history
+2.1%/yrLatest (2024): $820 · +15.3% YoY. Source: county tax records.
Cash-flow waterfall
monthlySold comps — $/sqft
last 12 mo · ≤1 miLoading sold comps…