 Fourplex
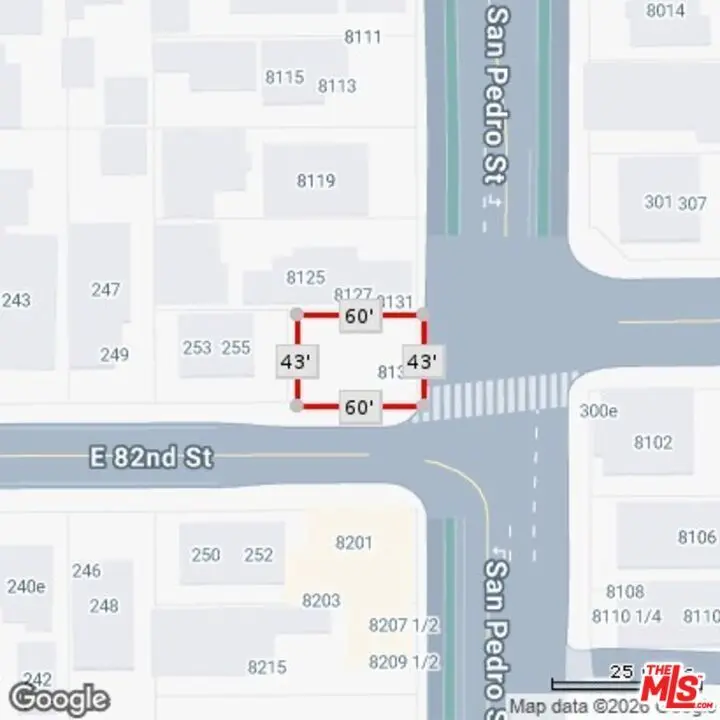
8129 S San Pedro St · Los Angeles, CA
Flood risk No data
- FEMA flood zone
- —
- Chance of flooding over 30 yrs
- —
- Est. flood insurance / yr
- —
Fire risk No data
- Est. fire insurance / yr
- —
Heat risk No data
- Hot days now (above threshold)
- —
- Hot days in 30 yrs
- —
Wind risk No data
- Chance of severe wind over 30 yrs
- —
Air-quality risk No data
- Unhealthy air days now
- —
- Unhealthy air days in 30 yrs
- —
Risk factors via First Street. Map © Google.
Why this score? — see what drove the B- grade
The composite is a weighted blend of 9 inputs, each scored 0–100. Each bar is that input's sub-score; the figure is the points it added to the 100-point composite (weight × sub-score).
- Cash flow +30.0/30.0
- 1% rule +10.0/10.0
- DSCR +10.0/10.0
- ARV discount +7.5/15.0
- Schools +3.6/10.0
- Livability +3.4/5.0
- Rent growth +2.5/5.0
- Condition / age +2.5/5.0
- Appreciation +0.0/10.0
$395,000
🖨 Deal sheet (PDF) 📄 Offer letter ✓ Due diligence
Multi-family units
County records classify this as Multi-Family (2-4 Unit). Listing-text estimate: 4 units. confirmed
Listing remarks
Rare RTI development opportunity in South Los Angeles, shovel-ready & priced to move. This cleared corner lot at San Pedro St and E 82nd Place offers City-approved plans for a 2-story, 4-unit residential project (2 primary units + 2 ADUs), with onsite parking included. At approximately 2,558 SF and zoned R3, the site is ideally suited for a small developer or investor-operator looking to build & hold for income. Projected Section 8 rental income of $2,041/unit/month (current HACLA 0BR for 90003) translates to approximately $97,968 in gross annual income. New construction ADUs are RSO-exempt for 30 years. Permits are in hand so no entitlement risk & no waiting to build here
Key facts
- Onsite parking
- Cleared corner lot
- City approved plans
Tags
Property features AI
Finance
- Other: Zoning: LAR3; Lot dimensions approximately 43 x 60
- Financial info: Gross income reported as 0; Income scheduled as 'Scheduled'; One building on the parcel; Unit type count: 1 (unit types listed as N/A)
- HOA & community: No HOA information provided
Exterior
- Parking: On-street parking
- Security: No security features listed
- Utilities: No utility details provided
- Home design: Residential income property; One story
- Construction: No construction material, roof, foundation, or year built provided; No other structures (none)
- Exterior features: Fenced lot; Rectangular, level/flat lot; Sidewalks; Single lot; Value in land
Interior
- Kitchen: No kitchen appliances or details provided
- Bedrooms: Unit configured as non-residential / no bedrooms listed
- Flooring: No flooring details provided
- Bathrooms: No bathrooms listed
- Heating & cooling: No heating; No cooling
- Interior features: One-level layout
- Laundry & utility: No laundry or utility details provided
Neighborhood map
What this means for you Summary
Snapshot
- This is a 4 × 2-bed/1-bath units multifamily listed at $395k.
Deal economics
- At list price, monthly cash flow is $5k ($63k/yr) — positive. Per door: $1k/mo.
- The deal already cash-flows at list — no discount required.
- Meets the 1% rule at list price ($10k rent vs $395k).
- Recommended offer: $383k (3.0% below list) — sets the bar for market timing.
- Cap rate 22.2% vs local median 2.1% in Los Angeles — top-decile yield for the area; either an underpriced asset or a hidden risk that comps aren't pricing in. Stress-test before assuming the spread holds.
Location & tenants
- Location reads 68/100 on livability (#273 in CA) — a middle-class / working-renter tenant base. Strengths: amenities A+, commute A+, employment B; Watch: health & safety C-, schools D+, crime F.
- Los Angeles Unified (urban): math 29% / reading 54% proficiency, ranked #223 of 517 in CA (top 43%) — families likely to look elsewhere, expect single-tenant / working-renter base with shorter leases; 67% free/reduced lunch — lower-income household profile, screen leases tightly.
- Market conditions: Rents flat; 161 active listings in the ZIP; 40 comparable units currently listed for rent nearby; rentals at typical pace (median 26d on market — plan ~3-4 weeks tenant-placement turnaround); 19,697 units permitted in Los Angeles County in 2024 (9,426 in 5+ unit buildings).
- At $10,093/mo this rent would consume 216% of the median local household income ($56k/yr) (locally 4550% of renters already pay >50% of income on rent) — very limited rent-growth headroom before tenants either downsize or default.
Forward outlook
- Local home prices are declining (-3.0%/yr); year-one equity from $3k of loan paydown is wiped out by about $12k of value loss. Plan a longer hold.
- Los Angeles County population projected at +9% by 2050 — modest demand growth; plan on rents tracking national, not racing it.
- At projected returns (-3.0% appreciation + 0.1% rent growth), your $111k cash investment doubles in ~3 years — after that, you're playing with house money.
Negotiation context
- It's been on market 35 days — a 3% lower offer ($383k) is reasonable based on typical stale-listing flexibility.
- 8 sale attempts since 7y ago; this cycle's ask has dropped $94k (19%) from the opening price — seller is motivated, your offer sets the floor, not the list.
Risks & watch-outs
- Watch-outs: built in 1924 — expect roof / HVAC / electrical / plumbing capex.
Questions for the listing agent
- It's been on market 35 days. Have you received any prior offers? Is the seller open to a 3% concession, seller financing, or rate buy-down credit?
- Can we see the unit-by-unit rent roll, current vacancy, and any below-market leases? What's the average tenancy length?
- What capital expenditures (roof, boiler, parking lot, exteriors) have been made in the last 5 years, and what's planned in the next 2?
- Built in 1924 — when were the roof, HVAC, electrical panel, plumbing, and water heater last replaced?
- Is there a deadline driving the sale (1031 exchange, divorce, estate, relocation)? That informs how much negotiation room exists.
- Schools are D-rated, which usually means shorter tenancies and higher turnover. Who's the typical renter profile here, and what's been the actual vacancy rate?
- Crime grade is F in this area — have there been break-ins, vandalism, or insurance claims at this property in the last 3 years? What carrier currently insures it and at what premium?
- What's the average days-on-market for RENTAL listings here right now (not sales)? A rising rental-DOM trend means longer vacancies and softer asking-rent achievability than the comps imply.
- What's the recent tenant-quality profile in this submarket — average credit score on applications, eviction rate, late-payment / NSF rate, and stable-employment percentage? A property-management company in the area should have these aggregated.
- How much new apartment / multifamily construction is in the pipeline within 1–3 miles? Heavy new supply (>2% of stock underway) typically softens rents 12–24 months out; light construction supports rent growth.
Investment metrics
- 1% rule
- 2.56% ✓
- Cap rate
- 22.22%
- Cash-on-cash
- 56.89%
- DSCR
- 3.53
- GRM
- 3.3
CMA / ARV
No comps found within radius.
Show comp detail 12 sales within ~0.75 mi
| Address | Dist | Beds/Ba | Sqft | Sold | Price | $/sf | Match |
|---|---|---|---|---|---|---|---|
| 8110 S San Pedro St | 0.04mi | 10/7.0 | 3,752 | 2mo | $1,295,000 | $345 | 84 |
| 8115 S San Pedro | 0.03mi | 5/2.0 | 1,567 | 2mo | $730,000 | $466 | 84 |
| 158 E 85th | 0.35mi | 6/3.0 | 1,453 | 0mo | $825,000 | $568 | 71 |
| 217 E 77th St | 0.31mi | 5/2.0 | 2,120 | 3mo | $905,000 | $427 | 71 |
| 525 W 85th St | 0.40mi | 13/7.0 | 4,209 | 1mo | $1,550,000 | $368 | 68 |
| 604 E 85th | 0.42mi | —/— | 3,128 | 2mo | $825,000 | $264 | 66 |
| 213 E 87th Pl | 0.50mi | 8/4.0 | 2,723 | 1mo | $739,000 | $271 | 63 |
| 210 85th Pl | 0.51mi | 3/2.0 | 1,006 | 2mo | $500,000 | $497 | 62 |
| 640 E 74th | 0.61mi | 5/3.0 | 2,078 | 0mo | $735,000 | $354 | 59 |
| 431 W 78th | 0.72mi | 7/4.0 | 2,415 | 0mo | $900,000 | $373 | 54 |
| 233 W 88th St | 0.71mi | 4/3.0 | 1,907 | 2mo | $520,000 | $273 | 53 |
| 150 E 70th St | 0.73mi | 4/3.0 | 1,431 | 2mo | $465,000 | $325 | 52 |
Match score weights: distance 35% · size 25% · config 20% · recency 20%. Top-matched comps best support the ARV.
Projected returns pro-forma
-3.0% appreciation · 0.11% rent growth · sell at horizon
- IRR
- 52.0%
- Equity multiple
- 3.18×
- Total profit
- $241,595
- Equity at exit
- $58,896
- IRR
- 56.2%
- Equity multiple
- 5.80×
- Total profit
- $530,565
- Equity at exit
- $34,152
Cash invested: $110,600 (down + closing). Projections, not guarantees.
Landlord ↔ Tenant lean methodology
- Overall (CITY)
- 0 Strongly Tenant-Friendly
- State California
- 18 Strongly Tenant-Friendly · D+13
- County
- — inherits STATE
- City Los Angeles
- 0 Strongly Tenant-Friendly · D+22
ZIP-level market 90003
- Rents YoY
- 0.1%
- Active inventory
- 161
- Price-to-rent
- 13.0×
Monthly cashflow live
- Estimated rent
- $10,093 high interval (Pro) →
- Mortgage (P&I)
- −$2,071
- Tax est. 1.5%
- −$494 /mo · $5,925/yr
- Insurance
- −$165
- HOA
- −$0
- Vacancy / Maint / Mgmt
- −$2,120
- Net cashflow
- $5,244
Break-even live
Sensitivity live
| Price | -10% $5,517 | -5% $5,380 | +0% $5,244 | +5% $5,107 | +10% $4,971 |
|---|---|---|---|---|---|
| Rent | -10% $4,446 | -5% $4,845 | +0% $5,244 | +5% $5,642 | +10% $6,041 |
| Rate | -1.0pp $5,443 | -0.5pp $5,344 | base $5,244 | +0.5pp $5,141 | +1.0pp $5,037 |
4-unit breakdown (identical units grouped — click to expand)
| Units | Beds | Baths | Est. rent |
|---|---|---|---|
| 4× units | 2 | 1 | $10,092 |
| #1 | 2 | 1 | $2,523 |
| #2 | 2 | 1 | $2,523 |
| #3 | 2 | 1 | $2,523 |
| #4 | 2 | 1 | $2,523 |
| Total (4 units) | $10,093 | ||
UW: 25.0% down · 7.5% · 30yr · 1.5% tax · 5.0% vac · 8.0% maint · 8.0% mgmt
Financing live
Cash to close
- Down payment
- $98,750
- Closing costs
- $11,850
- Reserves months
- —
- Total cash needed
- —
Loan-product check · same deal, 3 products live
Conventional
25% down · 7.5% · 30yr
- Down + closing
- —
- Monthly P&I
- —
- Monthly cashflow
- —
- DSCR
- —
- Eligible?
- —
Personal DTI + credit; lowest rate.
DSCR
20% down · 8.5% · 30yr
- Down + closing
- —
- Monthly P&I
- —
- Monthly cashflow
- —
- DSCR
- —
- Eligible?
- —
No personal income docs; deal must DSCR.
Hard money
10% down · 12.0% · 12mo
- Down + closing
- —
- Monthly P&I
- —
- Monthly cashflow
- —
- DSCR
- —
- Eligible?
- —
Short-term bridge; refi at stabilization.
Rent comps 40 comps
| Address | Beds | Baths | Sqft | Rent | $/sqft | DOM | Units | Dist |
|---|---|---|---|---|---|---|---|---|
| 237 E 81st St Los Angeles, CA | 3.0 | 2.0 | — | $3,500 | — | 44d | 1 | 0.04mi |
| 211 E 81st St Unit D Los Angeles, CA | 2.0 | 1.0 | — | $2,295 | — | 25d | 1 | 0.08mi |
| 239 E 80th St Los Angeles, CA | 2.0 | 1.0 | — | $2,040 | — | 25d | 1 | 0.09mi |
| 252 E 79th St Los Angeles, CA | 2.0 | 1.0 | 650 | $2,887 | $4.44 | 25d | 1 | 0.12mi |
| 7811 San Pedro St Unit 4 Los Angeles, CA | 3.0 | 1.0 | 800 | $3,100 | $3.88 | 44d | 1 | 0.17mi |
| 7843 Towne Ave Unit 19 Los Angeles, CA | 2.0 | 1.0 | — | $2,325 | — | 25d | 1 | 0.17mi |
| 159 E 83rd St Unit 159 Los Angeles, CA | 3.0 | 1.0 | — | $3,200 | — | 19d | 1 | 0.17mi |
| 7833 Towne Ave Los Angeles, CA | 2.0 | 1.0 | 700 | $2,325 | $3.32 | 25d | 1 | 0.18mi |
| 202 E 78th St Los Angeles, CA | 1.0 | 1.0 | 550 | $2,250 | $4.09 | 25d | 1 | 0.19mi |
| 8316 S San Pedro St Los Angeles, CA | 3.0 | 1.0 | — | $2,495 | — | 3d | 1 | 0.20mi |
| 227 1/2 E 78th St Unit 227 1/2 Los Angeles, CA | 2.0 | 1.0 | — | $2,289 | — | 25d | 1 | 0.21mi |
| 227 E 84th St Los Angeles, CA | 1.0 | 1.0 | 378 | $1,800 | $4.76 | 25d | 1 | 0.21mi |
| 7924 S Main St Los Angeles, CA | 2.0 | 1.0 | 580 | $2,265 | $3.91 | 18d | 1 | 0.23mi |
| 7924 S Main St Los Angeles, CA | 2.0 | 1.0 | — | $2,165 | — | 21d | 1 | 0.23mi |
| 240 E 84th St Los Angeles, CA | 2.0 | 1.0 | 2039 | $1,950 | $0.96 | 25d | 1 | 0.23mi |
| 263 E 84th Pl Los Angeles, CA | 3.0 | 1.0 | 1450 | $2,950 | $2.03 | 15d | 1 | 0.27mi |
| 7655 San Pedro St Unit 1 Los Angeles, CA | 1.0 | 1.0 | — | $2,289 | — | 25d | 1 | 0.29mi |
| 7655 San Pedro St Unit 2 Los Angeles, CA | 2.0 | 1.0 | — | $2,887 | — | 25d | 1 | 0.29mi |
| 607 E 81st St Apt 4 Los Angeles, CA | 2.0 | 1.0 | — | $2,000 | — | 25d | 1 | 0.30mi |
| 138 W 82nd St Los Angeles, CA | 2.0 | 1.0 | — | $2,100 | — | 25d | 1 | 0.31mi |
| 7688 Main St Los Angeles, CA | 3.0 | 2.0 | 1100 | $3,200 | $2.91 | 25d | 1 | 0.33mi |
| 229 E 85th St Unit 231 12 Los Angeles, CA | 3.0 | 1.0 | 950 | $2,750 | $2.89 | 44d | 1 | 0.33mi |
| 8418 Main St Unit 8418 Los Angeles, CA | 3.0 | 3.0 | 977 | $2,695 | $2.76 | 44d | 1 | 0.33mi |
| 107 W 84th Pl Los Angeles, CA | 2.0 | 1.0 | 800 | $2,395 | $2.99 | 44d | 1 | 0.34mi |
| 118 E 84th Pl Los Angeles, CA | 3.0 | 1.0 | — | $2,000 | — | 3d | 1 | 0.35mi |
| 7718 Avalon Blvd Unit 7718-5 Los Angeles, CA | 2.0 | 1.0 | 613 | $2,095 | $3.42 | 25d | 1 | 0.35mi |
| 632 E 82nd St Los Angeles, CA | 1.0 | 1.0 | — | $1,554 | — | 2d | 1 | 0.37mi |
| 219 E 76th St Los Angeles, CA | 2.0 | 1.0 | 805 | $2,395 | $2.98 | 44d | 1 | 0.39mi |
| 231 W 81st St Unit 231 Los Angeles, CA | 3.0 | 2.0 | — | $2,999 | — | 19d | 1 | 0.41mi |
| 8460 Avalon Blvd Unit 06 Los Angeles, CA | 2.0 | 1.0 | — | $2,300 | — | 22d | 1 | 0.43mi |
| 212 W 84th St Los Angeles, CA | 2.0 | 1.0 | 990 | $3,100 | $3.13 | 44d | 1 | 0.43mi |
| 8464 S Avalon Blvd Apt 2 Los Angeles, CA | 2.0 | 1.0 | — | $2,350 | — | 0d | 1 | 0.43mi |
| 8464 Avalon Blvd Unit 6 Los Angeles, CA | 2.0 | 1.0 | 680 | $2,350 | $3.46 | 44d | 1 | 0.43mi |
| 8464 Avalon Blvd Unit 03 Los Angeles, CA | 2.0 | 1.0 | — | $2,300 | — | 45d | 1 | 0.43mi |
| 239 W 80th St Unit 241 Los Angeles, CA | 1.0 | 1.0 | — | $2,289 | — | 44d | 1 | 0.44mi |
| 719 E 79th St Unit 1 Los Angeles, CA | 3.0 | 1.0 | — | $3,299 | — | 44d | 1 | 0.46mi |
| 734 E 80th St Unit 736 Los Angeles, CA | 2.0 | 1.0 | — | $2,450 | — | 44d | 1 | 0.47mi |
| 735 E 82nd St Los Angeles, CA | 3.0 | 2.0 | 913 | $3,400 | $3.72 | 44d | 1 | 0.48mi |
| 7418 S Main St #6 Los Angeles, CA | 2.0 | 1.0 | 450 | $1,999 | $4.44 | 8d | 1 | 0.49mi |
| 8027 S Broadway Los Angeles, CA | 2.0 | 1.0 | — | $1,800 | — | 17d | 1 | 0.50mi |
Listing history 38 events
-
2026-06-18days on market $395,000 Active 35 DOM
-
2026-06-17days on market $395,000 Active 34 DOM
-
2026-06-16days on market $395,000 Active 33 DOM
-
2026-06-15days on market $395,000 Active 32 DOM
-
2026-06-13pricedays on market $395,000 Active 30 DOM
-
2026-06-09days on market $464,000 Active 26 DOM
-
2026-06-08days on market $464,000 Active 25 DOM
-
2026-06-07pricedays on market $464,000 Active 24 DOM
-
2026-06-04days on market $489,000 Active 21 DOM
-
2026-06-03days on market $489,000 Active 20 DOM
-
2026-06-02days on market $489,000 Active 19 DOM
-
2026-06-01days on market $489,000 Active 18 DOM
-
2026-05-31days on market $489,000 Active 17 DOM
-
2026-05-14$489,000 Active
-
2025-02-27historical
-
2025-01-06price $475,000
-
2024-11-28$525,000 Active
-
2022-10-15historical
-
2022-10-10status Active
-
2022-10-10price $549,999
-
2022-05-22status Pending Sale
-
2022-04-26status Pending Sale
-
2022-04-25historical
-
2022-04-15$399,999 Active
-
2021-07-29Active
-
2020-10-30historical
-
2020-10-22price $465,000
-
2020-09-03$474,999 Active
-
2020-06-30historical
-
2020-05-12price $495,000
-
2020-04-09price $499,000
-
2020-03-15$550,000 Active
-
2019-12-27soldstatus $350,000 Sold
-
2019-12-09status Pending
-
2019-09-24price $379,000
-
2019-08-22price $397,000
-
2019-07-31price $429,000
-
2019-07-01$475,000 Active
ⓘ Source: listings_history table (triggers on properties + properties_extension) + one-shot
backfill from property_details.listing_events for pre-trigger history.
Nearby sold comps map
Loading sold comps map…
Walkable amenities ~0.75 mi
Loading nearby amenities…
Taxation est. · year 1
- Rental income
- $121,116
- − Mortgage interest
- −$22,126
- − Property taxes
- −$5,925
- − Insurance
- −$1,975
- − Repairs & maintenance
- −$9,689
- − Management
- −$9,689
- − Depreciation
- −$11,491
- Taxable income
- $60,220
- Est. tax owed @ 24.0%
- −$14,453
- After-tax cash flow
- $48,472/yr
For passive investors: Depreciation is non-cash, so a rental often shows a tax loss while cash-flowing — sheltering income. Rental losses are passive: they offset passive income freely, and up to $25,000/yr can offset ordinary (W-2) income if you actively participate and your MAGI is under $100k (phasing out to $0 by $150k); unused losses carry forward. On sale, claimed depreciation is recaptured at up to 25%, and gains may owe capital-gains tax (a 1031 exchange can defer both). Figures are a year-1 estimate at your 24.0% rate — not tax advice; consult a CPA.
Schools (NCES district)
- District
- Los Angeles Unified
- NCES district ID
- 0622710
- Math proficiency
- 29% ▼ -4.00%
- Reading proficiency
- 54% ▲ 10.00%
- Median HH income
- $50,403
- Composite
- 35.67/100
- National rank
- #4875
- State rank
- #223 of 517 in CA
Livability — Los Angeles
- Score
- 68/100
- State rank
- #273
- US rank
- #9237
Category grades
Schools grade is shown separately in the Schools card above.
Census & demographics
- Census place
- Los Angeles, CA
- County
- Los Angeles County · 9,444,647 people
- City population
- 3,838,149
- Metro
- Los Angeles-Long Beach-Anaheim, CA
- Population (ZIP)
- 70,065
- Household income
- $56,030
- Rent vs Own
- Severe rent burden
- 4550.0
Population outlook (Los Angeles County) Hauer SSP2
- Today (2025)
- 10,940,515 people
- By 2030
- 11,256,481 · +2.9%
- By 2040
- 11,729,929 · +7.2%
- By 2050
- 11,948,407 · +9.2%
- By 2075
- 11,818,114 · +8.0%
- By 2100
- 10,842,928 · -0.9%
Race, ethnicity, and origin ACS 2023
- Neighborhood character
- Predominantly Hispanic (81%)
- Race & ethnicity
- Hispanic / Latino 81% Two or more races 20% Black 16% Native American 1%
- Hispanic origin (detail)
- Mexican 51%
- Common ancestry
- British 1%
- Foreign-born
- 40% · Canada
- Languages at home
- 24% English-only · Spanish 75%
Political lean MEDSL · Los Angeles
- 2024 margin
- Solid D (+32.9) · D 64.8% · R 31.9% · Other 3.3%
- 2008→2024 swing
- -7.4pp toward R · 2008: 40.4pp · 2024: 32.9pp
- All cycles
- 2024: D+32.9 2020: D+44.2 2016: D+48.0 2012: D+40.0 2008: D+40.4
Not yet ingested
- Civics
- —
Market trends
- HPI YoY
- ▼ -785.95%
- Current HPI
- 512.5667
- Rent YoY
- ▲ 0.11%
- Metro
- Los Angeles-Long Beach-Anaheim, CA
- State GDP YoY
- ▲ 3.21%
- F500 in state
- 116
Industry mix (Fortune 500 HQ in CA)
| Industry | F500 HQs | Revenue |
|---|---|---|
| Technology | 27 | $1,492B |
|
||
| Financial Services | 3 | $174B |
|
||
| Retail | 3 | $44B |
|
||
| Insurance | 3 | $26B |
|
||
| Media / Entertainment | 2 | $115B |
|
||
| Pharmaceuticals / Biotech | 2 | $62B |
|
||
Price history
+2.9% since first listed25 events — show timeline
- 2026-05-14 Listed $489,000 TheMLS
- 2025-02-27 Listing Removed — CRMLS
- 2025-01-06 Price Changed $475,000 CRMLS
- 2024-11-28 Listed $525,000 CRMLS
- 2022-10-15 Listing Removed — CRMLS
- 2022-10-10 Relisted — CRMLS
- 2022-10-10 Price Changed $549,999 CRMLS
- 2022-05-22 Pending — CRMLS
- 2022-04-26 Pending — CRMLS
- 2022-04-25 Listing Removed — CRMLS
- 2022-04-15 Listed $399,999 CRMLS
- 2021-07-29 Listed — TheMLS
- 2020-10-30 Listing Removed — CRMLS
- 2020-10-22 Price Changed $465,000 CRMLS
- 2020-09-03 Listed $474,999 CRMLS
- 2020-06-30 Listing Removed — CRMLS
- 2020-05-12 Price Changed $495,000 CRMLS
- 2020-04-09 Price Changed $499,000 CRMLS
- 2020-03-15 Listed $550,000 CRMLS
- 2019-12-27 Sold (MLS) $350,000 TheMLS
- 2019-12-09 Pending — TheMLS
- 2019-09-24 Price Changed $379,000 TheMLS
- 2019-08-22 Price Changed $397,000 TheMLS
- 2019-07-31 Price Changed $429,000 TheMLS
- 2019-07-01 Listed $475,000 TheMLS
Cash-flow waterfall
monthlySold comps — $/sqft
last 12 mo · ≤1 miLoading sold comps…