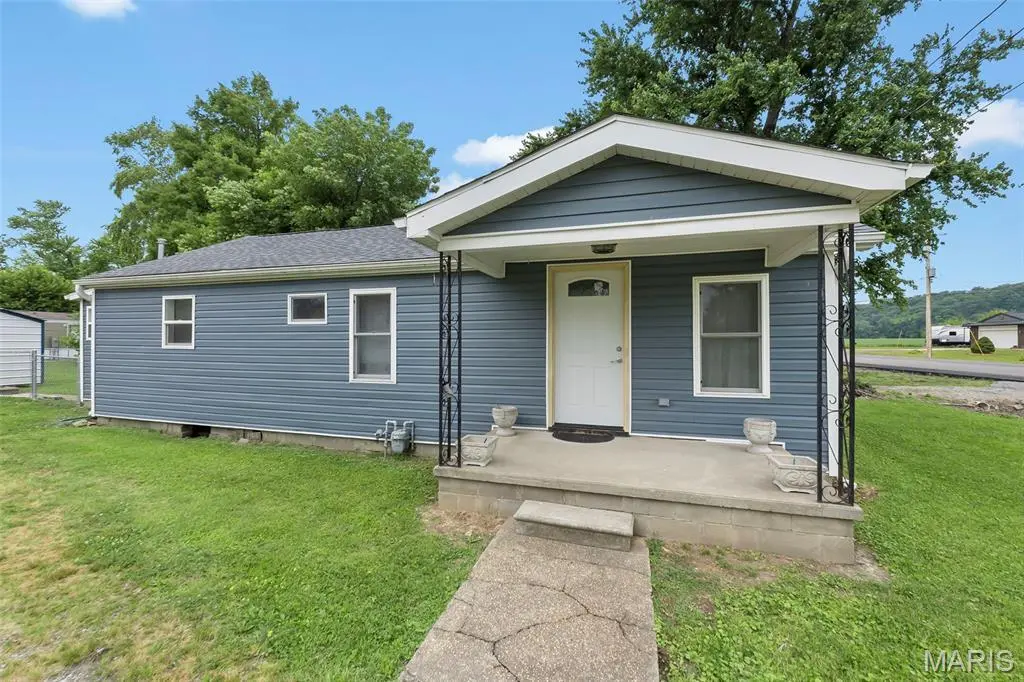
301 W State St · Delta, MO
Flood risk 1/10 · Minimal
- FEMA flood zone
- X (unshaded)
- Chance of flooding over 30 yrs
- 0.0%
- Est. flood insurance / yr
- $507 – $1,088
Fire risk 3/10 · Minor
- Est. fire insurance / yr
- $1,054 – $1,958
Heat risk 5/10 · Moderate
- Hot days now (above 108°F)
- 7 days/yr
- Hot days in 30 yrs
- 21 days/yr
Wind risk 2/10 · Minimal
- Chance of severe wind over 30 yrs
- 4.0%
Air-quality risk 3/10 · Minor
- Unhealthy air days now
- 3 days/yr
- Unhealthy air days in 30 yrs
- 5 days/yr
Risk factors via First Street. Map © Google.
Why this score? — see what drove the C grade
The composite is a weighted blend of 9 inputs, each scored 0–100. Each bar is that input's sub-score; the figure is the points it added to the 100-point composite (weight × sub-score).
- Cash flow +26.4/30.0
- DSCR +9.0/10.0
- ARV discount +7.5/15.0
- 1% rule +5.9/10.0
- Livability +3.0/5.0
- Schools +2.8/10.0
- Rent growth +2.5/5.0
- Condition / age +2.5/5.0
- Appreciation +0.0/10.0
$95,000
🖨 Deal sheet 📄 Offer letter ✓ Due diligence
Listing remarks
Fresh, updated, and ready for you! This completely remodeled home in Delta offers easy living with stylish updates throughout. Enjoy a fenced-in yard with plenty of room for pets, play, or backyard hangouts, plus a small shed for extra storage. With the major updates already done, all that’s left to do is move in and make it yours!
Key facts
- 5,662 sq ft lot
- Built 1950
- Listed 29 days
Property features AI
Exterior
- Utilities: Public water; Public sewer; 220-volt electrical service; Electricity connected
- Home design: Single-family residence; Residential property; One story
- Construction: Vinyl siding
- Exterior features: City lot
Interior
- Bedrooms: 2 bedrooms on the main level
- Bathrooms: 2 full bathrooms on the main level
- Heating & cooling: Electric heating; Central air conditioning
- Interior features: One-level living
Neighborhood map
What this means for you Summary
Snapshot
- This is a 2-bed/1.0-bath single-family listed at $95k.
Deal economics
- At list price, monthly cash flow is $248 ($3k/yr) — positive.
- The deal already cash-flows at list — no discount required.
- Meets the 1% rule at list price ($1k rent vs $95k).
- Recommended offer: $94k (1.5% below list) — sets the bar for market timing.
Location & tenants
- Location reads 60/100 on livability (#507 in MO) — a middle-class / working-renter tenant base. Strengths: cost of living A+, housing A+; Watch: crime F, amenities F, commute F.
- Delta R-V (rural): math 25% / reading 35% proficiency, ranked #457 of 535 in MO (top 85%) — families likely to look elsewhere, expect single-tenant / working-renter base with shorter leases.
- Zoned schools: Delta Elem. (math 24% / reading 34%, grade F, #813 of 1,115 statewide, top 75%, 105 students, 54% FRL); Delta High (math 27% / reading 37%, grade F, #356 of 521 statewide, top 71%, 119 students, 60% FRL).
- Market conditions: 13 active listings in the ZIP; 81 units permitted in Cape Girardeau County in 2024 (0 in 5+ unit buildings).
Forward outlook
- Local home prices are declining (-3.0%/yr); year-one equity from $657 of loan paydown is wiped out by about $3k of value loss. Plan a longer hold.
- Cape Girardeau County population projected at +17% by 2050 — long-run rental-demand tailwind backs the buy-and-hold thesis.
- At projected returns (-3.0% appreciation + 3.0% rent growth), your $27k cash investment doubles in ~10 years — after that, you're playing with house money.
Negotiation context
- It's been on market 30 days — a 2% lower offer ($94k) is reasonable based on typical stale-listing flexibility.
- 3 sale attempts since 5y ago with the ask held roughly flat each time — persistent listings suggest the price (not the market) is what's stuck; bring a comps-based counter.
Risks & watch-outs
- Watch-outs: built in 1950 — expect roof / HVAC / electrical / plumbing capex.
- Climate carrying-cost: extreme-heat days projected 7→21/yr by 2055 (HVAC capex compounding) — expect insurance premiums to compound above CPI over the hold.
Questions for the listing agent
- Built in 1950 — when were the roof, HVAC, electrical panel, plumbing, and water heater last replaced?
- Is there a deadline driving the sale (1031 exchange, divorce, estate, relocation)? That informs how much negotiation room exists.
- Schools are F-rated, which usually means shorter tenancies and higher turnover. Who's the typical renter profile here, and what's been the actual vacancy rate?
- Crime grade is F in this area — have there been break-ins, vandalism, or insurance claims at this property in the last 3 years? What carrier currently insures it and at what premium?
- What's the average days-on-market for RENTAL listings here right now (not sales)? A rising rental-DOM trend means longer vacancies and softer asking-rent achievability than the comps imply.
- What's the recent tenant-quality profile in this submarket — average credit score on applications, eviction rate, late-payment / NSF rate, and stable-employment percentage? A property-management company in the area should have these aggregated.
- How much new for-sale + rental construction is in the pipeline within 1–3 miles? Heavy new supply typically softens prices + rents 12–24 months out; constrained supply supports both.
Investment metrics
- 1% rule
- 1.09% ✓
- Cap rate
- 9.42%
- Cash-on-cash
- 11.17%
- DSCR
- 1.50
- GRM
- 7.6
CMA / ARV
- ARV (on-the-fly)
- $46,612
- Comps found
- 1
Show comp detail 1 sale within ~0.75 mi
| Address | Dist | Beds/Ba | Sqft | Sold | Price | $/sf | Match |
|---|---|---|---|---|---|---|---|
| 209 W State St | 0.03mi | 2/1.0 | 1,216 (+12%) | 15mo | $51,800 | $43 | 66 |
Match score weights: distance 35% · size 25% · config 20% · recency 20%. Top-matched comps best support the ARV.
Projected returns pro-forma
-3.0% appreciation · 3.0% rent growth · sell at horizon
- IRR
- 0.3%
- Equity multiple
- 1.01×
- Total profit
- $341
- Equity at exit
- $14,165
- IRR
- 10.0%
- Equity multiple
- 1.77×
- Total profit
- $20,457
- Equity at exit
- $8,214
Cash invested: $26,600 (down + closing). Projections, not guarantees.
Landlord ↔ Tenant lean methodology
- Overall (STATE)
- 81 Strongly Landlord-Friendly
- State Missouri
- 81 Strongly Landlord-Friendly · R+10
- County
- — inherits STATE
- City
- — inherits STATE
ZIP-level market 63740
- Home prices YoY
- -19.1%
- Active inventory
- 13
- Price-to-rent
- 7.6×
Monthly cashflow live
- Estimated rent
- $1,037 medium interval (Pro) →
- Mortgage (P&I)
- −$498
- Tax from tax record
- −$34 /mo · $408/yr
- Insurance
- −$40
- HOA
- −$0
- Vacancy / Maint / Mgmt
- −$218
- Net cashflow
- $248
Break-even live
UW: 25.0% down · 7.5% · 30yr · 1.5% tax · 5.0% vac · 8.0% maint · 8.0% mgmt
Financing live
Cash to close
- Down payment
- $23,750
- Closing costs
- $2,850
- Reserves months
- —
- Total cash needed
- —
Loan-product check · same deal, 3 products live
Conventional
25% down · 7.5% · 30yr
- Down + closing
- —
- Monthly P&I
- —
- Monthly cashflow
- —
- DSCR
- —
- Eligible?
- —
Personal DTI + credit; lowest rate.
DSCR
20% down · 8.5% · 30yr
- Down + closing
- —
- Monthly P&I
- —
- Monthly cashflow
- —
- DSCR
- —
- Eligible?
- —
No personal income docs; deal must DSCR.
Hard money
10% down · 12.0% · 12mo
- Down + closing
- —
- Monthly P&I
- —
- Monthly cashflow
- —
- DSCR
- —
- Eligible?
- —
Short-term bridge; refi at stabilization.
Listing history 30 events
-
2026-06-19days on market $95,000 Active 30 DOM
-
2026-06-18days on market $95,000 Active 29 DOM
-
2026-06-17price $95,000 Active 28 DOM
-
2026-06-17days on market $99,900 Active 28 DOM
-
2026-06-16days on market $99,900 Active 27 DOM
-
2026-06-15days on market $99,900 Active 26 DOM
-
2026-06-14days on market $99,900 Active 24 DOM
-
2026-06-13days on market $99,900 Active 23 DOM
-
2026-06-10days on market $99,900 Active 21 DOM
-
2026-06-09days on market $99,900 Active 20 DOM
-
2026-06-08days on market $99,900 Active 19 DOM
-
2026-06-07days on market $99,900 Active 18 DOM
-
2026-06-05days on market $99,900 Active 15 DOM
-
2026-06-03days on market $99,900 Active 14 DOM
-
2026-06-02days on market $99,900 Active 13 DOM
-
2026-06-01days on market $99,900 Active 12 DOM
-
2026-05-31days on market $99,900 Active 11 DOM
-
2026-05-30days on market $99,900 Active 10 DOM
-
2026-05-21$99,900 Active
-
2026-05-20historical $99,900
-
2021-11-05soldstatus
-
2021-11-04soldstatus Closed
-
2021-09-20status Pending
-
2021-09-19historical
-
2021-08-01price $32,000
-
2021-07-01price $35,000
-
2021-06-01price $39,500
-
2021-05-04status Active
-
2021-04-27status Pending
-
2021-03-24$42,500 Active
ⓘ Source: listings_history table (triggers on properties + properties_extension) + one-shot
backfill from property_details.listing_events for pre-trigger history.
Tax reassessment forecast MO · Resets to sale price
- Current annual tax
- $408 · $34/mo
- Projected year-2 tax
- $922 · $77/mo
- Expected delta
- +$513/yr (+$43/mo · 125.6%)
ⓘ Screening estimate from a state-policy table — verify with the county assessor before closing.
Climate risk First Street
- Flood 1/10 Low FEMA zone X (unshaded) · 0% chance over 30 yrs
- Wildfire 3/10 Moderate
- Heat 5/10 Major 7 d/yr ≥108°F today · 21 d/yr by 30 yrs out
- Wind 2/10 Low 4% chance of damaging wind over 30 yrs
- Air quality 3/10 Moderate 3 unhealthy d/yr today · 5 by 30 yrs out
Nearby sold comps map
Loading sold comps map…
Walkable amenities ~0.75 mi
Loading nearby amenities…
Taxation est. · year 1
- Rental income
- $12,447
- − Mortgage interest
- −$5,321
- − Property taxes
- −$408
- − Insurance
- −$475
- − Repairs & maintenance
- −$996
- − Management
- −$996
- − Depreciation
- −$2,764
- Taxable income
- $1,487
- Est. tax owed @ 24.0%
- −$357
- After-tax cash flow
- $2,615/yr
For passive investors: Depreciation is non-cash, so a rental often shows a tax loss while cash-flowing — sheltering income. Rental losses are passive: they offset passive income freely, and up to $25,000/yr can offset ordinary (W-2) income if you actively participate and your MAGI is under $100k (phasing out to $0 by $150k); unused losses carry forward. On sale, claimed depreciation is recaptured at up to 25%, and gains may owe capital-gains tax (a 1031 exchange can defer both). Figures are a year-1 estimate at your 24.0% rate — not tax advice; consult a CPA.
Schools (NCES district)
- District
- Delta R-V
- NCES district ID
- 2910620
- Math proficiency
- 25% ▼ -10.00%
- Reading proficiency
- 35% ▼ -5.00%
- Median HH income
- $41,301
- Composite
- 28.19/100
- National rank
- #12186
- State rank
- #457 of 535 in MO
Livability — Delta
- Score
- 60/100
- State rank
- #507
- US rank
- #19505
Category grades
Schools grade is shown separately in the Schools card above.
Census & demographics
- Census place
- Delta, MO
- Population (ZIP)
- 5,447
Population outlook (Cape Girardeau County) Hauer SSP2
- Today (2025)
- 84,807 people
- By 2030
- 88,016 · +3.8%
- By 2040
- 93,914 · +10.7%
- By 2050
- 99,541 · +17.4%
- By 2075
- 114,527 · +35.0%
- By 2100
- 121,718 · +43.5%
Race, ethnicity, and origin ACS 2023
- Neighborhood character
- Predominantly White (91%)
- Race & ethnicity
- White 91% Two or more races 6% Black 3%
- Common ancestry
- Italian 2% Iranian 2% Slovak 1%
- Languages at home
- 99% English-only · German/W. Germanic 1%
Political lean MEDSL · Cape Girardeau
- 2024 margin
- Solid R (+46.5) · D 26.2% · R 72.7% · Other 1.1%
- 2008→2024 swing
- -12.9pp toward R · 2008: -33.6pp · 2024: -46.5pp
- All cycles
- 2024: R+46.5 2020: R+45.0 2016: R+50.1 2012: R+43.8 2008: R+33.6
Not yet ingested
- Civics
- —
Market trends
- HPI YoY
- ▼ -34.26%
- Current HPI
- 145.1255
- Rent YoY
- —
- Metro
- —
- State GDP YoY
- ▲ 1.84%
- F500 in state
- 20
Industry mix (Fortune 500 HQ in MO)
| Industry | F500 HQs | Revenue |
|---|---|---|
| Healthcare | 1 | $163B |
|
||
| Insurance | 1 | $21B |
|
||
| Industrial Technology | 1 | $17B |
|
||
| Retail | 1 | $16B |
|
||
| Industrial Distribution | 1 | $10B |
|
||
| Utilities | 1 | $9B |
|
||
Price history
+135.1% since first listed12 events — show timeline
- 2026-05-21 Listed $99,900 MARIS as Distributed by MLS Grid
- 2026-05-20 Coming Soon $99,900 MARIS as Distributed by MLS Grid
- 2021-11-05 Sold (Public Records) — Public Records
- 2021-11-04 Sold (MLS) — MARIS as Distributed by MLS Grid
- 2021-09-20 Pending — MARIS as Distributed by MLS Grid
- 2021-09-19 Delisted — MARIS as Distributed by MLS Grid
- 2021-08-01 Price Changed $32,000 MARIS as Distributed by MLS Grid
- 2021-07-01 Price Changed $35,000 MARIS as Distributed by MLS Grid
- 2021-06-01 Price Changed $39,500 MARIS as Distributed by MLS Grid
- 2021-05-04 Relisted — MARIS as Distributed by MLS Grid
- 2021-04-27 Pending — MARIS as Distributed by MLS Grid
- 2021-03-24 Listed $42,500 MARIS as Distributed by MLS Grid
Property tax history
+1.4%/yrLatest (2025): $408 · +0.7% YoY. Source: county tax records.
Cash-flow waterfall
monthlySold comps — $/sqft
last 12 mo · ≤1 miLoading sold comps…