26197 Bobby Gill Rd · Walker, LA
Flood risk 1/10 · Minimal
- FEMA flood zone
- AE
- Chance of flooding over 30 yrs
- 0.0%
- Est. flood insurance / yr
- $1,737 – $8,500
Fire risk 4/10 · Minor
- Est. fire insurance / yr
- $1,269 – $2,357
Heat risk 8/10 · Major
- Hot days now (above 108°F)
- 7 days/yr
- Hot days in 30 yrs
- 22 days/yr
Wind risk 9/10 · Severe
- Chance of severe wind over 30 yrs
- 99.0%
Air-quality risk 3/10 · Minor
- Unhealthy air days now
- 2 days/yr
- Unhealthy air days in 30 yrs
- 3 days/yr
Risk factors via First Street. Map © Google.
Why this score? — see what drove the C grade
The composite is a weighted blend of 9 inputs, each scored 0–100. Each bar is that input's sub-score; the figure is the points it added to the 100-point composite (weight × sub-score).
- Cash flow +22.9/30.0
- DSCR +7.4/10.0
- ARV discount +6.8/15.0
- 1% rule +5.1/10.0
- Schools +4.0/10.0
- Livability +3.8/5.0
- Rent growth +3.5/5.0
- Condition / age +2.5/5.0
- Appreciation +0.0/10.0
$220,000
🖨 Deal sheet (PDF) 📄 Offer letter ✓ Due diligence
Listing remarks MLS
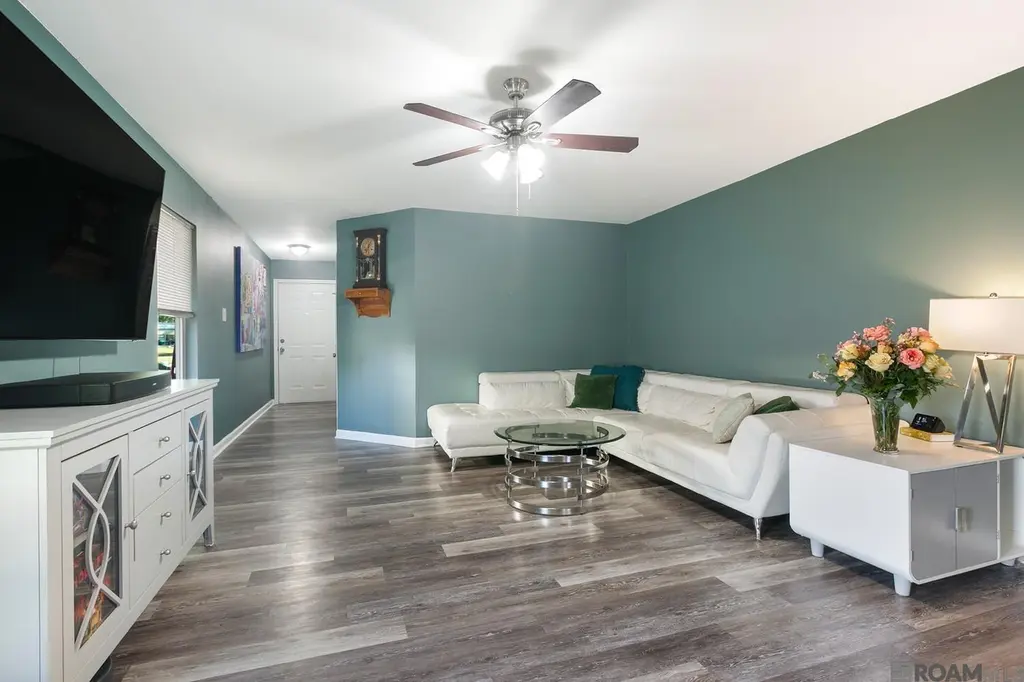
This updated 4-bedroom, 2-bath home has no HOA and NO CARPET. The rear property line backs to an area where no future construction is permitted; if you like privacy-this is the house for you! Special features include SOLAR PANELS, CUSTOM CABINETRY, a security system, and a FENCED yard. Located near the JUBAN Shopping Center, with TARGET and Baton Rouge General coming soon, the neighborhood has an active, welcoming feel, with neighbors often outside, kids playing along the street, an annual holiday fire truck drive-through, and frequent summer visits from the ice cream truck. CONVENIENT ACCESS to SHOPPING, DINING, and MEDICAL SERVICES.
Key facts
- Custom cabinetry
- Security system
- Fenced yard
Tags
Neighborhood map
What this means for you Summary
Snapshot
- This is a 4-bed/2.0-bath single-family listed at $220k.
Deal economics
- At list price, monthly cash flow is $-39 ($-464/yr) — negative.
- To cash-flow at today's rent, offer at most $213k (3.1% below list).
- Meets the 1% rule at list price ($2k rent vs $220k).
- Recommended offer: $200k (9.0% below list) — sets the bar for market timing.
- Cap rate 8.4% vs local median 4.8% in Walker — top-decile yield for the area; either an underpriced asset or a hidden risk that comps aren't pricing in. Stress-test before assuming the spread holds.
Location & tenants
- Location reads 75/100 on livability (#19 in LA, #3,999 nationally) — a middle-class / working-renter tenant base. Strengths: cost of living A+, housing A+, health & safety A+; Watch: crime F, amenities D-, commute F.
- Livingston Parish (suburban): math 40% / reading 52% proficiency, ranked #13 of 98 in LA (top 13%) — families likely to look elsewhere, expect single-tenant / working-renter base with shorter leases.
- Market conditions: Rents rising (+3.8%/yr); 985 active listings in the ZIP; 2 comparable units currently listed for rent nearby; solid renter incomes; 794 units permitted in Livingston Parish in 2024 (99 in 5+ unit buildings).
- This rent runs 34% of the median local income ($79k/yr) — at the standard rent-burdened threshold; future hikes will face affordability resistance.
Forward outlook
- Local home prices are declining (-3.0%/yr); year-one equity from $2k of loan paydown is wiped out by about $7k of value loss. Plan a longer hold.
- Livingston County population projected at +27% by 2050 — long-run rental-demand tailwind backs the buy-and-hold thesis.
Negotiation context
- It's been on market 97 days — a 9% lower offer ($200k) is reasonable based on typical stale-listing flexibility.
- 4 sale attempts since 4y ago with the ask held roughly flat each time — persistent listings suggest the price (not the market) is what's stuck; bring a comps-based counter.
- Current owner paid $184k; 20% above their basis — modest negotiation headroom, anchor on the comps not their cost.
Risks & watch-outs
- Watch-outs: flood insurance adds $427/mo.
- Climate carrying-cost: in FEMA flood zone AE (mandatory federal flood insurance); severe wind risk, 99% chance of damaging wind over 30y; extreme-heat days projected 7→22/yr by 2055 (HVAC capex compounding) — expect insurance premiums to compound above CPI over the hold.
Questions for the listing agent
- What do current leases actually rent for vs. the listed asking? Can we see a recent rent roll and the last 12 months of T-12 income?
- It's been on market 97 days. Have you received any prior offers? Is the seller open to a 9% concession, seller financing, or rate buy-down credit?
- What's the actual annual flood-insurance premium (NFIP or private), and is the property in a SFHA with mandatory coverage?
- Why hasn't it sold? Are there any deal-killer items the seller is aware of (foundation, flood, title, zoning, code violations)?
- Is there a deadline driving the sale (1031 exchange, divorce, estate, relocation)? That informs how much negotiation room exists.
- Schools are A-rated — typically a magnet for longer-tenancy family renters. What's the average tenant stay here, and is there a school-zone premium baked into asking?
- Crime grade is F in this area — have there been break-ins, vandalism, or insurance claims at this property in the last 3 years? What carrier currently insures it and at what premium?
- What's the average days-on-market for RENTAL listings here right now (not sales)? A rising rental-DOM trend means longer vacancies and softer asking-rent achievability than the comps imply.
- What's the recent tenant-quality profile in this submarket — average credit score on applications, eviction rate, late-payment / NSF rate, and stable-employment percentage? A property-management company in the area should have these aggregated.
- How much new for-sale + rental construction is in the pipeline within 1–3 miles? Heavy new supply typically softens prices + rents 12–24 months out; constrained supply supports both.
Investment metrics
- 1% rule
- 1.01% ✓
- Cap rate
- 8.41%
- Cash-on-cash
- 7.56%
- DSCR
- 1.34
- GRM
- 8.3
CMA / ARV
- ARV (median comp)
- $216,756
- List price
- $220,000
- Delta
- 1.50%
- Verdict
- FAIR
- Comps
- 20 within 1.0 mi
Show comp detail 12 sales within ~0.75 mi
| Address | Dist | Beds/Ba | Sqft | Sold | Price | $/sf | Match |
|---|---|---|---|---|---|---|---|
| 26394 Evangeline Trace Blvd | 0.47mi | 3/2.0 (-1) | 1,397 (-0%) | 6mo | $224,900 | $161 | 68 |
| 26470 Parkwood Dr | 0.41mi | 3/2.0 (-1) | 1,448 (+4%) | 3mo | $217,500 | $150 | 67 |
| 12479 Havenwood Dr | 0.30mi | 3/2.0 (-1) | 1,448 (+4%) | 10mo | $209,900 | $145 | 67 |
| 26407 Millstone Dr | 0.28mi | 3/2.5 (-1) | 1,295 (-7%) | 3mo | $195,900 | $151 | 65 |
| 12503 Havenwood Dr | 0.29mi | 3/2.0 (-1) | 1,482 (+6%) | 10mo | $211,000 | $142 | 63 |
| 12943 Hazlewood Dr | 0.54mi | 3/2.0 (-1) | 1,472 (+5%) | 2mo | $218,000 | $148 | 59 |
| 26358 Poplar Gln | 0.43mi | 3/2.0 (-1) | 1,460 (+4%) | 11mo | $212,000 | $145 | 58 |
| 26618 Evangeline Trace Blvd | 0.70mi | 3/2.0 (-1) | 1,394 (-0%) | 8mo | $214,900 | $154 | 56 |
| 12188 Buddy Ellis Rd | 0.73mi | 3/2.0 (-1) | 1,438 (+3%) | 2mo | $225,000 | $156 | 55 |
| 26002 Burlwood Ave | 0.69mi | 3/2.0 (-1) | 1,447 (+4%) | 4mo | $199,900 | $138 | 53 |
| 25879 Sagewood Dr | 0.73mi | 3/2.0 (-1) | 1,272 (-9%) | 4mo | $205,000 | $161 | 43 |
| 12182 Brush Creek St | 0.55mi | 3/2.0 (-1) | 1,564 (+12%) | 8mo | $230,000 | $147 | 42 |
Match score weights: distance 35% · size 25% · config 20% · recency 20%. Top-matched comps best support the ARV.
Projected returns pro-forma
-3.0% appreciation · 3.83% rent growth · sell at horizon
- IRR
- -16.3%
- Equity multiple
- 0.41×
- Total profit
- $-36,054
- Equity at exit
- $32,803
- IRR
- -6.3%
- Equity multiple
- 0.58×
- Total profit
- $-25,997
- Equity at exit
- $19,022
Cash invested: $61,600 (down + closing). Projections, not guarantees.
Landlord ↔ Tenant lean methodology
- Overall (STATE)
- 90 Strongly Landlord-Friendly
- State Louisiana
- 90 Strongly Landlord-Friendly · R+12
- County
- — inherits STATE
- City
- — inherits STATE
ZIP-level market 70726
- Rents YoY
- 3.8%
- Active inventory
- 985
- Price-to-rent
- 8.3×
Monthly cashflow live
- Estimated rent
- $2,211 medium interval (Pro) →
- Mortgage (P&I)
- −$1,154
- Tax from tax record
- −$114 /mo · $1,365/yr
- Insurance
- −$92
- Flood insurance flood zone
- −$427 /mo · $5,118/yr
- HOA
- −$0
- Vacancy / Maint / Mgmt
- −$464
- Net cashflow
- $-39
Break-even live
Sensitivity live
| Price | -10% $86 | -5% $24 | +0% $-39 | +5% $-101 | +10% $-163 |
|---|---|---|---|---|---|
| Rent | -10% $-213 | -5% $-126 | +0% $-39 | +5% $49 | +10% $136 |
| Rate | -1.0pp $72 | -0.5pp $17 | base $-39 | +0.5pp $-96 | +1.0pp $-154 |
UW: 25.0% down · 7.5% · 30yr · 1.5% tax · 5.0% vac · 8.0% maint · 8.0% mgmt
Financing live
Cash to close
- Down payment
- $55,000
- Closing costs
- $6,600
- Reserves months
- —
- Total cash needed
- —
Loan-product check · same deal, 3 products live
Conventional
25% down · 7.5% · 30yr
- Down + closing
- —
- Monthly P&I
- —
- Monthly cashflow
- —
- DSCR
- —
- Eligible?
- —
Personal DTI + credit; lowest rate.
DSCR
20% down · 8.5% · 30yr
- Down + closing
- —
- Monthly P&I
- —
- Monthly cashflow
- —
- DSCR
- —
- Eligible?
- —
No personal income docs; deal must DSCR.
Hard money
10% down · 12.0% · 12mo
- Down + closing
- —
- Monthly P&I
- —
- Monthly cashflow
- —
- DSCR
- —
- Eligible?
- —
Short-term bridge; refi at stabilization.
Rent comps 2 comps
| Address | Beds | Baths | Sqft | Rent | $/sqft | DOM | Units | Dist |
|---|---|---|---|---|---|---|---|---|
| 12856 Silverbell Ave Denham Springs, LA | 4.0 | 2.0 | 1829 | $2,400 | $1.31 | 45d | 1 | 0.71mi |
| 12850 Silverbell Ave Denham Springs, LA | 3.0 | 2.0 | 1606 | $2,200 | $1.37 | 25d | 1 | 0.72mi |
Listing history 13 events
-
2026-05-07status Pending 642-char remark
Show marketing remark (642 chars)
This updated 4-bedroom, 2-bath home has no HOA and NO CARPET. The rear property line backs to an area where no future construction is permitted; if you like privacy-this is the house for you! Special features include SOLAR PANELS, CUSTOM CABINETRY, a security system, and a FENCED yard. Located near the JUBAN Shopping Center, with TARGET and Baton Rouge General coming soon, the neighborhood has an active, welcoming feel, with neighbors often outside, kids playing along the street, an annual holiday fire truck drive-through, and frequent summer visits from the ice cream truck. CONVENIENT ACCESS to SHOPPING, DINING, and MEDICAL SERVICES.
-
2026-01-30$220,000 Active 642-char remark
Show marketing remark (642 chars)
This updated 4-bedroom, 2-bath home has no HOA and NO CARPET. The rear property line backs to an area where no future construction is permitted; if you like privacy-this is the house for you! Special features include SOLAR PANELS, CUSTOM CABINETRY, a security system, and a FENCED yard. Located near the JUBAN Shopping Center, with TARGET and Baton Rouge General coming soon, the neighborhood has an active, welcoming feel, with neighbors often outside, kids playing along the street, an annual holiday fire truck drive-through, and frequent summer visits from the ice cream truck. CONVENIENT ACCESS to SHOPPING, DINING, and MEDICAL SERVICES.
-
2022-09-06soldstatus Sold
-
2022-09-06soldstatus $184,000
-
2022-08-08status Pending
-
2022-08-08price $179,000
-
2022-08-02price $185,000
-
2022-07-25price $194,000
-
2022-07-21$199,000 Active
-
2022-07-21$179,000
-
2010-04-01soldstatus
ⓘ Source: listings_history table (triggers on properties + properties_extension) + one-shot
backfill from property_details.listing_events for pre-trigger history.
Tax reassessment forecast LA · Resets to sale price
- Current annual tax
- $1,365 · $114/mo
- Projected year-2 tax
- $1,365 · $114/mo
- Expected delta
- $0/yr ($0/mo · 0.0%)
ⓘ Screening estimate from a state-policy table — verify with the county assessor before closing.
Climate risk First Street
- Flood 1/10 Low FEMA zone AE · 0% chance over 30 yrs
- Wildfire 4/10 Moderate
- Heat 8/10 Severe 7 d/yr ≥108°F today · 22 d/yr by 30 yrs out
- Wind 9/10 Extreme 99% chance of damaging wind over 30 yrs
- Air quality 3/10 Moderate 2 unhealthy d/yr today · 3 by 30 yrs out
Nearby sold comps map
Loading sold comps map…
Walkable amenities ~0.75 mi
Loading nearby amenities…
Taxation est. · year 1
- Rental income
- $26,536
- − Mortgage interest
- −$12,323
- − Property taxes
- −$1,365
- − Insurance
- −$6,218
- − Repairs & maintenance
- −$2,123
- − Management
- −$2,123
- − Depreciation
- −$6,400
- Taxable loss
- −$4,016
- Est. tax savings @ 24.0%
- +$964
- After-tax cash flow
- $500/yr
For passive investors: Depreciation is non-cash, so a rental often shows a tax loss while cash-flowing — sheltering income. Rental losses are passive: they offset passive income freely, and up to $25,000/yr can offset ordinary (W-2) income if you actively participate and your MAGI is under $100k (phasing out to $0 by $150k); unused losses carry forward. On sale, claimed depreciation is recaptured at up to 25%, and gains may owe capital-gains tax (a 1031 exchange can defer both). Figures are a year-1 estimate at your 24.0% rate — not tax advice; consult a CPA.
Schools (NCES district)
- District
- Livingston Parish
- NCES district ID
- 2201020
- Math proficiency
- 40% ▼ -38.00%
- Reading proficiency
- 52% ▼ -32.00%
- Median HH income
- $56,755
- Composite
- 40.07/100
- National rank
- #3811
- State rank
- #13 of 98 in LA
Livability — Walker
- Score
- 75/100
- State rank
- #19
- US rank
- #3999
Category grades
Schools grade is shown separately in the Schools card above.
Census & demographics
- County
- Livingston Parish · 87,496 people
- City population
- 23,921
- Metro
- Baton Rouge, LA
- Population (ZIP)
- 63,575
- Household income
- $78,621
- Rent vs Own
- Severe rent burden
- 1211.0
Population outlook (Livingston County) Hauer SSP2
- Today (2025)
- 158,511 people
- By 2030
- 168,241 · +6.1%
- By 2040
- 186,252 · +17.5%
- By 2050
- 201,516 · +27.1%
- By 2075
- 231,217 · +45.9%
- By 2100
- 241,697 · +52.5%
Race, ethnicity, and origin ACS 2023
- Neighborhood character
- Predominantly White (74%)
- Race & ethnicity
- White 74% Black 13% Hispanic / Latino 9% Two or more races 6%
- Hispanic origin (detail)
- Mexican 3%
- Common ancestry
- Lithuanian 9% Serbian 1% Italian 1%
- Foreign-born
- 6% · Canada
- Languages at home
- 91% English-only · Spanish 6% Other Indo-European 1%
Political lean MEDSL · Livingston
- 2024 margin
- Solid R (+68.5) · D 15.1% · R 83.6% · Other 1.3%
- 2008→2024 swing
- +3.4pp toward D · 2008: -71.9pp · 2024: -68.5pp
- All cycles
- 2024: R+68.5 2020: R+70.0 2016: R+72.5 2012: R+70.4 2008: R+71.9
Not yet ingested
- Civics
- —
Market trends
- HPI YoY
- ▼ -104.37%
- Current HPI
- 170.2207
- Rent YoY
- ▲ 3.83%
- Metro
- Baton Rouge, LA
- State GDP YoY
- ▲ 3.29%
- F500 in state
- 10
Industry mix (Fortune 500 HQ in LA)
| Industry | F500 HQs | Revenue |
|---|---|---|
| Telecommunications | 2 | $23B |
|
||
| Utilities | 1 | $12B |
|
||
| Wholesale / Distribution | 1 | $5B |
|
||
| Advertising | 1 | $2B |
|
||
Price history
+10.6% since first listed13 events — show timeline
- 2026-05-07 Pending — AcadianaMLS
- 2026-05-07 Pending — GBRMLS
- 2026-01-30 Listed $220,000 GBRMLS
- 2026-01-30 Listed $220,000 AcadianaMLS
- 2022-09-06 Sold (Public Records) $184,000 Public Records
- 2022-09-06 Sold (MLS) — GBRMLS
- 2022-08-08 Pending — GBRMLS
- 2022-08-08 Price Changed $179,000 GBRMLS
- 2022-08-02 Price Changed $185,000 GBRMLS
- 2022-07-25 Price Changed $194,000 GBRMLS
- 2022-07-21 Listed $179,000 AcadianaMLS
- 2022-07-21 Listed $199,000 GBRMLS
- 2010-04-01 Sold (Public Records) — Public Records
Property tax history
-0.6%/yrLatest (2024): $1,365 · -13.3% YoY. Source: county tax records.
Cash-flow waterfall
monthlySold comps — $/sqft
last 12 mo · ≤1 miLoading sold comps…