 Duplex
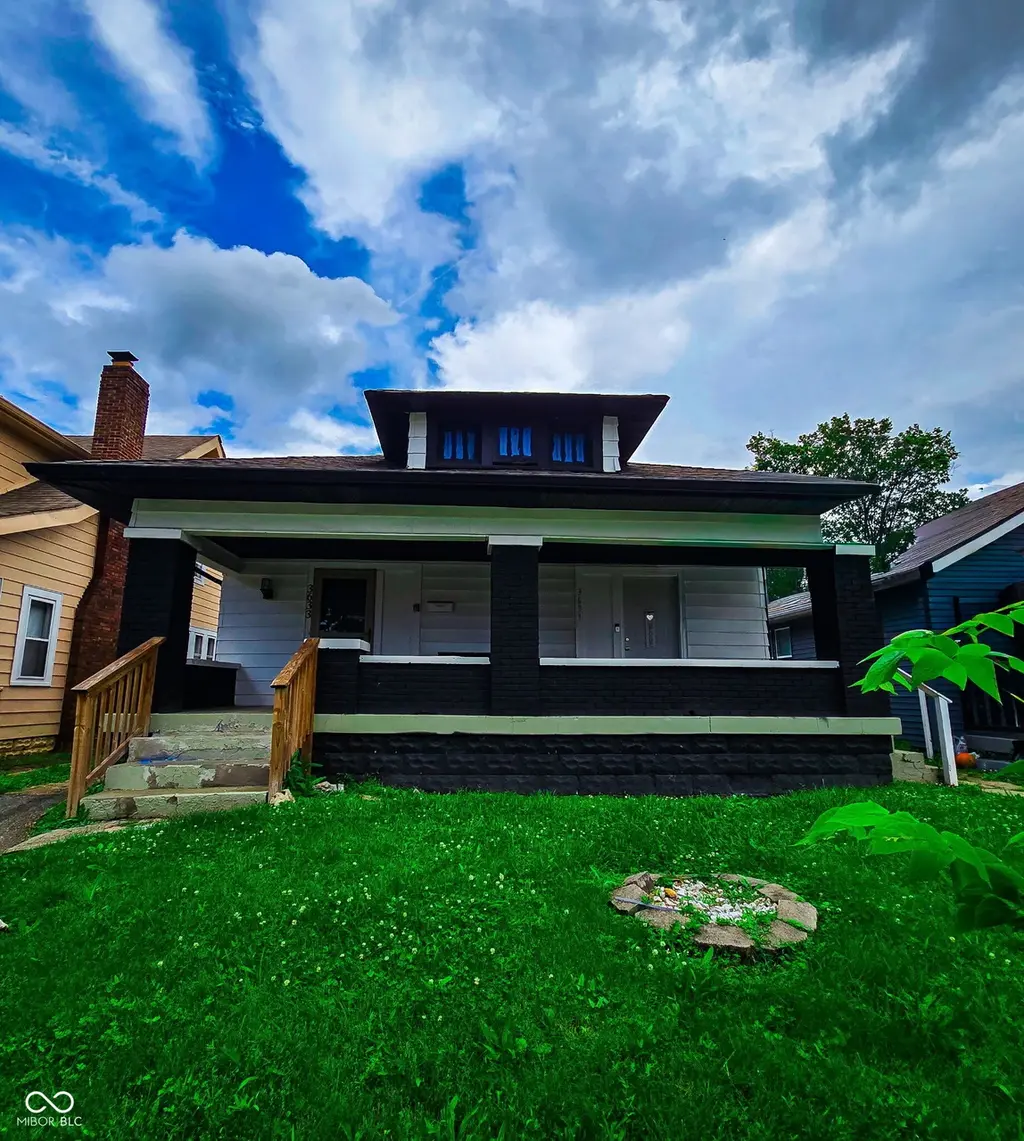
3633 Salem St · Indianapolis city (balance), IN
Flood risk 3/10 · Minor
- FEMA flood zone
- X (unshaded)
- Chance of flooding over 30 yrs
- 0.2%
- Est. flood insurance / yr
- $473 – $860
Fire risk 1/10 · Minimal
- Est. fire insurance / yr
- $717 – $1,331
Heat risk 4/10 · Minor
- Hot days now (above 101°F)
- 7 days/yr
- Hot days in 30 yrs
- 19 days/yr
Wind risk 2/10 · Minimal
- Chance of severe wind over 30 yrs
- 1.0%
Air-quality risk 4/10 · Minor
- Unhealthy air days now
- 5 days/yr
- Unhealthy air days in 30 yrs
- 7 days/yr
Risk factors via First Street. Map © Google.
Why this score? — see what drove the B- grade
The composite is a weighted blend of 9 inputs, each scored 0–100. Each bar is that input's sub-score; the figure is the points it added to the 100-point composite (weight × sub-score).
- Cash flow +26.7/30.0
- ARV discount +15.0/15.0
- DSCR +9.2/10.0
- 1% rule +7.1/10.0
- Rent growth +4.1/5.0
- Livability +2.5/5.0
- Condition / age +2.5/5.0
- Schools +1.4/10.0
- Appreciation +0.0/10.0
$199,000
🖨 Deal sheet (PDF) 📄 Offer letter ✓ Due diligence
Multi-family units
County records classify this as Multi-Family (2-4 Unit). Listing-text estimate: 2 units. confirmed
Listing remarks MLS
This is the perfect investment opportunity. This duplex will provide you instant cash flow to your portfolio. Centrally located in Indianapolis, Close to the red line bus and more.
Key facts
- Renovated duplex
- New flooring
- New paint
Tags
Property features AI
Finance
- Financial info: Two-unit property; Gross annual income reported as $24,000; Owner pays taxes; owner does not pay utilities; Typical rents listed as $1,000 per unit per month; One unit reported without equipment; the other unit includes range/oven and refrigerator; Reported expenses: $0
Exterior
- Parking: On-street parking and 2 car space noted
- Security: Smoke detectors
- Utilities: Solid waste: none
- Home design: Duplex residential income property; One story
- Construction: Aluminum siding and brick exterior
- Exterior features: Access to lot; Alley access
Interior
- Kitchen: Two kitchens (each about 8x5); Range/oven and refrigerator in one unit
- Heating & cooling: Central air; Gas forced-air heating; Gas hot water
- Interior features: Unfinished basement; Storage
- Laundry & utility: Washer/dryer connections in basement; Utilities include central air (cl cntrl air), gas furnace (forced heat), and gas hot water
Neighborhood map
What this means for you Summary
Snapshot
- This is a 2 × 2-bed/1.0-bath units multifamily listed at $199k.
Deal economics
- At list price, monthly cash flow is $539 ($6k/yr) — positive. Per door: $270/mo.
- The deal already cash-flows at list — no discount required.
- Meets the 1% rule at list price ($2k rent vs $199k).
- Cap rate 9.5% vs local median 4.4% in Indianapolis city (balance) — top-decile yield for the area; either an underpriced asset or a hidden risk that comps aren't pricing in. Stress-test before assuming the spread holds.
Location & tenants
- Location reads: area grade B — affects rentability + tenant quality, not the cash-flow math above.
- Indianapolis Public Schools (urban): math 14% / reading 20% proficiency, ranked #286 of 301 in IN (top 95%) — low school quality limits family demand, transient renter base, plan for 1-2y turnover; 77% free/reduced lunch — lower-income household profile, screen leases tightly.
- Zoned schools: Center For Inquiry School 27 (math 25% / reading 29%, grade F, #737 of 994 statewide, top 76%, 525 students, 51% FRL); H L Harshman Middle School (math 3% / reading 16%, grade F, #316 of 330 statewide, top 96%, 549 students, 84% FRL); Arsenal Technical High School (math 6% / reading 27%, grade F, #353 of 369 statewide, top 96%, 2,366 students, 74% FRL).
- Market conditions: Rents rising fast (+6.4%/yr); 283 active listings in the ZIP; 40 comparable units currently listed for rent nearby; rentals at typical pace (median 24d on market — plan ~3-4 weeks tenant-placement turnaround); 1,906 units permitted in Marion County in 2024 (621 in 5+ unit buildings).
- At $2,405/mo this rent would consume 48% of the median local household income ($60k/yr) (locally 978% of renters already pay >50% of income on rent) — very limited rent-growth headroom before tenants either downsize or default.
Forward outlook
- Local home prices are declining (-3.0%/yr); year-one equity from $1k of loan paydown is wiped out by about $6k of value loss. Plan a longer hold.
- Marion County population projected at +18% by 2050 — long-run rental-demand tailwind backs the buy-and-hold thesis.
- At projected returns (-3.0% appreciation + 6.4% rent growth), your $56k cash investment doubles in ~8 years — after that, you're playing with house money.
Negotiation context
- Only 9 days on market — expect competitive offers; lowballing is unlikely to land.
- 7 sale attempts since 11y ago with the ask held roughly flat each time — persistent listings suggest the price (not the market) is what's stuck; bring a comps-based counter.
- Current owner paid $89k; list at $199k implies a 124% gain — meaningful room to come down on a strong offer.
Risks & watch-outs
- Watch-outs: built in 1925 — expect roof / HVAC / electrical / plumbing capex.
Questions for the listing agent
- Can we see the unit-by-unit rent roll, current vacancy, and any below-market leases? What's the average tenancy length?
- What capital expenditures (roof, boiler, parking lot, exteriors) have been made in the last 5 years, and what's planned in the next 2?
- Built in 1925 — when were the roof, HVAC, electrical panel, plumbing, and water heater last replaced?
- Is there a deadline driving the sale (1031 exchange, divorce, estate, relocation)? That informs how much negotiation room exists.
- What's the average days-on-market for RENTAL listings here right now (not sales)? A rising rental-DOM trend means longer vacancies and softer asking-rent achievability than the comps imply.
- What's the recent tenant-quality profile in this submarket — average credit score on applications, eviction rate, late-payment / NSF rate, and stable-employment percentage? A property-management company in the area should have these aggregated.
- How much new apartment / multifamily construction is in the pipeline within 1–3 miles? Heavy new supply (>2% of stock underway) typically softens rents 12–24 months out; light construction supports rent growth.
Investment metrics
- 1% rule
- 1.21% ✓
- Cap rate
- 9.54%
- Cash-on-cash
- 11.61%
- DSCR
- 1.52
- GRM
- 6.9
CMA / ARV
- ARV (on-the-fly)
- $270,728
- Comps found
- 2
Show comp detail 2 sales within ~0.75 mi
| Address | Dist | Beds/Ba | Sqft | Sold | Price | $/sf | Match |
|---|---|---|---|---|---|---|---|
| 3706 N Kenwood Ave | 0.17mi | 2/1.0 (+1) | 750 (-5%) | 21mo | $245,000 | $327 | 62 |
| 3237 Central Ave | 0.66mi | 1/1.0 | 800 (+2%) | 14mo | $275,000 | $344 | 54 |
Match score weights: distance 35% · size 25% · config 20% · recency 20%. Top-matched comps best support the ARV.
Projected returns pro-forma
-3.0% appreciation · 6.43% rent growth · sell at horizon
- IRR
- 4.8%
- Equity multiple
- 1.19×
- Total profit
- $10,713
- Equity at exit
- $29,672
- IRR
- 17.2%
- Equity multiple
- 2.64×
- Total profit
- $91,473
- Equity at exit
- $17,206
Cash invested: $55,720 (down + closing). Projections, not guarantees.
Landlord ↔ Tenant lean methodology
- Overall (STATE)
- 90 Strongly Landlord-Friendly
- State Indiana
- 90 Strongly Landlord-Friendly · R+11
- County
- — inherits STATE
- City
- — inherits STATE
ZIP-level market 46208
- Rents YoY
- 6.4%
- Active inventory
- 283
- Price-to-rent
- 13.8×
Monthly cashflow live
- Estimated rent
- $2,405 medium interval (Pro) →
- Mortgage (P&I)
- −$1,044
- Tax from tax record
- −$234 /mo · $2,810/yr
- Insurance
- −$83
- HOA
- −$0
- Vacancy / Maint / Mgmt
- −$505
- Net cashflow
- $539
Break-even live
Sensitivity live
| Price | -10% $652 | -5% $596 | +0% $539 | +5% $483 | +10% $427 |
|---|---|---|---|---|---|
| Rent | -10% $349 | -5% $444 | +0% $539 | +5% $634 | +10% $729 |
| Rate | -1.0pp $639 | -0.5pp $590 | base $539 | +0.5pp $488 | +1.0pp $435 |
2-unit breakdown (identical units grouped — click to expand)
| Units | Beds | Baths | Est. rent |
|---|---|---|---|
| 2× units | 2 | 1 | $2,406 |
| #1 | 2 | 1 | $1,203 |
| #2 | 2 | 1 | $1,203 |
| Total (2 units) | $2,405 | ||
UW: 25.0% down · 7.5% · 30yr · 1.5% tax · 5.0% vac · 8.0% maint · 8.0% mgmt
Financing live
Cash to close
- Down payment
- $49,750
- Closing costs
- $5,970
- Reserves months
- —
- Total cash needed
- —
Loan-product check · same deal, 3 products live
Conventional
25% down · 7.5% · 30yr
- Down + closing
- —
- Monthly P&I
- —
- Monthly cashflow
- —
- DSCR
- —
- Eligible?
- —
Personal DTI + credit; lowest rate.
DSCR
20% down · 8.5% · 30yr
- Down + closing
- —
- Monthly P&I
- —
- Monthly cashflow
- —
- DSCR
- —
- Eligible?
- —
No personal income docs; deal must DSCR.
Hard money
10% down · 12.0% · 12mo
- Down + closing
- —
- Monthly P&I
- —
- Monthly cashflow
- —
- DSCR
- —
- Eligible?
- —
Short-term bridge; refi at stabilization.
Rent comps 40 comps
| Address | Beds | Baths | Sqft | Rent | $/sqft | DOM | Units | Dist |
|---|---|---|---|---|---|---|---|---|
| 3640 N Meridian St Unit 11 Indianapolis, IN | 1.0 | 1.0 | 700 | $699 | $1.00 | 45d | 1 | 0.04mi |
| 3640 N Meridian St Unit 13 Indianapolis, IN | 1.0 | 1.0 | 700 | $699 | $1.00 | 25d | 1 | 0.04mi |
| 3710 N Meridian St Indianapolis, IN | 2.0 | 1.0–2.0 | 670 | $799 | $1.19 | 0d | 33 | 0.05mi |
| 3707 N Meridian St Indianapolis, IN | 2.0 | 1.0–2.0 | 1042 | $932 | $0.89 | 45d | 1 | 0.09mi |
| 3540 N Meridian St Indianapolis, IN | 1.0 | 1.0 | 757 | $789 | $1.04 | 6d | 3 | 0.10mi |
| 3726 N Meridian St Apt 33 Indianapolis, IN | 1.0 | 1.0 | 725 | $750 | $1.03 | 25d | 1 | 0.10mi |
| 3541 N Meridian St Indianapolis, IN | 1.0–2.0 | 1.0 | 987 | $760 | $0.77 | 45d | 1 | 0.13mi |
| 3729 N Kenwood Ave Indianapolis, IN | 2.0 | 1.0 | 1107 | $1,100 | $0.99 | 45d | 1 | 0.17mi |
| 3501 N Illinois St Unit 3 Indianapolis, IN | 2.0 | 2.0 | 1087 | $1,350 | $1.24 | 9d | 1 | 0.18mi |
| 3524 N Pennsylvania St Indianapolis, IN | 2.0 | 1.0 | 725 | $872 | $1.20 | 4d | 4 | 0.20mi |
| 3671 N Pennsylvania St Indianapolis, IN | 2.0 | 1.0 | 725 | $794 | $1.10 | 21d | 1 | 0.22mi |
| 3801 N Meridian St Indianapolis, IN | 1.0–3.0 | 1.0–2.0 | 1057 | $925 | $0.87 | 22d | 35 | 0.24mi |
| 57 E 38th St Indianapolis, IN | 1.0 | 1.0 | 750 | $770 | $1.03 | 4d | 4 | 0.25mi |
| 3554 N Washington Blvd Apt 2 Indianapolis, IN | 1.0 | 1.0 | 800 | $750 | $0.94 | 45d | 1 | 0.30mi |
| 3469 Graceland Ave Indianapolis, IN | 2.0 | 1.0 | 1000 | $1,200 | $1.20 | 45d | 1 | 0.31mi |
| 3340 N Meridian St Unit 3340-305 Indianapolis, IN | 1.0 | 1.0 | 650 | $855 | $1.32 | 25d | 1 | 0.37mi |
| 3340 N Meridian St Unit 3340-302 Indianapolis, IN | 1.0 | 1.0 | 650 | $855 | $1.32 | 22d | 1 | 0.38mi |
| 3330 N Meridian St Unit 3330-306 Indianapolis, IN | 1.0 | 1.0 | 650 | $855 | $1.32 | 22d | 1 | 0.40mi |
| 3310 N Meridian St Indianapolis, IN | 1.0–2.0 | 1.0 | 750 | $855 | $1.14 | 45d | 3 | 0.41mi |
| 3815 Washington Blvd Indianapolis, IN | 2.0 | 1.0 | 1000 | $1,250 | $1.25 | 9d | 1 | 0.41mi |
| 3836 Central Ave Indianapolis, IN | 1.0 | 1.0 | 600 | $1,125 | $1.88 | 25d | 1 | 0.50mi |
| 4031 Boulevard Pl Indianapolis, IN | 1.0 | 1.0 | 700 | $895 | $1.28 | 22d | 1 | 0.58mi |
| 636 E 37th St Unit 5 Indianapolis, IN | 2.0 | 1.0 | 700 | $695 | $0.99 | 25d | 1 | 0.68mi |
| 3716 N College Ave Unit 3 Indianapolis, IN | 2.0 | 2.0 | 1100 | $1,450 | $1.32 | 45d | 1 | 0.69mi |
| 3924 Byram Ave Indianapolis, IN | 1.0 | 1.0 | 810 | $1,099 | $1.36 | 6d | 1 | 0.74mi |
| 4210 Graceland Ave Indianapolis, IN | 1.0 | 1.0 | 676 | $900 | $1.33 | 23d | 1 | 0.77mi |
| 3359 N College Ave Unit 3359 Indianapolis, IN | 2.0 | 1.5 | 1082 | $1,895 | $1.75 | 25d | 1 | 0.78mi |
| 4023 Clarendon Rd Indianapolis, IN | 1.0 | 1.0 | 572 | $950 | $1.66 | 45d | 1 | 0.84mi |
| 2937 N Kenwood Ave Unit A Indianapolis, IN | 1.0 | 1.0 | 672 | $889 | $1.32 | 23d | 1 | 0.88mi |
| 2937 Shriver Ave Indianapolis, IN | 1.0 | 1.0 | 564 | $850 | $1.51 | 45d | 1 | 0.96mi |
| 3909 Winthrop Ave Unit B Indianapolis, IN | 2.0 | 1.5 | 931 | $1,550 | $1.66 | 14d | 1 | 0.99mi |
| 2818 N Capitol Ave Apt 1 Indianapolis, IN | 1.0 | 1.0 | 600 | $2,000 | $3.33 | 45d | 1 | 1.05mi |
| 2808 N Capitol Ave Indianapolis, IN | 2.0 | 1.0 | 900 | $975 | $1.08 | 25d | 1 | 1.06mi |
| 1 W 28th St Indianapolis, IN | 1.0 | 1.0 | 656 | $970 | $1.48 | 4d | 15 | 1.08mi |
| 3610 Balsam Ave Indianapolis, IN | 1.0 | 1.0 | 464 | $775 | $1.67 | 4d | 9 | 1.08mi |
| 3203 Sutherland Ave Unit 1310761P Indianapolis, IN | 2.0 | 1.0 | 1097 | $3,668 | $3.34 | 4d | 1 | 1.09mi |
| 732 Clarendon Pl Indianapolis, IN | 2.0 | 1.0 | 800 | $1,100 | $1.38 | 45d | 1 | 1.10mi |
| 3609 Balsam Ave Indianapolis, IN | 1.0 | 1.0 | 541 | $775 | $1.43 | 4d | 1 | 1.11mi |
| 3609 Balsam Ave Indianapolis, IN | 1.0 | 1.0 | 541 | $755 | $1.40 | 16d | 1 | 1.11mi |
| 541 W 29th St Indianapolis, IN | 1.0 | 1.0 | 740 | $900 | $1.22 | 21d | 1 | 1.14mi |
Listing history 7 events
-
2026-06-13statusdays on market $199,000 Pending 9 DOM
-
2026-06-09days on market $199,000 Active 8 DOM
-
2026-06-08days on market $199,000 Active 7 DOM
-
2026-06-07days on market $199,000 Active 6 DOM
-
2026-06-03days on market $199,000 Active 2 DOM
-
2026-06-02remarks 370-char remark
-
2026-06-02$199,000 Active 1 DOM
ⓘ Source: listings_history table (triggers on properties + properties_extension) + one-shot
backfill from property_details.listing_events for pre-trigger history.
Tax reassessment forecast IN · Partial reset (capped growth)
- Current annual tax
- $2,810 · $234/mo
- Projected year-2 tax
- $2,810 · $234/mo
- Expected delta
- $0/yr ($0/mo · 0.0%)
ⓘ Screening estimate from a state-policy table — verify with the county assessor before closing.
Climate risk First Street
- Flood 3/10 Moderate FEMA zone X (unshaded) · 20% chance over 30 yrs
- Wildfire 1/10 Low
- Heat 4/10 Moderate 7 d/yr ≥101°F today · 19 d/yr by 30 yrs out
- Wind 2/10 Low 100% chance of damaging wind over 30 yrs
- Air quality 4/10 Moderate 5 unhealthy d/yr today · 7 by 30 yrs out
Nearby sold comps map
Loading sold comps map…
Walkable amenities ~0.75 mi
Loading nearby amenities…
Taxation est. · year 1
- Rental income
- $28,860
- − Mortgage interest
- −$11,147
- − Property taxes
- −$2,810
- − Insurance
- −$995
- − Repairs & maintenance
- −$2,309
- − Management
- −$2,309
- − Depreciation
- −$5,789
- Taxable income
- $3,501
- Est. tax owed @ 24.0%
- −$840
- After-tax cash flow
- $5,631/yr
For passive investors: Depreciation is non-cash, so a rental often shows a tax loss while cash-flowing — sheltering income. Rental losses are passive: they offset passive income freely, and up to $25,000/yr can offset ordinary (W-2) income if you actively participate and your MAGI is under $100k (phasing out to $0 by $150k); unused losses carry forward. On sale, claimed depreciation is recaptured at up to 25%, and gains may owe capital-gains tax (a 1031 exchange can defer both). Figures are a year-1 estimate at your 24.0% rate — not tax advice; consult a CPA.
Schools (NCES district)
- District
- Indianapolis Public Schools
- NCES district ID
- 1804770
- Math proficiency
- 14% ▼ -7.00%
- Reading proficiency
- 20% ▼ -3.00%
- Median HH income
- $32,034
- Composite
- 13.69/100
- National rank
- #9499
- State rank
- #286 of 301 in IN
Livability — Indianapolis city (balance)
No livability data for this city. (Only ~50 U.S. cities are tracked.)
Census & demographics
- Census place
- Indianapolis city (balance), IN
- County
- Marion County · 998,460 people
- City population
- 881,119
- Metro
- Indianapolis-Carmel-Anderson, IN
- Population (ZIP)
- 22,379
- Household income
- $60,062
- Rent vs Own
- Severe rent burden
- 978.0
Population outlook (Marion County) Hauer SSP2
- Today (2025)
- 1,025,572 people
- By 2030
- 1,065,727 · +3.9%
- By 2040
- 1,141,577 · +11.3%
- By 2050
- 1,208,920 · +17.9%
- By 2075
- 1,367,288 · +33.3%
- By 2100
- 1,438,201 · +40.2%
Race, ethnicity, and origin ACS 2023
- Neighborhood character
- Diverse neighborhood (Simpson 0.62)
- Race & ethnicity
- White 46% Black 40% Hispanic / Latino 8% Two or more races 6% Asian 2%
- Hispanic origin (detail)
- Mexican 4%
- Common ancestry
- Romanian 2% Slovak 2% Italian 1%
- Foreign-born
- 4% · Canada
- Languages at home
- 93% English-only · Spanish 5% French/Haitian/Cajun 1% Other Indo-European 1%
Political lean MEDSL · Marion
- 2024 margin
- Strong D (+27.7) · D 63.0% · R 35.3% · Other 1.7%
- 2008→2024 swing
- -0.7pp no change · 2008: 28.4pp · 2024: 27.7pp
- All cycles
- 2024: D+27.7 2020: D+29.1 2016: D+22.8 2012: D+22.2 2008: D+28.4
Not yet ingested
- Civics
- —
Market trends
- HPI YoY
- ▼ -324.63%
- Current HPI
- 319.7725
- Rent YoY
- ▲ 6.43%
- Metro
- Indianapolis-Carmel-Anderson, IN
- State GDP YoY
- ▲ 2.90%
- F500 in state
- 18
Industry mix (Fortune 500 HQ in IN)
| Industry | F500 HQs | Revenue |
|---|---|---|
| Industrial Machinery | 2 | $37B |
|
||
| Healthcare | 1 | $177B |
|
||
| Pharmaceuticals | 1 | $45B |
|
||
| Metals / Steel | 1 | $18B |
|
||
| Agriculture | 1 | $17B |
|
||
| Packaging | 1 | $12B |
|
||
Price history
+1226.7% since first listed19 events — show timeline
- 2026-06-01 Listed $199,000 MIBOR as Distributed by MLS Grid
- 2021-02-22 Sold (MLS) $89,000 MIBOR as Distributed by MLS Grid
- 2021-01-17 Pending — MIBOR as Distributed by MLS Grid
- 2021-01-16 Listing Removed — MIBOR as Distributed by MLS Grid
- 2021-01-13 Listed $104,900 MIBOR as Distributed by MLS Grid
- 2020-12-21 Pending — MIBOR as Distributed by MLS Grid
- 2020-12-07 Price Changed $104,900 MIBOR as Distributed by MLS Grid
- 2020-11-11 Listed $110,000 MIBOR as Distributed by MLS Grid
- 2019-07-11 Sold (MLS) $37,000 MIBOR as Distributed by MLS Grid
- 2019-06-20 Pending — MIBOR as Distributed by MLS Grid
- 2019-05-21 Listed $43,000 MIBOR as Distributed by MLS Grid
- 2016-10-28 Sold (MLS) $23,000 MIBOR as Distributed by MLS Grid
- 2016-10-17 Pending — MIBOR as Distributed by MLS Grid
- 2016-09-14 Listed $25,000 MIBOR as Distributed by MLS Grid
- 2015-12-14 Listing Removed — MIBOR as Distributed by MLS Grid
- 2015-10-09 Listed $35,000 MIBOR as Distributed by MLS Grid
- 2015-09-29 Pending — MIBOR as Distributed by MLS Grid
- 2015-09-16 Sold (MLS) $10,000 MIBOR as Distributed by MLS Grid
- 2015-06-10 Listed $15,000 MIBOR as Distributed by MLS Grid
Property tax history
+10.7%/yrLatest (2025): $2,810 · +4.0% YoY. Source: county tax records.
Cash-flow waterfall
monthlySold comps — $/sqft
last 12 mo · ≤1 miLoading sold comps…