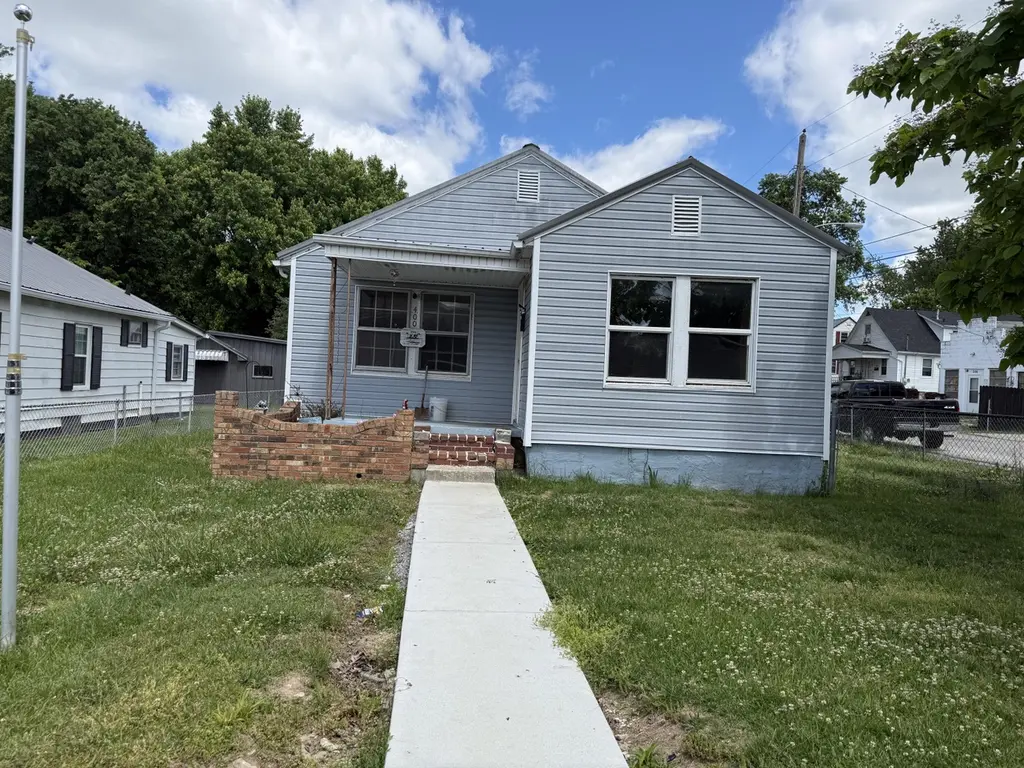
400 Westover Ave · Richmond, KY
Flood risk 1/10 · Minimal
- FEMA flood zone
- X (unshaded)
- Chance of flooding over 30 yrs
- 0.0%
- Est. flood insurance / yr
- $507 – $1,088
Fire risk 3/10 · Minor
- Est. fire insurance / yr
- $839 – $1,559
Heat risk 4/10 · Minor
- Hot days now (above 102°F)
- 7 days/yr
- Hot days in 30 yrs
- 19 days/yr
Wind risk 2/10 · Minimal
- Chance of severe wind over 30 yrs
- 4.0%
Air-quality risk 1/10 · Minimal
- Unhealthy air days now
- 0 days/yr
- Unhealthy air days in 30 yrs
- 0 days/yr
Risk factors via First Street. Map © Google.
Why this score? — see what drove the B- grade
The composite is a weighted blend of 9 inputs, each scored 0–100. Each bar is that input's sub-score; the figure is the points it added to the 100-point composite (weight × sub-score).
- Cash flow +25.8/30.0
- ARV discount +15.0/15.0
- DSCR +8.6/10.0
- 1% rule +5.6/10.0
- Livability +3.5/5.0
- Schools +3.3/10.0
- Rent growth +3.2/5.0
- Condition / age +2.5/5.0
- Appreciation +0.0/10.0
$135,000
🖨 Deal sheet 📄 Offer letter ✓ Due diligence
Listing remarks
Welcome to 400 Westover Avenue in the heart of Richmond. This approximately 1,330 square foot home sits on a manageable city lot and features a detached garage space, giving you extra room for storage, hobbies, or workshop possibilities. Public records indicate the property is a single-family home with off-street parking and garage options. Located just minutes from downtown Richmond and close to Eastern Kentucky University, this property places you near shopping, dining, schools, and everyday conveniences while still offering the comfort of an established neighborhood setting. Nearby homes reflect a growing and active market area with a mix of updated homes and investment opportunities. Wh
Key facts
- Close to parks
- Close to schools
- Close to restaurants
Tags
Property features AI
Finance
- Other: Lot about 0.113 acres (public records)
Exterior
- Parking: Detached carport; Has garage
- Utilities: Public sewer
- Home design: House; 1,330 building area total
- Construction: Vinyl siding; Block foundation
- Exterior features: Chain link and wood fencing; Public water; Not waterfront; No significant view
Interior
- Bathrooms: 1 full bathroom
- Heating & cooling: Heat pump for heating and cooling
- Interior features: Total of 4 rooms; Crawl space basement; No fireplace
Neighborhood map
What this means for you Summary
Snapshot
- This is a 3-bed/1.0-bath single-family listed at $135k.
Deal economics
- At list price, monthly cash flow is $328 ($4k/yr) — positive.
- The deal already cash-flows at list — no discount required.
- Meets the 1% rule at list price ($1k rent vs $135k).
- Recommended offer: $133k (1.5% below list) — sets the bar for market timing.
- Cap rate 9.2% vs local median 3.1% in Richmond — top-decile yield for the area; either an underpriced asset or a hidden risk that comps aren't pricing in. Stress-test before assuming the spread holds.
Location & tenants
- Location reads 69/100 on livability (#163 in KY) — a middle-class / working-renter tenant base. Strengths: cost of living A+, health & safety A+, housing A; Watch: amenities F, commute F, employment F.
- Madison County (town): math 31% / reading 47% proficiency, ranked #35 of 165 in KY (top 21%) — families likely to look elsewhere, expect single-tenant / working-renter base with shorter leases.
- Zoned schools: Madison County Day Treatment (math 24% / reading 24%, 16 students, 81% FRL) — zoned schools average 81% FRL vs 42% district-wide (39 pts higher); higher-poverty schools than district average — tighter screening recommended.
- Zoned-school proficiency averages 24% at this address vs 39% district-wide (-14 pts) — the specific schools serving this property underperform the Madison County average; the district grade overstates school quality for this exact location.
- Market conditions: Rents rising (+2.8%/yr); 487 active listings in the ZIP; 17 comparable units currently listed for rent nearby; rentals lingering (median 44d on market — plan ~5-8 weeks vacancy on turnover, expect pricing pressure); 53% of comp listings sitting > 30 days — soft ceiling on asking rent; 453 units permitted in Madison County in 2024 (64 in 5+ unit buildings).
Forward outlook
- Local home prices are declining (-3.0%/yr); year-one equity from $933 of loan paydown is wiped out by about $4k of value loss. Plan a longer hold.
- Madison County population projected at +28% by 2050 — long-run rental-demand tailwind backs the buy-and-hold thesis.
Negotiation context
- It's been on market 30 days — a 2% lower offer ($133k) is reasonable based on typical stale-listing flexibility.
- Current owner paid $55k; list at $135k implies a 145% gain — meaningful room to come down on a strong offer.
Questions for the listing agent
- Built in 1970 — when were the roof, HVAC, electrical panel, plumbing, and water heater last replaced?
- Is there a deadline driving the sale (1031 exchange, divorce, estate, relocation)? That informs how much negotiation room exists.
- Schools are D-rated, which usually means shorter tenancies and higher turnover. Who's the typical renter profile here, and what's been the actual vacancy rate?
- What's the average days-on-market for RENTAL listings here right now (not sales)? A rising rental-DOM trend means longer vacancies and softer asking-rent achievability than the comps imply.
- What's the recent tenant-quality profile in this submarket — average credit score on applications, eviction rate, late-payment / NSF rate, and stable-employment percentage? A property-management company in the area should have these aggregated.
- How much new for-sale + rental construction is in the pipeline within 1–3 miles? Heavy new supply typically softens prices + rents 12–24 months out; constrained supply supports both.
Investment metrics
- 1% rule
- 1.06% ✓
- Cap rate
- 9.21%
- Cash-on-cash
- 10.43%
- DSCR
- 1.46
- GRM
- 7.9
CMA / ARV
- ARV (on-the-fly)
- $199,500
- Comps found
- 12
Show comp detail 12 sales within ~0.75 mi
| Address | Dist | Beds/Ba | Sqft | Sold | Price | $/sf | Match |
|---|---|---|---|---|---|---|---|
| 515 Letcher Ave | 0.22mi | 3/1.0 | 1,343 (+1%) | 9mo | $156,000 | $116 | 80 |
| 337 W Kentucky Ave | 0.12mi | 3/2.0 | 1,229 (-8%) | 5mo | $169,000 | $138 | 74 |
| 512 Letcher Ave | 0.20mi | 3/1.5 | 1,439 (+8%) | 8mo | $144,330 | $100 | 68 |
| 411 Norwood Dr | 0.37mi | 3/1.0 | 1,240 (-7%) | 9mo | $212,000 | $171 | 64 |
| 506 Westover Ave | 0.09mi | 2/2.0 (-1) | 1,200 (-10%) | 9mo | $86,000 | $72 | 63 |
| 101 Bellevue Dr | 0.40mi | 3/1.0 | 1,233 (-7%) | 10mo | $165,000 | $134 | 61 |
| 406 Clay Dr | 0.47mi | 3/1.0 | 1,247 (-6%) | 9mo | $210,000 | $168 | 60 |
| 107 Mildred Ct | 0.17mi | 3/1.0 | 1,133 (-15%) | 9mo | $169,500 | $150 | 60 |
| 101 Mcwhorter Ct | 0.48mi | 3/1.0 | 1,144 (-14%) | 2mo | $125,000 | $109 | 53 |
| 216 Stratford Dr | 0.57mi | 3/2.0 | 1,232 (-7%) | 7mo | $295,000 | $239 | 51 |
| 214 Pembroke Dr | 0.60mi | 3/2.0 | 1,442 (+8%) | 8mo | $250,000 | $173 | 47 |
| 106 Janwell Dr | 0.49mi | 2/2.0 (-1) | 1,157 (-13%) | 8mo | $250,000 | $216 | 40 |
Match score weights: distance 35% · size 25% · config 20% · recency 20%. Top-matched comps best support the ARV.
Projected returns pro-forma
-3.0% appreciation · 2.82% rent growth · sell at horizon
- IRR
- -0.9%
- Equity multiple
- 0.97×
- Total profit
- $-1,271
- Equity at exit
- $20,129
- IRR
- 8.6%
- Equity multiple
- 1.65×
- Total profit
- $24,538
- Equity at exit
- $11,672
Cash invested: $37,800 (down + closing). Projections, not guarantees.
Landlord ↔ Tenant lean methodology
- Overall (STATE)
- 83 Strongly Landlord-Friendly
- State Kentucky
- 83 Strongly Landlord-Friendly · R+16
- County
- — inherits STATE
- City
- — inherits STATE
ZIP-level market 40475
- Home prices YoY
- -22.7%
- Rents YoY
- 2.8%
- Active inventory
- 487
- Price-to-rent
- 7.9×
Monthly cashflow live
- Estimated rent
- $1,433 high interval (Pro) →
- Mortgage (P&I)
- −$708
- Tax from tax record
- −$39 /mo · $471/yr
- Insurance
- −$56
- HOA
- −$0
- Vacancy / Maint / Mgmt
- −$301
- Net cashflow
- $328
Break-even live
UW: 25.0% down · 7.5% · 30yr · 1.5% tax · 5.0% vac · 8.0% maint · 8.0% mgmt
Financing live
Cash to close
- Down payment
- $33,750
- Closing costs
- $4,050
- Reserves months
- —
- Total cash needed
- —
Loan-product check · same deal, 3 products live
Conventional
25% down · 7.5% · 30yr
- Down + closing
- —
- Monthly P&I
- —
- Monthly cashflow
- —
- DSCR
- —
- Eligible?
- —
Personal DTI + credit; lowest rate.
DSCR
20% down · 8.5% · 30yr
- Down + closing
- —
- Monthly P&I
- —
- Monthly cashflow
- —
- DSCR
- —
- Eligible?
- —
No personal income docs; deal must DSCR.
Hard money
10% down · 12.0% · 12mo
- Down + closing
- —
- Monthly P&I
- —
- Monthly cashflow
- —
- DSCR
- —
- Eligible?
- —
Short-term bridge; refi at stabilization.
Rent comps 17 comps
| Address | Beds | Baths | Sqft | Rent | $/sqft | DOM | Units | Dist |
|---|---|---|---|---|---|---|---|---|
| 307 W Blair Ave Richmond, KY | 3.0 | 2.0 | 1640 | $1,850 | $1.13 | 14d | 1 | 0.15mi |
| 107 Darleen Ct Richmond, KY | 3.0 | 1.0 | 1128 | $1,200 | $1.06 | 44d | 1 | 0.18mi |
| 254 Lombardy St Richmond, KY | 3.0 | 1.0 | 655 | $1,250 | $1.91 | 14d | 4 | 0.39mi |
| 128 Parrish Ave Richmond, KY | 4.0 | 2.0 | 1800 | $1,850 | $1.03 | 44d | 1 | 0.40mi |
| 333 High St Unit A Richmond, KY | 2.0 | 2.0 | 1100 | $1,600 | $1.45 | 44d | 1 | 0.57mi |
| 327 High St Apt B Richmond, KY | 2.0 | 2.0 | 1100 | $1,550 | $1.41 | 14d | 1 | 0.58mi |
| 327 High St Unit C Richmond, KY | 2.0 | 2.0 | 1100 | $950 | $0.86 | 44d | 1 | 0.58mi |
| 428 North St Unit Z2 Richmond, KY | 3.0 | 1.0 | 1310 | $1,099 | $0.84 | 44d | 1 | 0.59mi |
| 2 Wellington Ct Unit A Richmond, KY | 3.0 | 1.0 | 1100 | $2,450 | $2.23 | 44d | 1 | 0.69mi |
| 325 S 3rd St Unit B Richmond, KY | 2.0 | 1.0 | 1000 | $1,195 | $1.20 | 23d | 1 | 0.77mi |
| 223 W Broadway Ave Richmond, KY | 3.0 | 1.0 | 1095 | $1,175 | $1.07 | 44d | 1 | 0.80mi |
| 512 Claire Pl Richmond, KY | 1.0–2.0 | 1.0–2.0 | 913 | $1,345 | $1.47 | 44d | 2 | 0.87mi |
| 1644 Foxhaven Dr Unit 25 Richmond, KY | 2.0 | 1.5 | 1080 | $925 | $0.86 | 23d | 1 | 0.96mi |
| 204 S Robbins Ct Richmond, KY | 2.0 | 1.0 | 880 | $1,200 | $1.36 | 23d | 1 | 1.04mi |
| 101 Purcell Dr Unit B Richmond, KY | 2.0 | 1.0 | 1700 | $1,050 | $0.62 | 21d | 1 | 1.17mi |
| 2319 Lantern Ridge Dr Unit 3 Richmond, KY | 2.0 | 2.0 | 1121 | $1,450 | $1.29 | 23d | 1 | 1.26mi |
| 804 Melanie Ln Richmond, KY | 2.0 | 2.5 | 1200 | $1,250 | $1.04 | 44d | 1 | 1.41mi |
Listing history 18 events
-
2026-06-18days on market $135,000 Active 30 DOM
-
2026-06-18price $135,000 Active 29 DOM
-
2026-06-17days on market $138,000 Active 29 DOM
-
2026-06-16days on market $138,000 Active 28 DOM
-
2026-06-15days on market $138,000 Active 27 DOM
-
2026-06-14days on market $138,000 Active 25 DOM
-
2026-06-10days on market $138,000 Active 22 DOM
-
2026-06-09days on market $138,000 Active 21 DOM
-
2026-06-08days on market $138,000 Active 20 DOM
-
2026-06-07days on market $138,000 Active 19 DOM
-
2026-06-05days on market $138,000 Active 16 DOM
-
2026-06-03days on market $138,000 Active 15 DOM
-
2026-06-02days on market $138,000 Active 14 DOM
-
2026-06-01days on market $138,000 Active 13 DOM
-
2026-05-31days on market $138,000 Active 12 DOM
-
2026-05-31pricedays on market $138,000 Active 11 DOM
-
2026-05-19$160,000 Active
-
2019-10-24soldstatus $55,000
ⓘ Source: listings_history table (triggers on properties + properties_extension) + one-shot
backfill from property_details.listing_events for pre-trigger history.
Tax reassessment forecast KY · Resets to sale price
- Current annual tax
- $471 · $39/mo
- Projected year-2 tax
- $1,161 · $97/mo
- Expected delta
- +$690/yr (+$58/mo · 146.7%)
ⓘ Screening estimate from a state-policy table — verify with the county assessor before closing.
Climate risk First Street
- Flood 1/10 Low FEMA zone X (unshaded) · 0% chance over 30 yrs
- Wildfire 3/10 Moderate
- Heat 4/10 Moderate 7 d/yr ≥102°F today · 19 d/yr by 30 yrs out
- Wind 2/10 Low 4% chance of damaging wind over 30 yrs
- Air quality 1/10 Low 0 unhealthy d/yr today · 0 by 30 yrs out
Nearby sold comps map
Loading sold comps map…
Walkable amenities ~0.75 mi
Loading nearby amenities…
Taxation est. · year 1
- Rental income
- $17,193
- − Mortgage interest
- −$7,562
- − Property taxes
- −$471
- − Insurance
- −$675
- − Repairs & maintenance
- −$1,375
- − Management
- −$1,375
- − Depreciation
- −$3,927
- Taxable income
- $1,808
- Est. tax owed @ 24.0%
- −$434
- After-tax cash flow
- $3,508/yr
For passive investors: Depreciation is non-cash, so a rental often shows a tax loss while cash-flowing — sheltering income. Rental losses are passive: they offset passive income freely, and up to $25,000/yr can offset ordinary (W-2) income if you actively participate and your MAGI is under $100k (phasing out to $0 by $150k); unused losses carry forward. On sale, claimed depreciation is recaptured at up to 25%, and gains may owe capital-gains tax (a 1031 exchange can defer both). Figures are a year-1 estimate at your 24.0% rate — not tax advice; consult a CPA.
Schools (NCES district)
- District
- Madison County
- NCES district ID
- 2103720
- Math proficiency
- 31% ▼ -16.00%
- Reading proficiency
- 47% ▼ -14.00%
- Median HH income
- $43,590
- Composite
- 32.99/100
- National rank
- #5580
- State rank
- #35 of 165 in KY
Livability — Richmond
- Score
- 69/100
- State rank
- #163
- US rank
- #8196
Category grades
Schools grade is shown separately in the Schools card above.
Census & demographics
- Census place
- Richmond, KY
- County
- Madison County · 93,568 people
- City population
- 65,961
- Metro
- Richmond-Berea, KY
- Population (ZIP)
- 65,961
- Household income
- $63,050
- Rent vs Own
- Severe rent burden
- 2031.0
Population outlook (Madison County) Hauer SSP2
- Today (2025)
- 99,241 people
- By 2030
- 104,927 · +5.7%
- By 2040
- 116,079 · +17.0%
- By 2050
- 127,293 · +28.3%
- By 2075
- 155,644 · +56.8%
- By 2100
- 176,488 · +77.8%
Race, ethnicity, and origin ACS 2023
- Neighborhood character
- Predominantly White (87%)
- Race & ethnicity
- White 87% Two or more races 5% Black 4% Hispanic / Latino 3%
- Common ancestry
- Slovak 2% Italian 2% Serbian 1%
- Foreign-born
- 3% · Canada
- Languages at home
- 96% English-only · Spanish 3%
Political lean MEDSL · Madison
- 2024 margin
- Solid R (+30.9) · D 33.6% · R 64.5% · Other 1.9%
- 2008→2024 swing
- -8.4pp toward R · 2008: -22.4pp · 2024: -30.9pp
- All cycles
- 2024: R+30.9 2020: R+26.8 2016: R+31.2 2012: R+28.9 2008: R+22.4
Not yet ingested
- Civics
- —
Market trends
- HPI YoY
- ▼ -72.04%
- Current HPI
- 245.8489
- Rent YoY
- ▲ 2.82%
- Metro
- Richmond-Berea, KY
- State GDP YoY
- ▲ 1.81%
- F500 in state
- 4
Industry mix (Fortune 500 HQ in KY)
| Industry | F500 HQs | Revenue |
|---|---|---|
| Healthcare | 1 | $118B |
|
||
| Food / Beverage | 1 | $7B |
|
||
Price history
+190.9% since first listed2 events — show timeline
- 2026-05-19 Listed $160,000 ImagineMLS
- 2019-10-24 Sold (Public Records) $55,000 Public Records
Property tax history
-0.1%/yrLatest (2025): $471 · +213.8% YoY. Source: county tax records.
Cash-flow waterfall
monthlySold comps — $/sqft
last 12 mo · ≤1 miLoading sold comps…