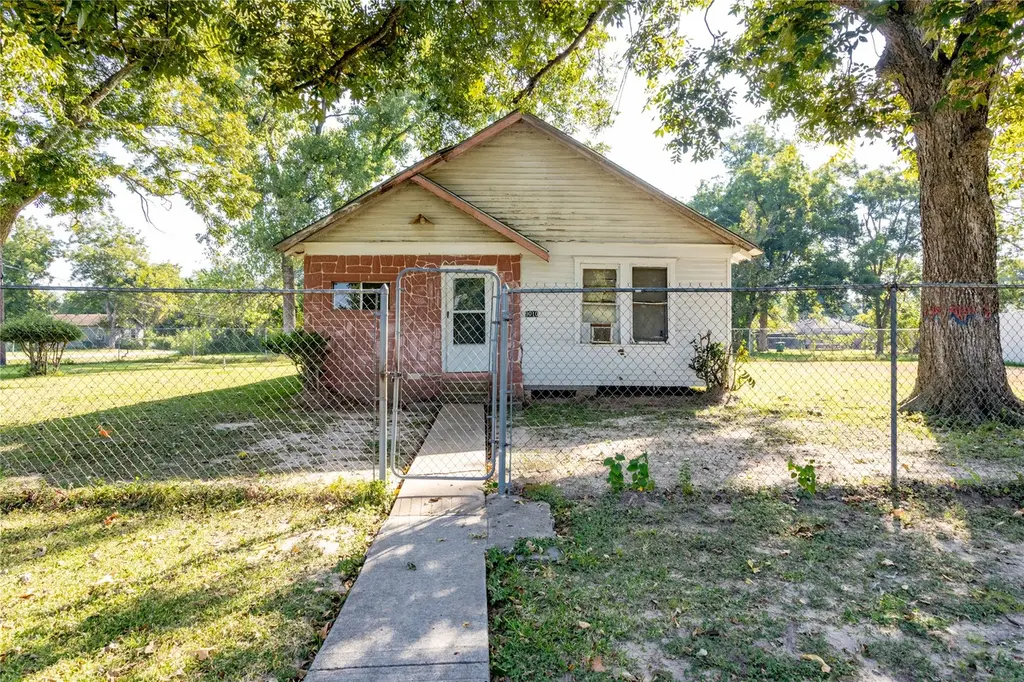
9010 Wheatley St · Houston, TX
Flood risk 1/10 · Minimal
- FEMA flood zone
- X (unshaded)
- Chance of flooding over 30 yrs
- 0.0%
- Est. flood insurance / yr
- $507 – $1,088
Fire risk 1/10 · Minimal
- Est. fire insurance / yr
- $1,222 – $2,270
Heat risk 9/10 · Severe
- Hot days now (above 109°F)
- 6 days/yr
- Hot days in 30 yrs
- 21 days/yr
Wind risk 9/10 · Severe
- Chance of severe wind over 30 yrs
- 99.0%
Air-quality risk 3/10 · Minor
- Unhealthy air days now
- 3 days/yr
- Unhealthy air days in 30 yrs
- 4 days/yr
Risk factors via First Street. Map © Google.
Why this score? — see what drove the B grade
The composite is a weighted blend of 9 inputs, each scored 0–100. Each bar is that input's sub-score; the figure is the points it added to the 100-point composite (weight × sub-score).
- Cash flow +29.4/30.0
- ARV discount +15.0/15.0
- DSCR +10.0/10.0
- 1% rule +8.2/10.0
- Livability +3.7/5.0
- Condition / age +2.5/5.0
- Rent growth +2.2/5.0
- Schools +1.5/10.0
- Appreciation +0.0/10.0
$145,000
🖨 Deal sheet 📄 Offer letter ✓ Due diligence
Listing remarks MLS
Sold for lot value. Great opportunity to fix up or develop and build. No showings of the house.
Key facts
- 0.23 acre lot
- Built 1940
- Listed 27 days
Neighborhood map
What this means for you Summary
Snapshot
- This is a 3-bed/1.0-bath single-family listed at $145k.
Deal economics
- At list price, monthly cash flow is $515 ($6k/yr) — positive.
- The deal already cash-flows at list — no discount required.
- Meets the 1% rule at list price ($2k rent vs $145k).
- Recommended offer: $143k (1.5% below list) — sets the bar for market timing.
- Cap rate 10.6% vs local median 3.2% in Houston — top-decile yield for the area; either an underpriced asset or a hidden risk that comps aren't pricing in. Stress-test before assuming the spread holds.
Location & tenants
- Location reads 74/100 on livability (#184 in TX, #4,771 nationally) — a middle-class / working-renter tenant base. Strengths: amenities A+, cost of living A+, housing A+; Watch: schools D, crime F.
- Aldine ISD (suburban): math 16% / reading 21% proficiency, ranked #790 of 826 in TX (top 96%) — low school quality limits family demand, transient renter base, plan for 1-2y turnover; 79% free/reduced lunch — lower-income household profile, screen leases tightly.
- Market conditions: Rents soft (-1.0%/yr); 468 active listings in the ZIP; 27 comparable units currently listed for rent nearby; rentals lingering (median 44d on market — plan ~5-8 weeks vacancy on turnover, expect pricing pressure); 52% of comp listings sitting > 30 days — soft ceiling on asking rent; 29,883 units permitted in Harris County in 2024 (8,621 in 5+ unit buildings).
- This rent runs 42% of the median local income ($54k/yr) — at the standard rent-burdened threshold; future hikes will face affordability resistance.
Forward outlook
- Local home prices are declining (-3.0%/yr); year-one equity from $1k of loan paydown is wiped out by about $4k of value loss. Plan a longer hold.
- Harris County population projected at +47% by 2050 — long-run rental-demand tailwind backs the buy-and-hold thesis.
Negotiation context
- It's been on market 27 days — a 2% lower offer ($143k) is reasonable based on typical stale-listing flexibility.
- 4 sale attempts with the ask held roughly flat each time — persistent listings suggest the price (not the market) is what's stuck; bring a comps-based counter.
Risks & watch-outs
- Watch-outs: built in 1940 — expect roof / HVAC / electrical / plumbing capex.
- Climate carrying-cost: severe wind risk, 99% chance of damaging wind over 30y; extreme-heat days projected 6→21/yr by 2055 (HVAC capex compounding) — expect insurance premiums to compound above CPI over the hold.
Questions for the listing agent
- Built in 1940 — when were the roof, HVAC, electrical panel, plumbing, and water heater last replaced?
- Is there a deadline driving the sale (1031 exchange, divorce, estate, relocation)? That informs how much negotiation room exists.
- Schools are D-rated, which usually means shorter tenancies and higher turnover. Who's the typical renter profile here, and what's been the actual vacancy rate?
- Crime grade is F in this area — have there been break-ins, vandalism, or insurance claims at this property in the last 3 years? What carrier currently insures it and at what premium?
- What's the average days-on-market for RENTAL listings here right now (not sales)? A rising rental-DOM trend means longer vacancies and softer asking-rent achievability than the comps imply.
- What's the recent tenant-quality profile in this submarket — average credit score on applications, eviction rate, late-payment / NSF rate, and stable-employment percentage? A property-management company in the area should have these aggregated.
- How much new for-sale + rental construction is in the pipeline within 1–3 miles? Heavy new supply typically softens prices + rents 12–24 months out; constrained supply supports both.
Investment metrics
- 1% rule
- 1.32% ✓
- Cap rate
- 10.56%
- Cash-on-cash
- 15.23%
- DSCR
- 1.68
- GRM
- 6.3
CMA / ARV
- ARV (median comp)
- $198,292
- List price
- $145,000
- Delta
- -26.88%
- Verdict
- UNDERPRICED
- Comps
- 20 within 1.0 mi
Show comp detail 12 sales within ~0.75 mi
| Address | Dist | Beds/Ba | Sqft | Sold | Price | $/sf | Match |
|---|---|---|---|---|---|---|---|
| 1559 Diplomat Way | 0.17mi | 4/1.5 (+1) | 1,158 (-4%) | 5mo | $159,990 | $138 | 75 |
| 8615 Citation Ct | 0.27mi | 4/1.5 (+1) | 1,116 (-7%) | 3mo | $140,000 | $125 | 66 |
| 938 Ellington St | 0.43mi | 3/2.0 | 1,224 (+2%) | 9mo | $225,000 | $184 | 65 |
| 7921 Virgil St | 0.72mi | 3/2.0 | 1,197 (-0%) | 6mo | $225,000 | $188 | 57 |
| 1001 Reverend B J Lewis Dr | 0.53mi | 3/2.0 | 1,272 (+6%) | 9mo | $264,999 | $208 | 54 |
| 8401 Hanfro Ln | 0.44mi | 3/2.0 | 1,360 (+13%) | 1mo | $208,000 | $153 | 52 |
| 1710 Beaver Bend Rd | 0.70mi | 3/2.0 | 1,134 (-6%) | 2mo | $223,000 | $197 | 52 |
| 958 Conklin St | 0.44mi | 3/2.0 | 1,020 (-15%) | 3mo | $215,000 | $211 | 48 |
| 8602 De Priest St | 0.60mi | 3/2.0 | 1,080 (-10%) | 6mo | $115,000 | $106 | 46 |
| 1902 Bunzel St | 0.61mi | 3/2.0 | 1,030 (-14%) | 0mo | $198,000 | $192 | 44 |
| 1314 Tarberry Rd | 0.61mi | 3/1.5 | 1,022 (-15%) | 5mo | $143,999 | $141 | 41 |
| 8914 De Priest St | 0.55mi | 3/2.0 | 1,020 (-15%) | 8mo | $150,000 | $147 | 38 |
Match score weights: distance 35% · size 25% · config 20% · recency 20%. Top-matched comps best support the ARV.
Projected returns pro-forma
-3.0% appreciation · 0.0% rent growth · sell at horizon
- IRR
- 2.5%
- Equity multiple
- 1.09×
- Total profit
- $3,733
- Equity at exit
- $21,620
- IRR
- 8.9%
- Equity multiple
- 1.59×
- Total profit
- $23,941
- Equity at exit
- $12,537
Cash invested: $40,600 (down + closing). Projections, not guarantees.
Landlord ↔ Tenant lean methodology
- Overall (STATE)
- 87 Strongly Landlord-Friendly
- State Texas
- 87 Strongly Landlord-Friendly · R+5
- County
- — inherits STATE
- City
- — inherits STATE
ZIP-level market 77088
- Home prices YoY
- -23.2%
- Rents YoY
- -1.0%
- Active inventory
- 468
- Price-to-rent
- 6.3×
Monthly cashflow live
- Estimated rent
- $1,912 high interval (Pro) →
- Mortgage (P&I)
- −$760
- Tax from tax record
- −$175 /mo · $2,098/yr
- Insurance
- −$60
- HOA
- −$0
- Vacancy / Maint / Mgmt
- −$402
- Net cashflow
- $515
Break-even live
UW: 25.0% down · 7.5% · 30yr · 1.5% tax · 5.0% vac · 8.0% maint · 8.0% mgmt
Financing live
Cash to close
- Down payment
- $36,250
- Closing costs
- $4,350
- Reserves months
- —
- Total cash needed
- —
Loan-product check · same deal, 3 products live
Conventional
25% down · 7.5% · 30yr
- Down + closing
- —
- Monthly P&I
- —
- Monthly cashflow
- —
- DSCR
- —
- Eligible?
- —
Personal DTI + credit; lowest rate.
DSCR
20% down · 8.5% · 30yr
- Down + closing
- —
- Monthly P&I
- —
- Monthly cashflow
- —
- DSCR
- —
- Eligible?
- —
No personal income docs; deal must DSCR.
Hard money
10% down · 12.0% · 12mo
- Down + closing
- —
- Monthly P&I
- —
- Monthly cashflow
- —
- DSCR
- —
- Eligible?
- —
Short-term bridge; refi at stabilization.
Rent comps 27 comps
| Address | Beds | Baths | Sqft | Rent | $/sqft | DOM | Units | Dist |
|---|---|---|---|---|---|---|---|---|
| 1450 Dewalt St Houston, TX | 3.0 | 2.5 | 1371 | $2,500 | $1.82 | 43d | 1 | 0.35mi |
| 1464 Ferguson Way Houston, TX | 2.0 | 3.0 | 850 | $1,850 | $2.18 | 43d | 1 | 0.44mi |
| 1438 Peach Spring Dr Houston, TX | 4.0 | 1.5 | 1288 | $1,599 | $1.24 | 1d | 1 | 0.53mi |
| 929 Marjorie St Unit 1060806P Houston, TX | 3.0 | 2.0 | 1076 | $3,091 | $2.87 | 7d | 1 | 0.65mi |
| 1010 Junell St Unit A Houston, TX | 3.0 | 2.0 | 1040 | $1,550 | $1.49 | 24d | 1 | 0.69mi |
| 8312 De Priest St Unit B Houston, TX | 3.0 | 3.5 | 1500 | $1,900 | $1.27 | 20d | 1 | 0.71mi |
| 8312 De Priest St Unit A Houston, TX | 3.0 | 2.5 | 1500 | $1,900 | $1.27 | 20d | 1 | 0.71mi |
| 8310 De Priest St Unit B Houston, TX | 3.0 | 2.5 | 1500 | $1,900 | $1.27 | 20d | 1 | 0.72mi |
| 8306 De Priest St Unit A Houston, TX | 3.0 | 2.5 | 1500 | $1,900 | $1.27 | 20d | 1 | 0.72mi |
| 8122 De Priest St Unit A Houston, TX | 3.0 | 3.5 | 1500 | $1,900 | $1.27 | 43d | 1 | 0.74mi |
| 8120 De Priest St Unit A Houston, TX | 3.0 | 2.5 | 1500 | $1,750 | $1.17 | 43d | 1 | 0.74mi |
| 8120 De Priest St Unit B Houston, TX | 3.0 | 2.5 | 1500 | $1,900 | $1.27 | 43d | 1 | 0.74mi |
| 8118 De Priest St Unit B Houston, TX | 3.0 | 2.5 | 1500 | $1,900 | $1.27 | 43d | 1 | 0.74mi |
| 8112 De Priest St Unit B Houston, TX | 3.0 | 2.5 | 1500 | $1,900 | $1.27 | 43d | 1 | 0.76mi |
| 8110 De Priest St Unit A Houston, TX | 3.0 | 2.5 | 1500 | $1,900 | $1.27 | 43d | 1 | 0.76mi |
| 8108 De Priest St Unit B Houston, TX | 3.0 | 2.5 | 1500 | $1,900 | $1.27 | 43d | 1 | 0.76mi |
| 2320 Wavell St Unit A Houston, TX | 3.0 | 2.5 | 1150 | $1,900 | $1.65 | 43d | 1 | 1.01mi |
| 2320 Wavell St Unit B Houston, TX | 3.0 | 2.5 | 1150 | $1,683 | $1.46 | 43d | 1 | 1.01mi |
| 783 Fortune St Unit A Houston, TX | 3.0 | 2.5 | 1328 | $1,795 | $1.35 | 16d | 1 | 1.05mi |
| 2407 Ferguson Way Houston, TX | 3.0 | 2.5 | 1195 | $1,650 | $1.38 | 43d | 1 | 1.08mi |
| 7903 Moon Beam St Houston, TX | 3.0 | 2.5 | 1217 | $1,700 | $1.40 | 16d | 1 | 1.31mi |
| 2722 Stallings Dr Houston, TX | 3.0 | 2.0 | 1298 | $1,635 | $1.26 | 5d | 1 | 1.38mi |
| 8101 Venus St Unit B Houston, TX | 3.0 | 2.0 | 1375 | $1,595 | $1.16 | 24d | 1 | 1.38mi |
| 8101 Venus St Unit A Houston, TX | 3.0 | 2.0 | 1375 | $1,699 | $1.24 | 24d | 1 | 1.38mi |
| 7486 N Shepherd Dr Houston, TX | 3.0 | 2.0 | 1177 | $1,290 | $1.10 | 43d | 1 | 1.42mi |
| 2850 W Gulf Bank Rd Houston, TX | 1.0–4.0 | 1.0–2.0 | 1055 | $1,413 | $1.34 | 1d | 107 | 1.47mi |
| 1825 W Little York Rd Houston, TX | 2.0 | 1.0 | 787 | $880 | $1.12 | 43d | 1 | 1.50mi |
Listing history 24 events
-
2026-06-18days on market $145,000 Active 27 DOM
-
2026-06-17days on market $145,000 Active 26 DOM
-
2026-06-16days on market $145,000 Active 25 DOM
-
2026-06-15days on market $145,000 Active 24 DOM
-
2026-06-13days on market $145,000 Active 22 DOM
-
2026-06-13days on market $145,000 Active 21 DOM
-
2026-06-09days on market $145,000 Active 18 DOM
-
2026-06-08days on market $145,000 Active 17 DOM
-
2026-06-07days on market $145,000 Active 16 DOM
-
2026-06-04days on market $145,000 Active 13 DOM
-
2026-06-03days on market $145,000 Active 12 DOM
-
2026-06-02days on market $145,000 Active 11 DOM
-
2026-06-01days on market $145,000 Active 10 DOM
-
2026-05-31days on market $145,000 Active 9 DOM
-
2026-04-27status Active 97-char remark
Show marketing remark (97 chars)
Sold for lot value. Great opportunity to fix up or develop and build. No showings of the house.
-
2026-04-22status Pending 97-char remark
Show marketing remark (97 chars)
Sold for lot value. Great opportunity to fix up or develop and build. No showings of the house.
-
2026-03-13$145,000 Active 97-char remark
Show marketing remark (97 chars)
Sold for lot value. Great opportunity to fix up or develop and build. No showings of the house.
-
2026-03-11status Active
-
2026-03-11price $145,000
-
2026-02-23historical
-
2025-10-31status Pending
-
2025-10-22status Pending
-
2025-10-08$135,000 Active
-
1988-01-02soldstatus
ⓘ Source: listings_history table (triggers on properties + properties_extension) + one-shot
backfill from property_details.listing_events for pre-trigger history.
Tax reassessment forecast TX · Resets to sale price
- Current annual tax
- $2,098 · $175/mo
- Projected year-2 tax
- $2,654 · $221/mo
- Expected delta
- +$556/yr (+$46/mo · 26.5%)
ⓘ Screening estimate from a state-policy table — verify with the county assessor before closing.
Climate risk First Street
- Flood 1/10 Low FEMA zone X (unshaded) · 0% chance over 30 yrs
- Wildfire 1/10 Low
- Heat 9/10 Extreme 6 d/yr ≥109°F today · 21 d/yr by 30 yrs out
- Wind 9/10 Extreme 99% chance of damaging wind over 30 yrs
- Air quality 3/10 Moderate 3 unhealthy d/yr today · 4 by 30 yrs out
Nearby sold comps map
Loading sold comps map…
Walkable amenities ~0.75 mi
Loading nearby amenities…
Taxation est. · year 1
- Rental income
- $22,948
- − Mortgage interest
- −$8,122
- − Property taxes
- −$2,098
- − Insurance
- −$725
- − Repairs & maintenance
- −$1,836
- − Management
- −$1,836
- − Depreciation
- −$4,218
- Taxable income
- $4,113
- Est. tax owed @ 24.0%
- −$987
- After-tax cash flow
- $5,194/yr
For passive investors: Depreciation is non-cash, so a rental often shows a tax loss while cash-flowing — sheltering income. Rental losses are passive: they offset passive income freely, and up to $25,000/yr can offset ordinary (W-2) income if you actively participate and your MAGI is under $100k (phasing out to $0 by $150k); unused losses carry forward. On sale, claimed depreciation is recaptured at up to 25%, and gains may owe capital-gains tax (a 1031 exchange can defer both). Figures are a year-1 estimate at your 24.0% rate — not tax advice; consult a CPA.
Schools (NCES district)
- District
- Aldine ISD
- NCES district ID
- 4807710
- Math proficiency
- 16% ▼ -23.00%
- Reading proficiency
- 21% ▼ -11.00%
- Median HH income
- $37,081
- Composite
- 15.42/100
- National rank
- #9317
- State rank
- #790 of 826 in TX
Livability — Houston
- Score
- 74/100
- State rank
- #184
- US rank
- #4771
Category grades
Schools grade is shown separately in the Schools card above.
Census & demographics
- Census place
- Houston, TX
- County
- Harris County · 4,702,590 people
- City population
- 3,226,434
- Metro
- Houston-The Woodlands-Sugar Land, TX
- Population (ZIP)
- 57,047
- Household income
- $54,411
- Rent vs Own
- Severe rent burden
- 2294.0
Population outlook (Harris County) Hauer SSP2
- Today (2025)
- 5,571,493 people
- By 2030
- 6,089,821 · +9.3%
- By 2040
- 7,142,806 · +28.2%
- By 2050
- 8,185,864 · +46.9%
- By 2075
- 10,574,329 · +89.8%
- By 2100
- 12,109,958 · +117.4%
Race, ethnicity, and origin ACS 2023
- Neighborhood character
- Diverse neighborhood (Simpson 0.59)
- Race & ethnicity
- Hispanic / Latino 52% Black 37% Two or more races 18% White 6% Asian 4%
- Hispanic origin (detail)
- Mexican 36%
- Common ancestry
- Lithuanian 1%
- Foreign-born
- 25% · Canada, Vietnam, China
- Languages at home
- 49% English-only · Spanish 47% Vietnamese 3%
Political lean MEDSL · Harris
- 2024 margin
- Lean D (+5.5) · D 52.0% · R 46.4% · Other 1.6%
- 2008→2024 swing
- +3.9pp toward D · 2008: 1.6pp · 2024: 5.5pp
- All cycles
- 2024: D+5.5 2020: D+13.3 2016: D+12.4 2012: D+0.1 2008: D+1.6
Not yet ingested
- Civics
- —
Market trends
- HPI YoY
- ▼ -98.37%
- Current HPI
- 325.0499
- Rent YoY
- ▼ -1.01%
- Metro
- Houston-The Woodlands-Sugar Land, TX
- State GDP YoY
- ▲ 3.95%
- F500 in state
- 110
Industry mix (Fortune 500 HQ in TX)
| Industry | F500 HQs | Revenue |
|---|---|---|
| Energy | 16 | $1,198B |
|
||
| Technology | 5 | $198B |
|
||
| Engineering / Construction | 4 | $72B |
|
||
| Energy Services | 3 | $60B |
|
||
| Utilities | 3 | $41B |
|
||
| Healthcare | 2 | $330B |
|
||
Price history
+7.4% since first listed10 events — show timeline
- 2026-04-27 Relisted — HARMLS
- 2026-04-22 Pending — HARMLS
- 2026-03-13 Listed $145,000 HARMLS
- 2026-03-11 Relisted — HARMLS
- 2026-03-11 Price Changed $145,000 HARMLS
- 2026-02-23 Listing Removed — HARMLS
- 2025-10-31 Pending — HARMLS
- 2025-10-22 Pending — HARMLS
- 2025-10-08 Listed $135,000 HARMLS
- 1988-01-02 Sold (Public Records) — Public Records
Property tax history
+9.8%/yrLatest (2025): $2,098 · +21.0% YoY. Source: county tax records.
Cash-flow waterfall
monthlySold comps — $/sqft
last 12 mo · ≤1 miLoading sold comps…