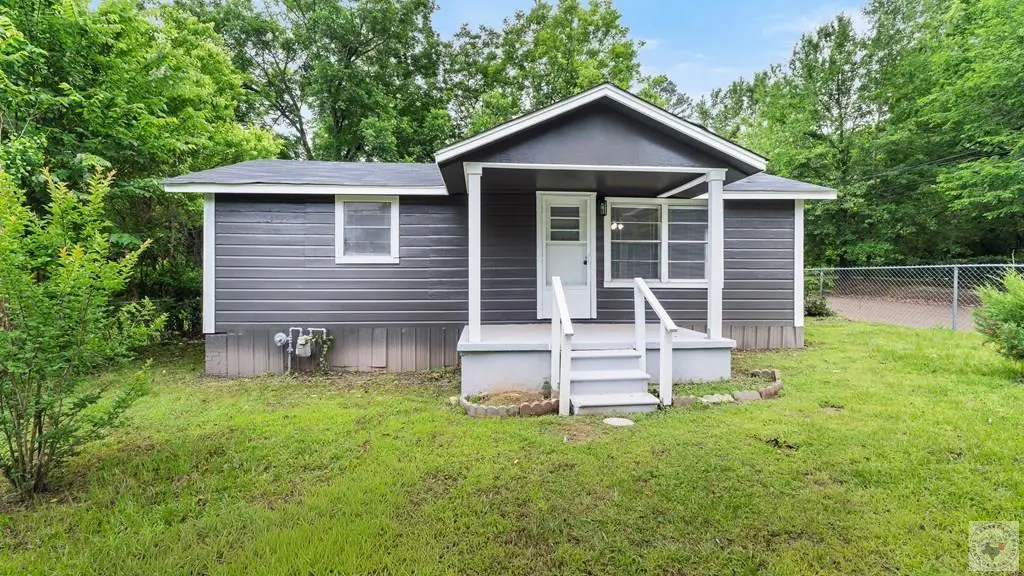
802 Ida · Texarkana, AR
Flood risk 1/10 · Minimal
- FEMA flood zone
- X (unshaded)
- Chance of flooding over 30 yrs
- 0.0%
- Est. flood insurance / yr
- $507 – $1,088
Fire risk 4/10 · Minor
- Est. fire insurance / yr
- $1,499 – $2,785
Heat risk 6/10 · Moderate
- Hot days now (above 112°F)
- 7 days/yr
- Hot days in 30 yrs
- 22 days/yr
Wind risk 5/10 · Moderate
- Chance of severe wind over 30 yrs
- 26.0%
Air-quality risk 2/10 · Minimal
- Unhealthy air days now
- 0 days/yr
- Unhealthy air days in 30 yrs
- 1 days/yr
Risk factors via First Street. Map © Google.
Why this score? — see what drove the C- grade
The composite is a weighted blend of 9 inputs, each scored 0–100. Each bar is that input's sub-score; the figure is the points it added to the 100-point composite (weight × sub-score).
- Cash flow +26.9/30.0
- DSCR +9.3/10.0
- 1% rule +7.2/10.0
- Livability +3.2/5.0
- Rent growth +2.5/5.0
- Condition / age +2.5/5.0
- Schools +2.1/10.0
- ARV discount +1.1/15.0
- Appreciation +0.0/10.0
$90,000
🖨 Deal sheet 📄 Offer letter ✓ Due diligence
Listing remarks
Welcome home to this beautifully updated 2-bedroom, 1-bath property featuring a versatile bonus room that can serve as a third bedroom, home office, playroom, or game room. Fresh interior updates create a bright, modern atmosphere, making this home truly move-in ready. The functional floor plan offers comfortable living spaces with flexibility to fit your lifestyle. Whether you're a first-time homebuyer, looking to downsize, or searching for a smart investment opportunity, this charming home is one you won't want to miss.
Key facts
- Bonus room
- Move in ready
- 5,662 sq ft lot
Tags
Neighborhood map
What this means for you Summary
Snapshot
- This is a 2-bed/1.0-bath single-family listed at $90k.
Deal economics
- At list price, monthly cash flow is $248 ($3k/yr) — positive.
- The deal already cash-flows at list — no discount required.
- Meets the 1% rule at list price ($1k rent vs $90k).
- Recommended offer: $89k (1.5% below list) — sets the bar for market timing.
- Cap rate 9.6% vs local median 4.5% in Texarkana — top-decile yield for the area; either an underpriced asset or a hidden risk that comps aren't pricing in. Stress-test before assuming the spread holds.
Location & tenants
- Location reads 64/100 on livability (#177 in AR) — a middle-class / working-renter tenant base. Strengths: cost of living A+, housing A+, health & safety A-; Watch: schools D, crime F, amenities F.
- Texarkana School District (suburban): math 27% / reading 24% proficiency, ranked #181 of 238 in AR (top 76%) — low school quality limits family demand, transient renter base, plan for 1-2y turnover; 64% free/reduced lunch — lower-income household profile, screen leases tightly.
- Market conditions: 273 active listings in the ZIP; 2 comparable units currently listed for rent nearby; 21 units permitted in Miller County in 2024 (0 in 5+ unit buildings).
Forward outlook
- Local home prices are declining (-3.0%/yr); year-one equity from $622 of loan paydown is wiped out by about $3k of value loss. Plan a longer hold.
- Miller County population projected to shrink 7% by 2050 — rents likely to lag national; underwrite the cash flow, not the appreciation.
- At projected returns (-3.0% appreciation + 3.0% rent growth), your $25k cash investment doubles in ~10 years — after that, you're playing with house money.
Negotiation context
- It's been on market 18 days — a 2% lower offer ($89k) is reasonable based on typical stale-listing flexibility.
Risks & watch-outs
- Climate carrying-cost: moderate wind risk, 26% chance of damaging wind over 30y; extreme-heat days projected 7→22/yr by 2055 (HVAC capex compounding) — expect insurance premiums to compound above CPI over the hold.
Questions for the listing agent
- Built in 1960 — when were the roof, HVAC, electrical panel, plumbing, and water heater last replaced?
- Is there a deadline driving the sale (1031 exchange, divorce, estate, relocation)? That informs how much negotiation room exists.
- Schools are D-rated, which usually means shorter tenancies and higher turnover. Who's the typical renter profile here, and what's been the actual vacancy rate?
- Crime grade is F in this area — have there been break-ins, vandalism, or insurance claims at this property in the last 3 years? What carrier currently insures it and at what premium?
- What's the average days-on-market for RENTAL listings here right now (not sales)? A rising rental-DOM trend means longer vacancies and softer asking-rent achievability than the comps imply.
- What's the recent tenant-quality profile in this submarket — average credit score on applications, eviction rate, late-payment / NSF rate, and stable-employment percentage? A property-management company in the area should have these aggregated.
- How much new for-sale + rental construction is in the pipeline within 1–3 miles? Heavy new supply typically softens prices + rents 12–24 months out; constrained supply supports both.
Investment metrics
- 1% rule
- 1.22% ✓
- Cap rate
- 9.60%
- Cash-on-cash
- 11.82%
- DSCR
- 1.53
- GRM
- 6.8
CMA / ARV
- ARV (median comp)
- $78,784
- List price
- $90,000
- Delta
- 1.54%
- Verdict
- FAIR
- Comps
- 4 within 2.0 mi
Projected returns pro-forma
-3.0% appreciation · 3.0% rent growth · sell at horizon
- IRR
- 1.3%
- Equity multiple
- 1.05×
- Total profit
- $1,244
- Equity at exit
- $13,419
- IRR
- 10.9%
- Equity multiple
- 1.85×
- Total profit
- $21,511
- Equity at exit
- $7,782
Cash invested: $25,200 (down + closing). Projections, not guarantees.
Landlord ↔ Tenant lean methodology
- Overall (STATE)
- 92 Strongly Landlord-Friendly
- State Arkansas
- 92 Strongly Landlord-Friendly · R+14
- County
- — inherits STATE
- City
- — inherits STATE
ZIP-level market 71854
- Home prices YoY
- -16.9%
- Active inventory
- 273
- Price-to-rent
- 6.8×
Monthly cashflow live
- Estimated rent
- $1,102 medium interval (Pro) →
- Mortgage (P&I)
- −$472
- Tax est. 1.5%
- −$112 /mo · $1,350/yr
- Insurance
- −$38
- HOA
- −$0
- Vacancy / Maint / Mgmt
- −$231
- Net cashflow
- $248
Break-even live
UW: 25.0% down · 7.5% · 30yr · 1.5% tax · 5.0% vac · 8.0% maint · 8.0% mgmt
Financing live
Cash to close
- Down payment
- $22,500
- Closing costs
- $2,700
- Reserves months
- —
- Total cash needed
- —
Loan-product check · same deal, 3 products live
Conventional
25% down · 7.5% · 30yr
- Down + closing
- —
- Monthly P&I
- —
- Monthly cashflow
- —
- DSCR
- —
- Eligible?
- —
Personal DTI + credit; lowest rate.
DSCR
20% down · 8.5% · 30yr
- Down + closing
- —
- Monthly P&I
- —
- Monthly cashflow
- —
- DSCR
- —
- Eligible?
- —
No personal income docs; deal must DSCR.
Hard money
10% down · 12.0% · 12mo
- Down + closing
- —
- Monthly P&I
- —
- Monthly cashflow
- —
- DSCR
- —
- Eligible?
- —
Short-term bridge; refi at stabilization.
Rent comps 2 comps
| Address | Beds | Baths | Sqft | Rent | $/sqft | DOM | Units | Dist |
|---|---|---|---|---|---|---|---|---|
| 2403 Division St Texarkana, AR | 2.0 | 1.0 | 715 | $749 | $1.05 | 43d | 1 | 1.12mi |
| 519 Oak St Texarkana, TX | 1.0–2.0 | 1.0 | 612 | $895 | $1.46 | 43d | 4 | 1.28mi |
Listing history 20 events
-
2026-06-19days on market $90,000 Active 18 DOM
-
2026-06-18days on market $90,000 Active 17 DOM
-
2026-06-17days on market $90,000 Active 16 DOM
-
2026-06-16days on market $90,000 Active 15 DOM
-
2026-06-15days on market $90,000 Active 14 DOM
-
2026-06-14days on market $90,000 Active 12 DOM
-
2026-06-13days on market $90,000 Active 11 DOM
-
2026-06-10days on market $90,000 Active 9 DOM
-
2026-06-09days on market $90,000 Active 8 DOM
-
2026-06-08days on market $90,000 Active 7 DOM
-
2026-06-07days on market $90,000 Active 6 DOM
-
2026-06-05days on market $90,000 Active 3 DOM
-
2026-06-03days on market $90,000 Active 2 DOM
-
2026-06-02remarks 527-char remark
-
2026-06-02pricestatusdays on market $90,000 Active 1 DOM
-
2026-04-10price $80,000
-
2026-02-17price $85,000
-
2025-11-10soldstatus $110,000
-
2020-07-27soldstatus $40,000
-
1992-05-22soldstatus $6,000
ⓘ Source: listings_history table (triggers on properties + properties_extension) + one-shot
backfill from property_details.listing_events for pre-trigger history.
Climate risk First Street
- Flood 1/10 Low FEMA zone X (unshaded) · 0% chance over 30 yrs
- Wildfire 4/10 Moderate
- Heat 6/10 Major 7 d/yr ≥112°F today · 22 d/yr by 30 yrs out
- Wind 5/10 Major 26% chance of damaging wind over 30 yrs
- Air quality 2/10 Low 0 unhealthy d/yr today · 1 by 30 yrs out
Nearby sold comps map
Loading sold comps map…
Walkable amenities ~0.75 mi
Loading nearby amenities…
Taxation est. · year 1
- Rental income
- $13,219
- − Mortgage interest
- −$5,041
- − Property taxes
- −$1,350
- − Insurance
- −$450
- − Repairs & maintenance
- −$1,057
- − Management
- −$1,057
- − Depreciation
- −$2,618
- Taxable income
- $1,644
- Est. tax owed @ 24.0%
- −$395
- After-tax cash flow
- $2,584/yr
For passive investors: Depreciation is non-cash, so a rental often shows a tax loss while cash-flowing — sheltering income. Rental losses are passive: they offset passive income freely, and up to $25,000/yr can offset ordinary (W-2) income if you actively participate and your MAGI is under $100k (phasing out to $0 by $150k); unused losses carry forward. On sale, claimed depreciation is recaptured at up to 25%, and gains may owe capital-gains tax (a 1031 exchange can defer both). Figures are a year-1 estimate at your 24.0% rate — not tax advice; consult a CPA.
Schools (NCES district)
- District
- Texarkana School District
- NCES district ID
- 0513110
- Math proficiency
- 27% ▼ -12.00%
- Reading proficiency
- 24% ▼ -9.00%
- Median HH income
- $39,320
- Composite
- 21.47/100
- National rank
- #8332
- State rank
- #181 of 238 in AR
Livability — Texarkana
- Score
- 64/100
- State rank
- #177
- US rank
- #14514
Category grades
Schools grade is shown separately in the Schools card above.
Census & demographics
- Census place
- Texarkana, AR
- County
- Miller County · 35,720 people
- City population
- 35,720
- Metro
- Texarkana, TX-AR
- Population (ZIP)
- 35,720
- Household income
- $46,878
- Rent vs Own
- Severe rent burden
- 1388.0
Population outlook (Miller County) Hauer SSP2
- Today (2025)
- 44,197 people
- By 2030
- 43,844 · -0.8%
- By 2040
- 42,680 · -3.4%
- By 2050
- 41,024 · -7.2%
- By 2075
- 35,685 · -19.3%
- By 2100
- 28,325 · -35.9%
Race, ethnicity, and origin ACS 2023
- Neighborhood character
- Majority White (62%)
- Race & ethnicity
- White 62% Black 30% Hispanic / Latino 4% Two or more races 3%
- Common ancestry
- Lithuanian 1% Slovak 1%
- Foreign-born
- 2% · Canada
- Languages at home
- 98% English-only · Spanish 2%
Political lean MEDSL · Miller
- 2024 margin
- Solid R (+51.1) · D 23.9% · R 74.9% · Other 1.2%
- 2008→2024 swing
- -17.6pp toward R · 2008: -33.5pp · 2024: -51.1pp
- All cycles
- 2024: R+51.1 2020: R+46.4 2016: R+43.8 2012: R+39.8 2008: R+33.5
Not yet ingested
- Civics
- —
Market trends
- HPI YoY
- ▼ -40.00%
- Current HPI
- 196.7615
- Rent YoY
- —
- Metro
- Texarkana, TX-AR
- State GDP YoY
- ▲ 3.80%
- F500 in state
- 10
Industry mix (Fortune 500 HQ in AR)
| Industry | F500 HQs | Revenue |
|---|---|---|
| Retail | 1 | $681B |
|
||
| Food / Agriculture | 1 | $53B |
|
||
| Retail / Energy | 1 | $22B |
|
||
| Transportation / Logistics | 1 | $12B |
|
||
| Energy | 1 | $4B |
|
||
Price history
+1233.3% since first listed5 events — show timeline
- 2026-04-10 Price Changed $80,000 TBOR
- 2026-02-17 Price Changed $85,000 TBOR
- 2025-11-10 Sold (Public Records) $110,000 Public Records
- 2020-07-27 Sold (Public Records) $40,000 Public Records
- 1992-05-22 Sold (Public Records) $6,000 Public Records
Property tax history
-0.6%/yrLatest (2025): $178 · +10.0% YoY. Source: county tax records.
Cash-flow waterfall
monthlySold comps — $/sqft
last 12 mo · ≤1 miLoading sold comps…