 Fourplex
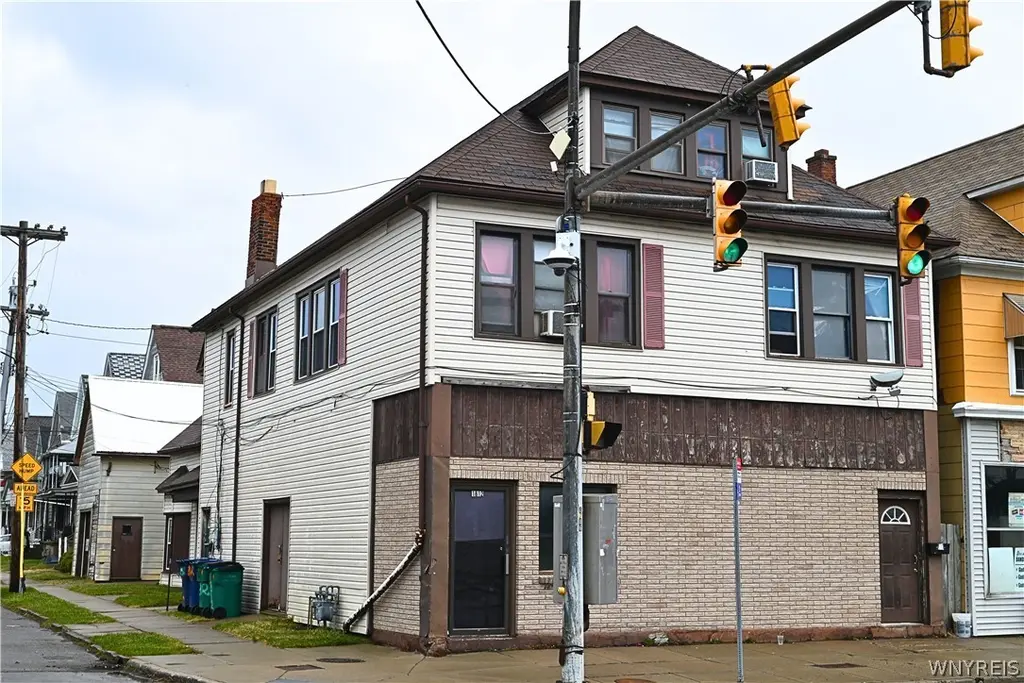
1812 Clinton St · Buffalo, NY
Flood risk No data
- FEMA flood zone
- —
- Chance of flooding over 30 yrs
- —
- Est. flood insurance / yr
- —
Fire risk No data
- Est. fire insurance / yr
- —
Heat risk No data
- Hot days now (above threshold)
- —
- Hot days in 30 yrs
- —
Wind risk No data
- Chance of severe wind over 30 yrs
- —
Air-quality risk No data
- Unhealthy air days now
- —
- Unhealthy air days in 30 yrs
- —
Risk factors via First Street. Map © Google.
Why this score? — see what drove the A grade
The composite is a weighted blend of 9 inputs, each scored 0–100. Each bar is that input's sub-score; the figure is the points it added to the 100-point composite (weight × sub-score).
- Cash flow +30.0/30.0
- ARV discount +15.0/15.0
- 1% rule +10.0/10.0
- DSCR +10.0/10.0
- Appreciation +9.0/10.0
- Livability +3.9/5.0
- Schools +3.3/10.0
- Rent growth +2.5/5.0
- Condition / age +2.5/5.0
$249,900
🖨 Deal sheet 📄 Offer letter ✓ Due diligence
Multi-family units
County records classify this as Multi-Family (2-4 Unit). Listing-text estimate: 4 units. confirmed
Listing remarks MLS
Versatile four unit investment property in the heart of Kaisertown with strong cash flows! The building features three residential apartments, garage with newer metal roof, and a large street-level retail or office space. Upper rear apartment is currently being remodeled and will be completed prior to closing. The commercial space is currently being used as storage but could be an amazing storefront with original pressed tin ceilings. Also being listed as commercial under ml 1662000. An excellent opportunity for investors, business owners, or owner-occupants. Property is offered individually or as part of a three property, seven unit package (see also ml#B1660523 and B1660521) with net income of almost 40k- income and expense report is available. Owner financing available for the package deal.
Key facts
- Newer metal roof
- 3,720 sq ft lot
- Garage
Tags
Neighborhood map
What this means for you Summary
Snapshot
- This is a 4 × 4-bed/3.0-bath units multifamily listed at $250k.
Deal economics
- At list price, monthly cash flow is $3k ($34k/yr) — positive. Per door: $708/mo.
- The deal already cash-flows at list — no discount required.
- Meets the 1% rule at list price ($6k rent vs $250k).
- Recommended offer: $220k (12.0% below list) — sets the bar for market timing.
- Cap rate 19.9% vs local median 8.0% in Buffalo — top-decile yield for the area; either an underpriced asset or a hidden risk that comps aren't pricing in. Stress-test before assuming the spread holds.
Location & tenants
- Location reads 77/100 on livability (#195 in NY, #3,011 nationally) — a middle-class / working-renter tenant base. Strengths: commute A+, housing A+, health & safety A+; Watch: crime F, employment D-.
- Buffalo City School District (urban): math 41% / reading 40% proficiency, ranked #535 of 590 in NY (top 91%) — families likely to look elsewhere, expect single-tenant / working-renter base with shorter leases; 75% free/reduced lunch — lower-income household profile, screen leases tightly.
- Market conditions: 169 active listings in the ZIP; 1,244 units permitted in Erie County in 2024 (563 in 5+ unit buildings).
- At $5,773/mo this rent would consume 137% of the median local household income ($50k/yr) (locally 841% of renters already pay >50% of income on rent) — very limited rent-growth headroom before tenants either downsize or default.
Forward outlook
- In year one you build about $22k of equity ($2k loan paydown + $20k appreciation (8.1% local appreciation)).
- At projected returns (8.1% appreciation + 3.0% rent growth), your $70k cash investment doubles in ~2 years — after that, you're playing with house money.
- By year 2, paydown + projected appreciation supports a ~$35k cash-out refi (75% LTV) — recoverable capital for the next deal without selling this one.
Negotiation context
- It's been on market 137 days — a 12% lower offer ($220k) is reasonable based on typical stale-listing flexibility.
- 3 sale attempts since 15y ago; this cycle's ask is 19123% above the opening price — seller raised mid-cycle; expect resistance to lowballs.
- Current owner paid $54k; list at $250k implies a 363% gain — meaningful room to come down on a strong offer.
Risks & watch-outs
- Watch-outs: built in 1920 — expect roof / HVAC / electrical / plumbing capex.
Questions for the listing agent
- It's been on market 137 days. Have you received any prior offers? Is the seller open to a 12% concession, seller financing, or rate buy-down credit?
- Can we see the unit-by-unit rent roll, current vacancy, and any below-market leases? What's the average tenancy length?
- What capital expenditures (roof, boiler, parking lot, exteriors) have been made in the last 5 years, and what's planned in the next 2?
- Built in 1920 — when were the roof, HVAC, electrical panel, plumbing, and water heater last replaced?
- Why hasn't it sold? Are there any deal-killer items the seller is aware of (foundation, flood, title, zoning, code violations)?
- Is there a deadline driving the sale (1031 exchange, divorce, estate, relocation)? That informs how much negotiation room exists.
- Crime grade is F in this area — have there been break-ins, vandalism, or insurance claims at this property in the last 3 years? What carrier currently insures it and at what premium?
- What's the average days-on-market for RENTAL listings here right now (not sales)? A rising rental-DOM trend means longer vacancies and softer asking-rent achievability than the comps imply.
- What's the recent tenant-quality profile in this submarket — average credit score on applications, eviction rate, late-payment / NSF rate, and stable-employment percentage? A property-management company in the area should have these aggregated.
- How much new apartment / multifamily construction is in the pipeline within 1–3 miles? Heavy new supply (>2% of stock underway) typically softens rents 12–24 months out; light construction supports rent growth.
Investment metrics
- 1% rule
- 2.31% ✓
- Cap rate
- 19.90%
- Cash-on-cash
- 48.60%
- DSCR
- 3.16
- GRM
- 3.6
CMA / ARV
- ARV (median comp)
- $443,047
- List price
- $249,900
- Delta
- -43.60%
- Verdict
- UNDERPRICED
- Comps
- 3 within 1.0 mi
Projected returns pro-forma
8.06% appreciation · 3.0% rent growth · sell at horizon
- IRR
- 60.0%
- Equity multiple
- 5.07×
- Total profit
- $284,443
- Equity at exit
- $190,849
- IRR
- 55.2%
- Equity multiple
- 10.88×
- Total profit
- $691,406
- Equity at exit
- $379,784
Cash invested: $69,972 (down + closing). Projections, not guarantees.
Landlord ↔ Tenant lean methodology
- Overall (STATE)
- 15 Strongly Tenant-Friendly
- State New York
- 15 Strongly Tenant-Friendly · D+10
- County
- — inherits STATE
- City
- — inherits STATE
ZIP-level market 14206
- Home prices YoY
- 1.8%
- Active inventory
- 169
- Price-to-rent
- 14.4×
Monthly cashflow live
- Estimated rent
- $5,773 high interval (Pro) →
- Mortgage (P&I)
- −$1,311
- Tax est. 1.5%
- −$312 /mo · $3,748/yr
- Insurance
- −$104
- HOA
- −$0
- Vacancy / Maint / Mgmt
- −$1,212
- Net cashflow
- $2,834
Break-even live
4-unit breakdown (identical units grouped — click to expand)
| Units | Beds | Baths | Est. rent |
|---|---|---|---|
| 4× units | 4 | 3 | $5,772 |
| #1 | 4 | 3 | $1,443 |
| #2 | 4 | 3 | $1,443 |
| #3 | 4 | 3 | $1,443 |
| #4 | 4 | 3 | $1,443 |
| Total (4 units) | $5,773 | ||
UW: 25.0% down · 7.5% · 30yr · 1.5% tax · 5.0% vac · 8.0% maint · 8.0% mgmt
Financing live
Cash to close
- Down payment
- $62,475
- Closing costs
- $7,497
- Reserves months
- —
- Total cash needed
- —
Loan-product check · same deal, 3 products live
Conventional
25% down · 7.5% · 30yr
- Down + closing
- —
- Monthly P&I
- —
- Monthly cashflow
- —
- DSCR
- —
- Eligible?
- —
Personal DTI + credit; lowest rate.
DSCR
20% down · 8.5% · 30yr
- Down + closing
- —
- Monthly P&I
- —
- Monthly cashflow
- —
- DSCR
- —
- Eligible?
- —
No personal income docs; deal must DSCR.
Hard money
10% down · 12.0% · 12mo
- Down + closing
- —
- Monthly P&I
- —
- Monthly cashflow
- —
- DSCR
- —
- Eligible?
- —
Short-term bridge; refi at stabilization.
Listing history 19 events
-
2026-06-18days on market $249,900 Active 137 DOM
-
2026-06-17days on market $249,900 Active 136 DOM
-
2026-06-16days on market $249,900 Active 135 DOM
-
2026-06-15days on market $249,900 Active 134 DOM
-
2026-06-13days on market $249,900 Active 132 DOM
-
2026-06-13days on market $249,900 Active 131 DOM
-
2026-06-10days on market $249,900 Active 129 DOM
-
2026-06-09days on market $249,900 Active 128 DOM
-
2026-06-08days on market $249,900 Active 127 DOM
-
2026-06-07days on market $249,900 Active 126 DOM
-
2026-06-03days on market $249,900 Active 122 DOM
-
2026-06-02days on market $249,900 Active 121 DOM
-
2026-06-01days on market $249,900 Active 120 DOM
-
2026-05-31days on market $249,900 Active 119 DOM
-
2026-05-09$1,300
-
2026-02-01$249,900 Active 806-char remark
Show marketing remark (806 chars)
Versatile four unit investment property in the heart of Kaisertown with strong cash flows! The building features three residential apartments, garage with newer metal roof, and a large street-level retail or office space. Upper rear apartment is currently being remodeled and will be completed prior to closing. The commercial space is currently being used as storage but could be an amazing storefront with original pressed tin ceilings. Also being listed as commercial under ml 1662000. An excellent opportunity for investors, business owners, or owner-occupants. Property is offered individually or as part of a three property, seven unit package (see also ml#B1660523 and B1660521) with net income of almost 40k- income and expense report is available. Owner financing available for the package deal.
-
2011-11-01historical 155-char remark
Show marketing remark (155 chars)
Mixed use building, many possibilities- 2 apratments, 2 car garage, large retail or office space plus rear seperate office suite. Income of 1925 per month.
-
2011-10-21soldstatus $54,000 155-char remark
Show marketing remark (155 chars)
Mixed use building, many possibilities- 2 apratments, 2 car garage, large retail or office space plus rear seperate office suite. Income of 1925 per month.
-
2011-06-24$58,000 155-char remark
Show marketing remark (155 chars)
Mixed use building, many possibilities- 2 apratments, 2 car garage, large retail or office space plus rear seperate office suite. Income of 1925 per month.
ⓘ Source: listings_history table (triggers on properties + properties_extension) + one-shot
backfill from property_details.listing_events for pre-trigger history.
Nearby sold comps map
Loading sold comps map…
Walkable amenities ~0.75 mi
Loading nearby amenities…
Taxation est. · year 1
- Rental income
- $69,276
- − Mortgage interest
- −$13,998
- − Property taxes
- −$3,748
- − Insurance
- −$1,250
- − Repairs & maintenance
- −$5,542
- − Management
- −$5,542
- − Depreciation
- −$7,270
- Taxable income
- $31,926
- Est. tax owed @ 24.0%
- −$7,662
- After-tax cash flow
- $26,342/yr
For passive investors: Depreciation is non-cash, so a rental often shows a tax loss while cash-flowing — sheltering income. Rental losses are passive: they offset passive income freely, and up to $25,000/yr can offset ordinary (W-2) income if you actively participate and your MAGI is under $100k (phasing out to $0 by $150k); unused losses carry forward. On sale, claimed depreciation is recaptured at up to 25%, and gains may owe capital-gains tax (a 1031 exchange can defer both). Figures are a year-1 estimate at your 24.0% rate — not tax advice; consult a CPA.
Schools (NCES district)
- District
- Buffalo City School District
- NCES district ID
- 3605850
- Math proficiency
- 41% ▲ 11.00%
- Reading proficiency
- 40% ▲ 7.00%
- Median HH income
- $31,665
- Composite
- 33.17/100
- National rank
- #5544
- State rank
- #535 of 590 in NY
Livability — Buffalo
- Score
- 77/100
- State rank
- #195
- US rank
- #3011
Category grades
Schools grade is shown separately in the Schools card above.
Census & demographics
- Census place
- Buffalo, NY
- County
- Erie County · 714,559 people
- City population
- 440,021
- Metro
- Buffalo-Cheektowaga, NY
- Population (ZIP)
- 21,631
- Household income
- $50,450
- Rent vs Own
- Severe rent burden
- 841.0
Population outlook (Erie County) Hauer SSP2
- Today (2025)
- 933,037 people
- By 2030
- 935,181 · +0.2%
- By 2040
- 928,531 · -0.5%
- By 2050
- 905,725 · -2.9%
- By 2075
- 834,037 · -10.6%
- By 2100
- 708,033 · -24.1%
Race, ethnicity, and origin ACS 2023
- Neighborhood character
- Majority White (65%)
- Race & ethnicity
- White 65% Hispanic / Latino 13% Black 12% Two or more races 8% Asian 4%
- Hispanic origin (detail)
- Mexican 2% Puerto Rican 10%
- Common ancestry
- Romanian 25% Lithuanian 1% Italian 1%
- Foreign-born
- 6% · Canada, China
- Languages at home
- 88% English-only · Spanish 5% Other Indo-European 3% Arabic 2%
Political lean MEDSL · Erie
- 2024 margin
- Lean D (+9.7) · D 54.8% · R 45.2%
- 2008→2024 swing
- -7.9pp toward R · 2008: 17.5pp · 2024: 9.7pp
- All cycles
- 2024: D+9.7 2020: D+14.7 2016: D+4.8 2012: D+15.6 2008: D+17.5
Not yet ingested
- Civics
- —
Market trends
- HPI YoY
- ▲ 8.06%
- Current HPI
- 457.3935
- Rent YoY
- —
- Metro
- Buffalo-Cheektowaga, NY
- State GDP YoY
- ▲ 2.60%
- F500 in state
- 92
Industry mix (Fortune 500 HQ in NY)
| Industry | F500 HQs | Revenue |
|---|---|---|
| Financial Services | 10 | $950B |
|
||
| Consumer Goods | 9 | $162B |
|
||
| Insurance | 4 | $225B |
|
||
| Telecommunications | 2 | $144B |
|
||
| Pharmaceuticals | 2 | $112B |
|
||
| Media / Entertainment | 2 | $69B |
|
||
Price history
-97.8% since first listed5 events — show timeline
- 2026-05-09 Listed for Rent $1,300 SHOWMOJO
- 2026-02-01 Listed $249,900 WNYREIS
- 2011-11-01 Listing Removed — WNYREIS
- 2011-10-21 Sold (MLS) $54,000 WNYREIS
- 2011-06-24 Listed $58,000 WNYREIS
Cash-flow waterfall
monthlySold comps — $/sqft
last 12 mo · ≤1 miLoading sold comps…