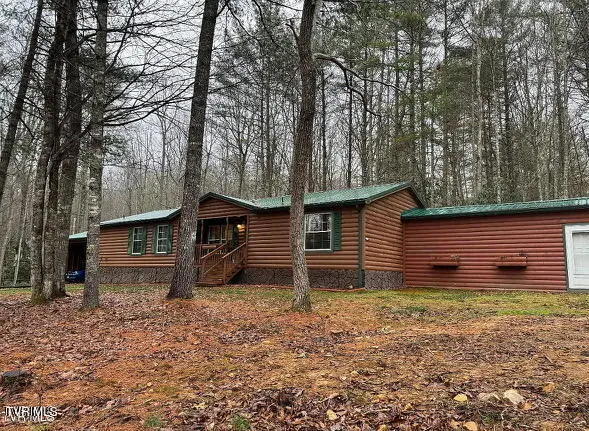
268 Park Service Rd · Mountain City, TN
Flood risk No data
- FEMA flood zone
- —
- Chance of flooding over 30 yrs
- —
- Est. flood insurance / yr
- —
Fire risk No data
- Est. fire insurance / yr
- —
Heat risk No data
- Hot days now (above threshold)
- —
- Hot days in 30 yrs
- —
Wind risk No data
- Chance of severe wind over 30 yrs
- —
Air-quality risk No data
- Unhealthy air days now
- —
- Unhealthy air days in 30 yrs
- —
Risk factors via First Street. Map © Google.
Why this score? — see what drove the D- grade
The composite is a weighted blend of 9 inputs, each scored 0–100. Each bar is that input's sub-score; the figure is the points it added to the 100-point composite (weight × sub-score).
- Appreciation +10.0/10.0
- Cash flow +7.7/30.0
- ARV discount +7.5/15.0
- Livability +3.2/5.0
- Rent growth +2.5/5.0
- Condition / age +2.5/5.0
- Schools +2.4/10.0
- 1% rule +2.3/10.0
- DSCR +1.8/10.0
$219,000
🖨 Deal sheet 📄 Offer letter ✓ Due diligence
Listing remarks MLS
2 ACRES, DEAD END STREET AND BACKS UP TO DOE MOUNTAIN! Lots of trees for privacy, part sloping-part level land, electric at road, easy access, 2 acres and backs up to Doe Mountain! Close to schools, shopping, grocery stores, Redtail Golf Course, Watauga Lake, Boone, NC, Virginia Creeper Trails and Bristol Raceway! BUILDERS ARE READY TO BUILD YOUR DREAM HOME TODAY! Come see today! Information to be verified by buyer/buyer's agent.
Key facts
- Log sided home
- Split floor plan
- Large living room
Tags
Property features AI
Exterior
- Parking: 1-car garage; 2-space carport
- Utilities: Public water; Septic tank
- Home design: Manufactured house; Single-family residence
- Construction: Log construction
- Exterior features: Metal roof; Partially wooded lot
Interior
- Kitchen: Dishwasher; Microwave; Range; Refrigerator
- Bathrooms: 2 full bathrooms
- Heating & cooling: Heat pump heating; Heat pump cooling
- Interior features: Fireplace (1)
- Laundry & utility: Washer; Dryer
Neighborhood map
What this means for you Summary
Snapshot
- This is a 3-bed/2.0-bath other listed at $219k.
Deal economics
- At list price, monthly cash flow is $-252 ($-3k/yr) — negative.
- To cash-flow at today's rent, offer at most $183k (16.7% below list).
- To meet the 1% rule (rent ≥ 1% of price), the offer needs to be $160k (27.1% below list).
- Recommended offer: $160k (27.1% below list) — sets the bar for 1% rule.
- Cap rate 4.9% vs local median 2.1% in Mountain City — top-decile yield for the area; either an underpriced asset or a hidden risk that comps aren't pricing in. Stress-test before assuming the spread holds.
Location & tenants
- Location reads 63/100 on livability (#191 in TN) — a middle-class / working-renter tenant base. Strengths: crime A+, cost of living A+; Watch: housing C-, health & safety C-, amenities F.
- Johnson County (rural): math 27% / reading 31% proficiency, ranked #69 of 139 in TN (top 50%) — low school quality limits family demand, transient renter base, plan for 1-2y turnover.
- Zoned schools: Doe Elementary (math 37% / reading 32%, grade F, #319 of 952 statewide, top 37%, 217 students, 0% FRL); Johnson Co Middle School (math 28% / reading 31%, grade F, #107 of 333 statewide, top 33%, 284 students, 0% FRL); Johnson Co High School (math 17% / reading 32%, grade F, #129 of 332 statewide, top 43%, 643 students, 0% FRL) — zoned schools average 0% FRL vs 59% district-wide (59 pts lower); this property's tenant base skews higher-income than the district average.
- Market conditions: 130 active listings in the ZIP; 6 units permitted in Johnson County in 2024 (0 in 5+ unit buildings).
Forward outlook
- In year one you build about $23k of equity ($2k loan paydown + $22k appreciation (10.0% local appreciation)).
- Johnson County population projected at -21% by 2050 — secular population decline; favor cash flow + early exit over multi-decade hold.
- By year 2, paydown + projected appreciation supports a ~$38k cash-out refi (75% LTV) — recoverable capital for the next deal without selling this one.
Negotiation context
- It's been on market 18 days — a 2% lower offer ($216k) is reasonable based on typical stale-listing flexibility.
- 2 sale attempts since 13y ago with the ask held roughly flat each time — persistent listings suggest the price (not the market) is what's stuck; bring a comps-based counter.
- Current owner paid $8k; list at $219k implies a 2638% gain — meaningful room to come down on a strong offer.
Questions for the listing agent
- What do current leases actually rent for vs. the listed asking? Can we see a recent rent roll and the last 12 months of T-12 income?
- Is there a deadline driving the sale (1031 exchange, divorce, estate, relocation)? That informs how much negotiation room exists.
- Schools are F-rated, which usually means shorter tenancies and higher turnover. Who's the typical renter profile here, and what's been the actual vacancy rate?
- The area grade is low — what's the realistic commute time and amenity access for the typical tenant pool here? Any planned neighborhood developments (good or bad) we should know about?
- What's the average days-on-market for RENTAL listings here right now (not sales)? A rising rental-DOM trend means longer vacancies and softer asking-rent achievability than the comps imply.
- What's the recent tenant-quality profile in this submarket — average credit score on applications, eviction rate, late-payment / NSF rate, and stable-employment percentage? A property-management company in the area should have these aggregated.
- How much new for-sale + rental construction is in the pipeline within 1–3 miles? Heavy new supply typically softens prices + rents 12–24 months out; constrained supply supports both.
Investment metrics
- 1% rule
- 0.73% ✗
- Cap rate
- 4.91%
- Cash-on-cash
- -4.93%
- DSCR
- 0.78
- GRM
- 11.4
CMA / ARV
No comps found within radius.
Projected returns pro-forma
10.0% appreciation · 3.0% rent growth · sell at horizon
- IRR
- 20.8%
- Equity multiple
- 2.68×
- Total profit
- $103,247
- Equity at exit
- $197,293
- IRR
- 18.9%
- Equity multiple
- 6.16×
- Total profit
- $316,714
- Equity at exit
- $425,469
Cash invested: $61,320 (down + closing). Projections, not guarantees.
Landlord ↔ Tenant lean methodology
- Overall (STATE)
- 87 Strongly Landlord-Friendly
- State Tennessee
- 87 Strongly Landlord-Friendly · R+13
- County
- — inherits STATE
- City
- — inherits STATE
ZIP-level market 37683
- Home prices YoY
- 10.5%
- Active inventory
- 130
- Price-to-rent
- 11.4×
Monthly cashflow live
- Estimated rent
- $1,597 medium interval (Pro) →
- Mortgage (P&I)
- −$1,148
- Tax est. 1.5%
- −$274 /mo · $3,285/yr
- Insurance
- −$91
- HOA
- −$0
- Vacancy / Maint / Mgmt
- −$335
- Net cashflow
- $-252
Break-even live
UW: 25.0% down · 7.5% · 30yr · 1.5% tax · 5.0% vac · 8.0% maint · 8.0% mgmt
Financing live
Cash to close
- Down payment
- $54,750
- Closing costs
- $6,570
- Reserves months
- —
- Total cash needed
- —
Loan-product check · same deal, 3 products live
Conventional
25% down · 7.5% · 30yr
- Down + closing
- —
- Monthly P&I
- —
- Monthly cashflow
- —
- DSCR
- —
- Eligible?
- —
Personal DTI + credit; lowest rate.
DSCR
20% down · 8.5% · 30yr
- Down + closing
- —
- Monthly P&I
- —
- Monthly cashflow
- —
- DSCR
- —
- Eligible?
- —
No personal income docs; deal must DSCR.
Hard money
10% down · 12.0% · 12mo
- Down + closing
- —
- Monthly P&I
- —
- Monthly cashflow
- —
- DSCR
- —
- Eligible?
- —
Short-term bridge; refi at stabilization.
Listing history 13 events
-
2026-06-19days on market $219,000 Active 18 DOM
-
2026-06-18days on market $219,000 Active 17 DOM
-
2026-06-17days on market $219,000 Active 16 DOM
-
2026-06-16days on market $219,000 Active 15 DOM
-
2026-06-15days on market $219,000 Active 14 DOM
-
2026-06-14days on market $219,000 Active 12 DOM
-
2026-06-13days on market $219,000 Active 11 DOM
-
2026-06-10days on market $219,000 Active 9 DOM
-
2026-06-09days on market $219,000 Active 8 DOM
-
2026-06-08days on market $219,000 Active 7 DOM
-
2026-06-07days on market $219,000 Active 6 DOM
-
2026-06-02remarks 570-char remark
-
2026-06-02$219,000 Active 1 DOM
ⓘ Source: listings_history table (triggers on properties + properties_extension) + one-shot
backfill from property_details.listing_events for pre-trigger history.
Nearby sold comps map
Loading sold comps map…
Walkable amenities ~0.75 mi
Loading nearby amenities…
Taxation est. · year 1
- Rental income
- $19,161
- − Mortgage interest
- −$12,267
- − Property taxes
- −$3,285
- − Insurance
- −$1,095
- − Repairs & maintenance
- −$1,533
- − Management
- −$1,533
- − Depreciation
- −$6,371
- Taxable loss
- −$6,923
- Est. tax savings @ 24.0%
- +$1,661
- After-tax cash flow
- $-1,363/yr
For passive investors: Depreciation is non-cash, so a rental often shows a tax loss while cash-flowing — sheltering income. Rental losses are passive: they offset passive income freely, and up to $25,000/yr can offset ordinary (W-2) income if you actively participate and your MAGI is under $100k (phasing out to $0 by $150k); unused losses carry forward. On sale, claimed depreciation is recaptured at up to 25%, and gains may owe capital-gains tax (a 1031 exchange can defer both). Figures are a year-1 estimate at your 24.0% rate — not tax advice; consult a CPA.
Schools (NCES district)
- District
- Johnson County
- NCES district ID
- 4702160
- Math proficiency
- 27% ▼ -11.00%
- Reading proficiency
- 31% ▬ 0.00%
- Median HH income
- $31,298
- Composite
- 23.58/100
- National rank
- #7852
- State rank
- #69 of 139 in TN
Livability — Mountain City
- Score
- 63/100
- State rank
- #191
- US rank
- #15252
Category grades
Schools grade is shown separately in the Schools card above.
Census & demographics
- Population (ZIP)
- 13,716
Population outlook (Johnson County) Hauer SSP2
- Today (2025)
- 16,842 people
- By 2030
- 16,158 · -4.1%
- By 2040
- 14,682 · -12.8%
- By 2050
- 13,306 · -21.0%
- By 2075
- 11,087 · -34.2%
- By 2100
- 9,360 · -44.4%
Race, ethnicity, and origin ACS 2023
- Neighborhood character
- Predominantly White (86%)
- Race & ethnicity
- White 86% Two or more races 6% Black 5% Hispanic / Latino 3%
- Common ancestry
- Serbian 5% Slovak 3% Romanian 1%
- Foreign-born
- 3% · Canada
- Languages at home
- 95% English-only · Spanish 4% German/W. Germanic 1%
Political lean MEDSL · Johnson
- 2024 margin
- Solid R (+69.3) · D 15.0% · R 84.3%
- 2008→2024 swing
- -27.1pp toward R · 2008: -42.2pp · 2024: -69.3pp
- All cycles
- 2024: R+69.3 2020: R+66.9 2016: R+67.3 2012: R+50.5 2008: R+42.2
Not yet ingested
- Civics
- —
Market trends
- HPI YoY
- ▲ 29.22%
- Current HPI
- 307.8545
- Rent YoY
- —
- Metro
- —
- State GDP YoY
- ▲ 2.78%
- F500 in state
- 22
Industry mix (Fortune 500 HQ in TN)
| Industry | F500 HQs | Revenue |
|---|---|---|
| Healthcare | 3 | $91B |
|
||
| Retail | 3 | $72B |
|
||
| Transportation / Logistics | 1 | $88B |
|
||
| Paper / Packaging | 1 | $19B |
|
||
| Insurance | 1 | $13B |
|
||
| Energy | 1 | $12B |
|
||
Price history
+1464.3% since first listed16 events — show timeline
- 2026-05-29 Listed $219,000 TVRMLS
- 2026-05-01 Price Changed $209,500 TVRMLS
- 2026-03-30 Price Changed $219,500 TVRMLS
- 2026-03-23 Price Changed $224,500 TVRMLS
- 2026-03-15 Price Changed $229,500 TVRMLS
- 2026-03-11 Price Changed $239,500 TVRMLS
- 2026-03-08 Price Changed $249,500 TVRMLS
- 2026-02-24 Price Changed $257,500 TVRMLS
- 2026-02-04 Price Changed $269,500 TVRMLS
- 2026-01-17 Price Changed $286,500 TVRMLS
- 2025-12-08 Price Changed $298,500 TVRMLS
- 2025-12-02 Price Changed $305,000 TVRMLS
- 2025-11-18 Price Changed $317,500 TVRMLS
- 2025-05-02 Price Changed $335,000 TVRMLS
- 2018-01-25 Sold (MLS) $8,000 TVRMLS
- 2013-05-24 Listed $14,000 TVRMLS
Property tax history
+0.0%/yrLatest (2025): $293 · +0.0% YoY. Source: county tax records.
Cash-flow waterfall
monthlySold comps — $/sqft
last 12 mo · ≤1 miLoading sold comps…