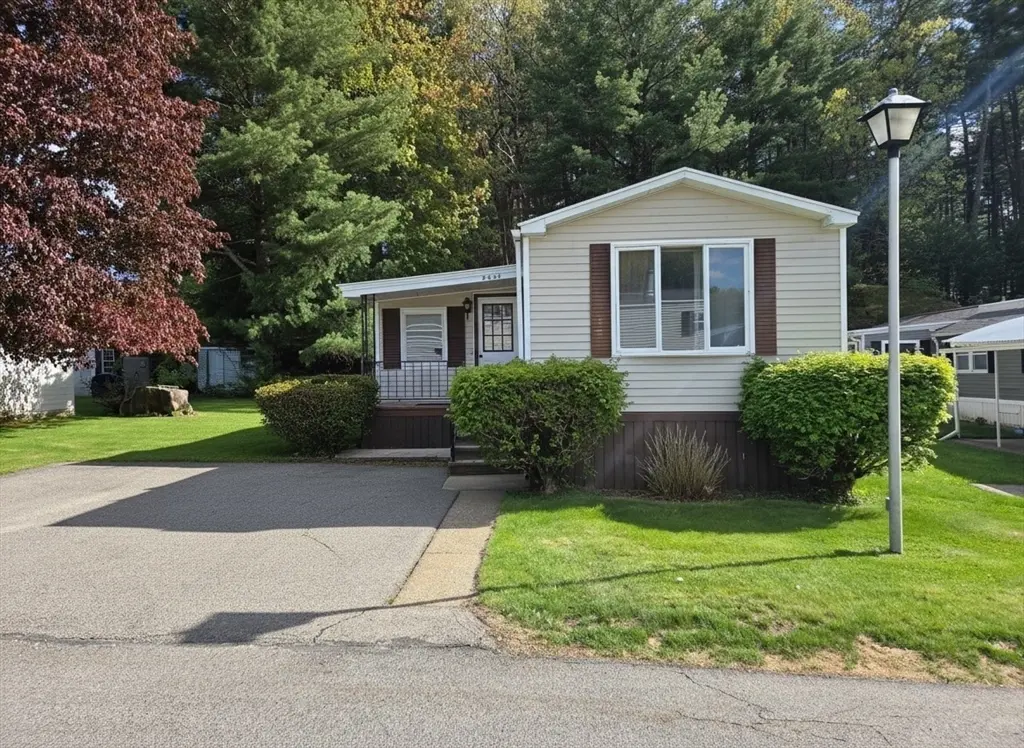
23 Catherine Dr · Marlborough, MA
Flood risk 1/10 · Minimal
- FEMA flood zone
- X (unshaded)
- Chance of flooding over 30 yrs
- 0.0%
- Est. flood insurance / yr
- $507 – $1,088
Fire risk 2/10 · Minimal
- Est. fire insurance / yr
- $915 – $1,699
Heat risk 5/10 · Moderate
- Hot days now (above 96°F)
- 7 days/yr
- Hot days in 30 yrs
- 15 days/yr
Wind risk 6/10 · Moderate
- Chance of severe wind over 30 yrs
- 27.0%
Air-quality risk 2/10 · Minimal
- Unhealthy air days now
- 1 days/yr
- Unhealthy air days in 30 yrs
- 2 days/yr
Risk factors via First Street. Map © Google.
Why this score? — see what drove the D+ grade
The composite is a weighted blend of 9 inputs, each scored 0–100. Each bar is that input's sub-score; the figure is the points it added to the 100-point composite (weight × sub-score).
- Cash flow +12.6/30.0
- 1% rule +9.6/10.0
- ARV discount +8.3/15.0
- Livability +3.8/5.0
- DSCR +3.7/10.0
- Rent growth +2.8/5.0
- Schools +2.7/10.0
- Condition / age +2.2/5.0
- Appreciation +0.0/10.0
$169,900
🖨 Deal sheet 📄 Offer letter ✓ Due diligence
Listing remarks
Make a date to see this long and lovely mobile home in Gulbankian's, a popular east side park in a country setting abutting Callahan State Park. Cabinet packed kitchen flows into entertainment size double living room w/ dining area and home office area w/ built in cabinets-2 good size bedrooms w/ lots of closets. Full bathroom w/ laundry area. All appliances included. Welcoming sunroom offers more living space plus a big back porch for enjoying the sights/sounds of nature. Private backyard w/ a storage shed and plenty of room for a garden and grill. Easy access to major routes-shopping-dining-entertainment. Short distance to Memorial Beach. Marlborough Country Club and across town from the
Key facts
- Private backyard
- Welcoming sunroom
- Storage shed
Tags
Property features AI
Finance
- HOA & community: Homeowners association membership required; Association fee of $802
Exterior
- Parking: Off-street paved parking; 2 open parking spaces
- Utilities: Public water; Public sewer; Electric service with circuit breakers; Electric range hookup
- Home design: Mobile home with an addition; Beige exterior; Shingle roof
- Construction: Modular construction; Year built approximate (owner provided)
- Exterior features: Porch; Exterior storage; Paved road frontage on a private road; Lake/pond nearby; beach access is public (unknown distance to beach)
Interior
- Kitchen: Vinyl flooring; Range; Refrigerator
- Bedrooms: Master bedroom on the first floor with closet and wall-to-wall carpet; Second bedroom on the first floor with closet and wall-to-wall carpet
- Flooring: Vinyl flooring; Wall-to-wall carpet
- Bathrooms: One full bathroom on the first floor
- Heating & cooling: Electric baseboard heating
- Interior features: Sun room; Total of 5 rooms
- Laundry & utility: Laundry on the first floor
Neighborhood map
What this means for you Summary
Snapshot
- This is a 2-bed/1.0-bath manufactured listed at $170k. Condition is rated fair.
Deal economics
- At list price, monthly cash flow is $-23 ($-272/yr) — negative.
- To cash-flow at today's rent, offer at most $167k (1.9% below list).
- Meets the 1% rule at list price ($2k rent vs $170k).
- Recommended offer: $165k (3.0% below list) — sets the bar for market timing.
- Cap rate 6.1% vs local median 3.4% in Marlborough — top-decile yield for the area; either an underpriced asset or a hidden risk that comps aren't pricing in. Stress-test before assuming the spread holds.
Location & tenants
- Location reads 76/100 on livability (#59 in MA, #3,372 nationally) — a middle-class / working-renter tenant base. Strengths: employment A+, housing A+, health & safety A+; Watch: crime C-, amenities F, cost of living F.
- Marlborough (suburban): math 23% / reading 34% proficiency, ranked #250 of 302 in MA (top 83%) — low school quality limits family demand, transient renter base, plan for 1-2y turnover.
- Market conditions: Rents rising (+1.2%/yr); 62 active listings in the ZIP; 6 comparable units currently listed for rent nearby; rentals at typical pace (median 18d on market — plan ~3-4 weeks tenant-placement turnaround); solid renter incomes; 3,670 units permitted in Middlesex County in 2024 (2,611 in 5+ unit buildings).
- This rent runs 32% of the median local income ($92k/yr) — at the standard rent-burdened threshold; future hikes will face affordability resistance.
Forward outlook
- Local home prices are declining (-3.0%/yr); year-one equity from $1k of loan paydown is wiped out by about $5k of value loss. Plan a longer hold.
- Middlesex County population projected at +20% by 2050 — long-run rental-demand tailwind backs the buy-and-hold thesis.
Negotiation context
- It's been on market 36 days — a 3% lower offer ($165k) is reasonable based on typical stale-listing flexibility.
Risks & watch-outs
- Watch-outs: HOA is 32% of rent.
- Climate carrying-cost: major wind risk, 27% chance of damaging wind over 30y; extreme-heat days projected 7→15/yr by 2055 (HVAC capex compounding) — expect insurance premiums to compound above CPI over the hold.
Questions for the listing agent
- What do current leases actually rent for vs. the listed asking? Can we see a recent rent roll and the last 12 months of T-12 income?
- It's been on market 36 days. Have you received any prior offers? Is the seller open to a 3% concession, seller financing, or rate buy-down credit?
- Have any recent inspections been done? Can we get a copy of the seller's disclosures and any deferred-maintenance estimates?
- What does the HOA fee cover, when was the last increase, and are there any pending special assessments or reserve-fund shortfalls?
- Is there a deadline driving the sale (1031 exchange, divorce, estate, relocation)? That informs how much negotiation room exists.
- Schools are B-rated — typically a magnet for longer-tenancy family renters. What's the average tenant stay here, and is there a school-zone premium baked into asking?
- The area grade is low — what's the realistic commute time and amenity access for the typical tenant pool here? Any planned neighborhood developments (good or bad) we should know about?
- What's the average days-on-market for RENTAL listings here right now (not sales)? A rising rental-DOM trend means longer vacancies and softer asking-rent achievability than the comps imply.
- What's the recent tenant-quality profile in this submarket — average credit score on applications, eviction rate, late-payment / NSF rate, and stable-employment percentage? A property-management company in the area should have these aggregated.
- How much new for-sale + rental construction is in the pipeline within 1–3 miles? Heavy new supply typically softens prices + rents 12–24 months out; constrained supply supports both.
Investment metrics
- 1% rule
- 1.46% ✓
- Cap rate
- 6.13%
- Cash-on-cash
- -0.57%
- DSCR
- 0.97
- GRM
- 5.7
CMA / ARV
- ARV (median comp)
- $173,037
- List price
- $169,900
- Delta
- -1.81%
- Verdict
- FAIR
- Comps
- 8 within 1.0 mi
Show comp detail 12 sales within ~0.75 mi
| Address | Dist | Beds/Ba | Sqft | Sold | Price | $/sf | Match |
|---|---|---|---|---|---|---|---|
| 11 Sonia Dr | 0.18mi | 2/1.0 | 1,000 (-5%) | 1mo | $184,900 | $185 | 83 |
| 19 Catherine Dr | 0.01mi | 2/1.0 | 1,120 (+7%) | 12mo | $169,000 | $151 | 78 |
| 32 Ethel Ave | 0.18mi | 2/2.0 | 1,000 (-5%) | 2mo | $175,000 | $175 | 78 |
| 29 Ethel Ave | 0.20mi | 2/2.0 | 1,056 (+1%) | 10mo | $180,000 | $170 | 77 |
| 31 Sonia Dr | 0.17mi | 2/1.0 | 1,120 (+7%) | 6mo | $155,000 | $138 | 76 |
| 82 Sonia Dr | 0.21mi | 2/1.0 | 1,000 (-5%) | 9mo | $149,900 | $150 | 75 |
| 25 Tavitian Blvd | 0.11mi | 2/1.0 | 1,104 (+5%) | 21mo | $115,900 | $105 | 68 |
| 79 Sonia Dr | 0.19mi | 2/1.0 | 980 (-7%) | 14mo | $100,000 | $102 | 68 |
| 29 Eldorado | 0.30mi | 2/2.0 | 1,100 (+5%) | 8mo | $203,000 | $185 | 68 |
| 62 Sonia Dr | 0.20mi | 2/1.5 | 1,125 (+7%) | 16mo | $194,000 | $172 | 64 |
| 30 Eldorado Dr | 0.30mi | 3/2.0 (+1) | 1,100 (+5%) | 18mo | $196,500 | $179 | 54 |
| 10 Eldorado Dr | 0.23mi | 3/2.0 (+1) | 900 (-14%) | 5mo | $103,000 | $114 | 53 |
Match score weights: distance 35% · size 25% · config 20% · recency 20%. Top-matched comps best support the ARV.
Projected returns pro-forma
-3.0% appreciation · 1.16% rent growth · sell at horizon
- IRR
- -20.4%
- Equity multiple
- 0.31×
- Total profit
- $-32,938
- Equity at exit
- $25,333
- IRR
- -21.7%
- Equity multiple
- 0.03×
- Total profit
- $-46,163
- Equity at exit
- $14,690
Cash invested: $47,572 (down + closing). Projections, not guarantees.
Landlord ↔ Tenant lean methodology
- Overall (STATE)
- 20 Strongly Tenant-Friendly
- State Massachusetts
- 20 Strongly Tenant-Friendly · D+15
- County
- — inherits STATE
- City
- — inherits STATE
ZIP-level market 01752
- Rents YoY
- 1.2%
- Active inventory
- 62
- Price-to-rent
- 5.7×
Monthly cashflow live
- Estimated rent
- $2,473 high interval (Pro) →
- Mortgage (P&I)
- −$891
- Tax est. 1.5%
- −$212 /mo · $2,548/yr
- Insurance
- −$71
- HOA
- −$802
- Vacancy / Maint / Mgmt
- −$519
- Net cashflow
- $-23
Break-even live
UW: 25.0% down · 7.5% · 30yr · 1.5% tax · 5.0% vac · 8.0% maint · 8.0% mgmt
Financing live
Cash to close
- Down payment
- $42,475
- Closing costs
- $5,097
- Reserves months
- —
- Total cash needed
- —
Loan-product check · same deal, 3 products live
Conventional
25% down · 7.5% · 30yr
- Down + closing
- —
- Monthly P&I
- —
- Monthly cashflow
- —
- DSCR
- —
- Eligible?
- —
Personal DTI + credit; lowest rate.
DSCR
20% down · 8.5% · 30yr
- Down + closing
- —
- Monthly P&I
- —
- Monthly cashflow
- —
- DSCR
- —
- Eligible?
- —
No personal income docs; deal must DSCR.
Hard money
10% down · 12.0% · 12mo
- Down + closing
- —
- Monthly P&I
- —
- Monthly cashflow
- —
- DSCR
- —
- Eligible?
- —
Short-term bridge; refi at stabilization.
Rent comps 6 comps
| Address | Beds | Baths | Sqft | Rent | $/sqft | DOM | Units | Dist |
|---|---|---|---|---|---|---|---|---|
| 740 Farm Rd Marlborough, MA | 2.0 | 1.0 | 619 | $2,209 | $3.57 | 1d | 12 | 0.42mi |
| 750 Farm Rd #128 Marlborough, MA | 2.0 | 1.0 | 848 | $2,800 | $3.30 | 18d | 1 | 0.43mi |
| 586 Boston Post Rd E #6 Marlborough, MA | 2.0 | 1.0 | 859 | $2,050 | $2.39 | 43d | 1 | 0.47mi |
| 447 Boston Post Rd E Marlborough, MA | 1.0 | 1.0 | 750 | $1,955 | $2.61 | 1d | 1 | 0.54mi |
| 688 Boston Post Rd E #223 Marlborough, MA | 2.0 | 1.0 | 924 | $2,100 | $2.27 | 43d | 1 | 0.55mi |
| 339 Boston Post Rd E Marlborough, MA | 1.0–3.0 | 1.0–2.0 | 1160 | $3,727 | $3.21 | 1d | 27 | 0.73mi |
HOA detail
- Monthly dues
- $802 · $9,624/yr
Listing history 14 events
-
2026-06-18days on market $169,900 Active 36 DOM
-
2026-06-17days on market $169,900 Active 35 DOM
-
2026-06-16days on market $169,900 Active 34 DOM
-
2026-06-15days on market $169,900 Active 33 DOM
-
2026-06-13days on market $169,900 Active 31 DOM
-
2026-06-09statusdays on market $169,900 Active 27 DOM
-
2026-06-08days on market $169,900 Price Changed 26 DOM
-
2026-06-07pricestatusdays on market $169,900 Price Changed 25 DOM
-
2026-06-04days on market $180,000 Active 22 DOM
-
2026-06-03days on market $180,000 Active 21 DOM
-
2026-06-02days on market $180,000 Active 20 DOM
-
2026-06-01days on market $180,000 Active 19 DOM
-
2026-05-31days on market $180,000 Active 18 DOM
-
2026-05-13$180,000 New 973-char remark
ⓘ Source: listings_history table (triggers on properties + properties_extension) + one-shot
backfill from property_details.listing_events for pre-trigger history.
Climate risk First Street
- Flood 1/10 Low FEMA zone X (unshaded) · 0% chance over 30 yrs
- Wildfire 2/10 Low
- Heat 5/10 Major 7 d/yr ≥96°F today · 15 d/yr by 30 yrs out
- Wind 6/10 Major 27% chance of damaging wind over 30 yrs
- Air quality 2/10 Low 1 unhealthy d/yr today · 2 by 30 yrs out
Nearby sold comps map
Loading sold comps map…
Walkable amenities ~0.75 mi
Loading nearby amenities…
Taxation est. · year 1
- Rental income
- $29,673
- − Mortgage interest
- −$9,517
- − Property taxes
- −$2,548
- − Insurance
- −$850
- − Repairs & maintenance
- −$2,374
- − Management
- −$2,374
- − HOA
- −$9,624
- − Depreciation
- −$4,943
- Taxable loss
- −$2,556
- Est. tax savings @ 24.0%
- +$613
- After-tax cash flow
- $342/yr
For passive investors: Depreciation is non-cash, so a rental often shows a tax loss while cash-flowing — sheltering income. Rental losses are passive: they offset passive income freely, and up to $25,000/yr can offset ordinary (W-2) income if you actively participate and your MAGI is under $100k (phasing out to $0 by $150k); unused losses carry forward. On sale, claimed depreciation is recaptured at up to 25%, and gains may owe capital-gains tax (a 1031 exchange can defer both). Figures are a year-1 estimate at your 24.0% rate — not tax advice; consult a CPA.
Condition & rehab AI · 23 photos
This mobile home has a fair condition with moderate repairs needed, particularly in the kitchen and bathroom. Upgrading these areas will significantly increase its value for both resale and rental.
Repairs flagged
- Moderate kitchen cabinets — dated and in need of updating
- Moderate kitchen appliances — outdated and in need of replacement
- Moderate bathroom fixtures — outdated and in need of replacement
- Minor kitchen flooring — vinyl flooring can be replaced with tile or laminate
- Minor interior walls — wallpaper can be removed and painted
Value-add opportunities
- Both update kitchen cabinets and appliances — modernizing the kitchen will increase both resale and rental value
- Both replace kitchen flooring — new flooring will improve the overall appearance and increase value
- Both replace bathroom fixtures — new fixtures will improve the bathroom's appearance and increase value
- Both paint interior walls — painting the walls will freshen up the interior and increase value
Renovation cost estimate screening
| Repair item | Severity | Est. cost |
|---|---|---|
| kitchen cabinets · dated and in need of updating | Moderate | $3,000–15,000 |
| kitchen appliances · outdated and in need of replacement | Moderate | $3,000–15,000 |
| bathroom fixtures · outdated and in need of replacement | Moderate | $3,000–15,000 |
| kitchen flooring · vinyl flooring can be replaced with tile or laminate | Minor | $500–3,000 |
| interior walls · wallpaper can be removed and painted | Minor | $500–3,000 |
| Total estimated repair cost · 5 items | $10,000–51,000 |
Value-add ROI direction
- Both update kitchen cabinets and appliances — modernizing the kitchen will increase both resale and rental value ↑
- Both replace kitchen flooring — new flooring will improve the overall appearance and increase value ↑
- Both replace bathroom fixtures — new fixtures will improve the bathroom's appearance and increase value ↑
- Both paint interior walls — painting the walls will freshen up the interior and increase value ↑
ⓘ Cost ranges are severity-bucket heuristics (US national rule-of-thumb). Get contractor quotes + a written scope before underwriting a rehab budget.
Schools (NCES district)
- District
- Marlborough
- NCES district ID
- 2507320
- Math proficiency
- 23% ▼ -14.00%
- Reading proficiency
- 34% ▼ -9.00%
- Median HH income
- $71,601
- Composite
- 26.98/100
- National rank
- #7072
- State rank
- #250 of 302 in MA
Livability — Marlborough
- Score
- 76/100
- State rank
- #59
- US rank
- #3372
Category grades
Schools grade is shown separately in the Schools card above.
Census & demographics
- Census place
- Marlborough, MA
- County
- Middlesex County · 1,437,704 people
- City population
- 41,647
- Metro
- Boston-Cambridge-Newton, MA-NH
- Population (ZIP)
- 41,647
- Household income
- $91,968
- Rent vs Own
- Severe rent burden
- 2171.0
Population outlook (Middlesex County) Hauer SSP2
- Today (2025)
- 1,740,269 people
- By 2030
- 1,817,187 · +4.4%
- By 2040
- 1,963,195 · +12.8%
- By 2050
- 2,087,461 · +20.0%
- By 2075
- 2,344,036 · +34.7%
- By 2100
- 2,383,776 · +37.0%
Race, ethnicity, and origin ACS 2023
- Neighborhood character
- Diverse neighborhood (Simpson 0.62)
- Race & ethnicity
- White 59% Hispanic / Latino 17% Two or more races 16% Asian 5% Black 4%
- Hispanic origin (detail)
- Mexican 2% Puerto Rican 3%
- Common ancestry
- Estonian 11% Lithuanian 4% Russian 3%
- Foreign-born
- 29% · Canada, China, Jamaica
- Languages at home
- 60% English-only · Other Indo-European 20% Spanish 15% French/Haitian/Cajun 1%
Political lean MEDSL · Middlesex
- 2024 margin
- Solid D (+39.5) · D 68.5% · R 29.0% · Other 2.5%
- 2008→2024 swing
- +9.3pp toward D · 2008: 30.1pp · 2024: 39.5pp
- All cycles
- 2024: D+39.5 2020: D+45.2 2016: D+38.1 2012: D+26.9 2008: D+30.1
Not yet ingested
- Civics
- —
Market trends
- HPI YoY
- ▼ -415.20%
- Current HPI
- 269.0905
- Rent YoY
- ▲ 1.16%
- Metro
- Boston-Cambridge-Newton, MA-NH
- State GDP YoY
- ▲ 2.28%
- F500 in state
- 38
Industry mix (Fortune 500 HQ in MA)
| Industry | F500 HQs | Revenue |
|---|---|---|
| Technology | 3 | $17B |
|
||
| Insurance | 2 | $84B |
|
||
| Retail | 2 | $76B |
|
||
| Life Sciences | 1 | $43B |
|
||
| Energy Technology | 1 | $31B |
|
||
| Aerospace / Defense | 1 | $18B |
|
||
Price history
-5.6% since first listed2 events — show timeline
- 2026-06-05 Price Changed $169,900 MLS PIN
- 2026-05-13 Listed $180,000 MLS PIN
Cash-flow waterfall
monthlySold comps — $/sqft
last 12 mo · ≤1 miLoading sold comps…