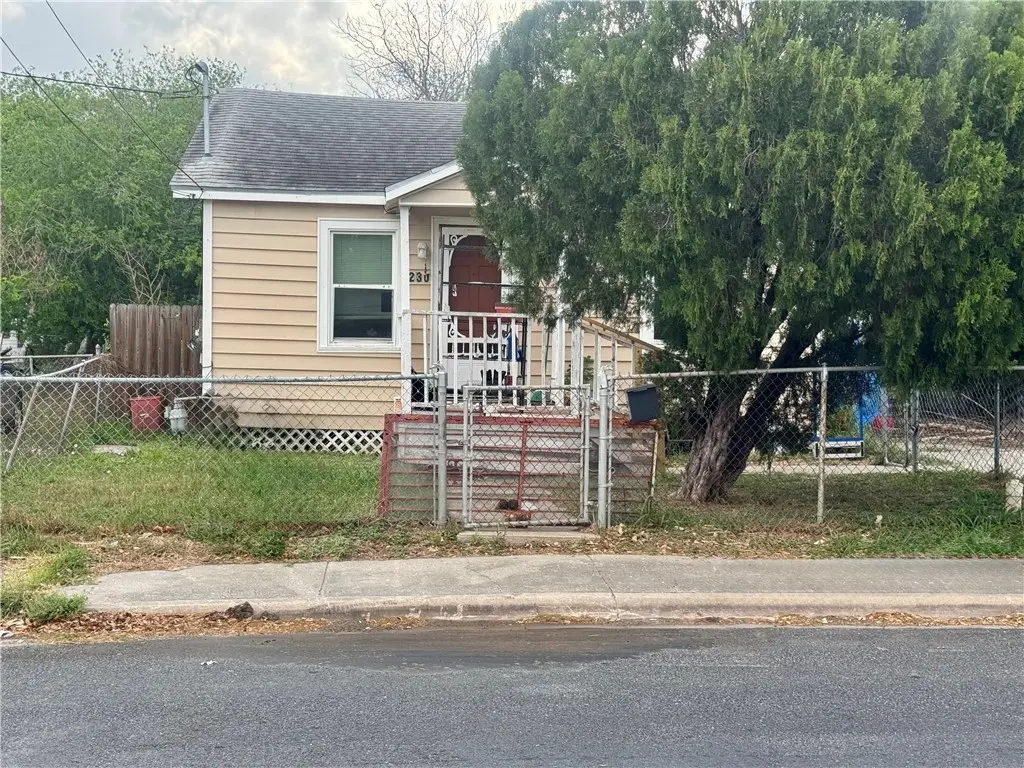
230 Osage St · Corpus Christi, TX
Flood risk 1/10 · Minimal
- FEMA flood zone
- X (unshaded)
- Chance of flooding over 30 yrs
- 0.0%
- Est. flood insurance / yr
- $507 – $1,088
Fire risk 1/10 · Minimal
- Est. fire insurance / yr
- $1,222 – $2,270
Heat risk 10/10 · Severe
- Hot days now (above 107°F)
- 7 days/yr
- Hot days in 30 yrs
- 25 days/yr
Wind risk 9/10 · Severe
- Chance of severe wind over 30 yrs
- 99.0%
Air-quality risk 1/10 · Minimal
- Unhealthy air days now
- 0 days/yr
- Unhealthy air days in 30 yrs
- 0 days/yr
Risk factors via First Street. Map © Google.
Why this score? — see what drove the B+ grade
The composite is a weighted blend of 9 inputs, each scored 0–100. Each bar is that input's sub-score; the figure is the points it added to the 100-point composite (weight × sub-score).
- Cash flow +28.4/30.0
- DSCR +10.0/10.0
- ARV discount +10.0/15.0
- 1% rule +9.7/10.0
- Appreciation +5.7/10.0
- Livability +3.9/5.0
- Schools +2.8/10.0
- Rent growth +2.5/5.0
- Condition / age +2.5/5.0
$90,000
🖨 Deal sheet 📄 Offer letter ✓ Due diligence
Listing remarks MLS
Investor Special!! Have the Opportunity to Purchase this CASHFLOW GENERATING Property. It is Currently Occupied with Tenant. Easy to Show. Property is being SOLD AS IS.
Key facts
- 7,401 sq ft lot
- Built 1955
- Listed 98 days
Neighborhood map
What this means for you Summary
Snapshot
- This is a 3-bed/2.0-bath single-family listed at $90k.
Deal economics
- At list price, monthly cash flow is $292 ($3k/yr) — positive.
- The deal already cash-flows at list — no discount required.
- Meets the 1% rule at list price ($1k rent vs $90k).
- Recommended offer: $82k (9.0% below list) — sets the bar for market timing.
- Cap rate 10.2% vs local median 3.6% in Corpus Christi — top-decile yield for the area; either an underpriced asset or a hidden risk that comps aren't pricing in. Stress-test before assuming the spread holds.
Location & tenants
- Location reads 78/100 on livability (#66 in TX, #2,404 nationally) — a middle-class / working-renter tenant base. Strengths: commute A+, cost of living A+, housing A+; Watch: crime F.
- Corpus Christi ISD (urban): math 31% / reading 35% proficiency, ranked #562 of 826 in TX (top 68%) — families likely to look elsewhere, expect single-tenant / working-renter base with shorter leases; 63% free/reduced lunch — lower-income household profile, screen leases tightly.
- Market conditions: 74 active listings in the ZIP; 16 comparable units currently listed for rent nearby; rentals at typical pace (median 21d on market — plan ~3-4 weeks tenant-placement turnaround); lower-income renter base — watch delinquency; 1,397 units permitted in Nueces County in 2024 (47 in 5+ unit buildings).
- This rent runs 41% of the median local income ($38k/yr) — at the standard rent-burdened threshold; future hikes will face affordability resistance.
Forward outlook
- In year one you build about $2k of equity ($622 loan paydown + $1k appreciation (1.4% local appreciation)).
- Nueces County population projected at +36% by 2050 — long-run rental-demand tailwind backs the buy-and-hold thesis.
- At projected returns (1.4% appreciation + 3.0% rent growth), your $25k cash investment doubles in ~5 years — after that, you're playing with house money.
Negotiation context
- It's been on market 98 days — a 9% lower offer ($82k) is reasonable based on typical stale-listing flexibility.
- 5 sale attempts since 20y ago; this cycle's ask has dropped $25k (22%) from the opening price — seller is motivated, your offer sets the floor, not the list.
Risks & watch-outs
- Watch-outs: property tax is 3.2% of price; built in 1955 — expect roof / HVAC / electrical / plumbing capex.
- Climate carrying-cost: severe wind risk, 99% chance of damaging wind over 30y; extreme-heat days projected 7→25/yr by 2055 (HVAC capex compounding) — expect insurance premiums to compound above CPI over the hold.
Questions for the listing agent
- It's been on market 98 days. Have you received any prior offers? Is the seller open to a 9% concession, seller financing, or rate buy-down credit?
- Built in 1955 — when were the roof, HVAC, electrical panel, plumbing, and water heater last replaced?
- Property tax is high relative to price — has the assessment been appealed recently, and will the sale trigger a re-assessment?
- Why hasn't it sold? Are there any deal-killer items the seller is aware of (foundation, flood, title, zoning, code violations)?
- Is there a deadline driving the sale (1031 exchange, divorce, estate, relocation)? That informs how much negotiation room exists.
- Crime grade is F in this area — have there been break-ins, vandalism, or insurance claims at this property in the last 3 years? What carrier currently insures it and at what premium?
- What's the average days-on-market for RENTAL listings here right now (not sales)? A rising rental-DOM trend means longer vacancies and softer asking-rent achievability than the comps imply.
- What's the recent tenant-quality profile in this submarket — average credit score on applications, eviction rate, late-payment / NSF rate, and stable-employment percentage? A property-management company in the area should have these aggregated.
- How much new for-sale + rental construction is in the pipeline within 1–3 miles? Heavy new supply typically softens prices + rents 12–24 months out; constrained supply supports both.
Investment metrics
- 1% rule
- 1.47% ✓
- Cap rate
- 10.18%
- Cash-on-cash
- 13.89%
- DSCR
- 1.62
- GRM
- 5.7
CMA / ARV
- ARV (median comp)
- $95,195
- List price
- $90,000
- Delta
- -5.46%
- Verdict
- FAIR
- Comps
- 20 within 1.0 mi
Show comp detail 12 sales within ~0.75 mi
| Address | Dist | Beds/Ba | Sqft | Sold | Price | $/sf | Match |
|---|---|---|---|---|---|---|---|
| 2901 Mary St | 0.33mi | 3/2.0 | 1,000 (-1%) | 5mo | $137,000 | $137 | 79 |
| 251 W Longview St | 0.50mi | 3/1.0 | 1,013 (+0%) | 2mo | $59,000 | $58 | 70 |
| 615 Dolores St | 0.18mi | 3/2.0 | 918 (-9%) | 8mo | $130,400 | $142 | 70 |
| 326 Virginia Ave | 0.23mi | 3/1.0 | 915 (-9%) | 3mo | $135,000 | $148 | 67 |
| 2928 Sunrise Ave | 0.29mi | 2/2.0 (-1) | 1,032 (+2%) | 12mo | $50,000 | $48 | 67 |
| 3073 Reyna St | 0.53mi | 3/2.0 | 1,036 (+3%) | 8mo | $110,000 | $106 | 64 |
| 222 Westgate Dr | 0.41mi | 2/1.0 (-1) | 1,067 (+6%) | 4mo | $59,999 | $56 | 59 |
| 3650 Braniff St | 0.70mi | 3/1.0 | 986 (-2%) | 2mo | $69,900 | $71 | 58 |
| 214 Shawnee | 0.32mi | 3/1.0 | 922 (-8%) | 12mo | $119,000 | $129 | 57 |
| 2613 Mary St | 0.60mi | 2/1.0 (-1) | 992 (-2%) | 6mo | $60,000 | $60 | 55 |
| 314 Old Robstown | 0.61mi | 3/2.0 | 1,121 (+11%) | 8mo | $162,500 | $145 | 46 |
| 423 Fairview Dr | 0.68mi | 3/1.5 | 1,110 (+10%) | 4mo | $120,000 | $108 | 46 |
Match score weights: distance 35% · size 25% · config 20% · recency 20%. Top-matched comps best support the ARV.
Projected returns pro-forma
1.42% appreciation · 3.0% rent growth · sell at horizon
- IRR
- 16.9%
- Equity multiple
- 1.88×
- Total profit
- $22,222
- Equity at exit
- $32,711
- IRR
- 19.8%
- Equity multiple
- 3.50×
- Total profit
- $62,912
- Equity at exit
- $45,049
Cash invested: $25,200 (down + closing). Projections, not guarantees.
Landlord ↔ Tenant lean methodology
- Overall (STATE)
- 87 Strongly Landlord-Friendly
- State Texas
- 87 Strongly Landlord-Friendly · R+5
- County
- — inherits STATE
- City
- — inherits STATE
ZIP-level market 78405
- Home prices YoY
- 1.3%
- Active inventory
- 74
- Price-to-rent
- 5.7×
Monthly cashflow live
- Estimated rent
- $1,321 high interval (Pro) →
- Mortgage (P&I)
- −$472
- Tax from tax record
- −$242 /mo · $2,908/yr
- Insurance
- −$38
- HOA
- −$0
- Vacancy / Maint / Mgmt
- −$277
- Net cashflow
- $292
Break-even live
UW: 25.0% down · 7.5% · 30yr · 1.5% tax · 5.0% vac · 8.0% maint · 8.0% mgmt
Financing live
Cash to close
- Down payment
- $22,500
- Closing costs
- $2,700
- Reserves months
- —
- Total cash needed
- —
Loan-product check · same deal, 3 products live
Conventional
25% down · 7.5% · 30yr
- Down + closing
- —
- Monthly P&I
- —
- Monthly cashflow
- —
- DSCR
- —
- Eligible?
- —
Personal DTI + credit; lowest rate.
DSCR
20% down · 8.5% · 30yr
- Down + closing
- —
- Monthly P&I
- —
- Monthly cashflow
- —
- DSCR
- —
- Eligible?
- —
No personal income docs; deal must DSCR.
Hard money
10% down · 12.0% · 12mo
- Down + closing
- —
- Monthly P&I
- —
- Monthly cashflow
- —
- DSCR
- —
- Eligible?
- —
Short-term bridge; refi at stabilization.
Rent comps 16 comps
| Address | Beds | Baths | Sqft | Rent | $/sqft | DOM | Units | Dist |
|---|---|---|---|---|---|---|---|---|
| 1114 25th St Corpus Christi, TX | 1.0–2.0 | 1.0 | 712 | $1,050 | $1.47 | 13d | 6 | 0.61mi |
| 3302 Up River Rd Corpus Christi, TX | 2.0 | 1.0 | 710 | $699 | $0.98 | 13d | 1 | 0.78mi |
| 2402 Segrest St Corpus Christi, TX | 2.0 | 1.0 | 1120 | $825 | $0.74 | 21d | 1 | 0.84mi |
| 2522 Cleo St Corpus Christi, TX | 3.0 | 1.0 | 992 | $1,350 | $1.36 | 13d | 1 | 0.93mi |
| 2245 Comanche St Unit A Corpus Christi, TX | 3.0 | 1.0 | 1016 | $1,350 | $1.33 | 21d | 1 | 0.98mi |
| 3762 Up River Rd Corpus Christi, TX | 1.0–2.0 | 1.0–2.0 | 855 | $1,199 | $1.40 | 13d | 6 | 1.07mi |
| 616 16th St Unit A Corpus Christi, TX | 3.0 | 1.0 | 1040 | $1,050 | $1.01 | 44d | 1 | 1.10mi |
| 2333 Riggan St Corpus Christi, TX | 2.0 | 1.0 | 856 | $1,250 | $1.46 | 44d | 1 | 1.19mi |
| 1802 Morgan Ave Unit 1802 Corpus Christi, TX | 2.0 | 1.0 | 850 | $1,250 | $1.47 | 21d | 1 | 1.21mi |
| 1525 S 19th St Unit B Corpus Christi, TX | 3.0 | 2.0 | 1062 | $2,100 | $1.98 | 13d | 1 | 1.35mi |
| 4505 Up River Rd Corpus Christi, TX | 2.0 | 1.0 | 966 | $1,450 | $1.50 | 13d | 1 | 1.45mi |
| 110 Josephine St Corpus Christi, TX | 3.0 | 2.0 | 1050 | $2,000 | $1.90 | 44d | 1 | 1.46mi |
| 1433 12th St Corpus Christi, TX | 2.0 | 1.0 | 768 | $1,050 | $1.37 | 44d | 1 | 1.46mi |
| 1722 Trenton Dr Corpus Christi, TX | 4.0 | 2.0 | 1432 | $2,100 | $1.47 | 13d | 1 | 1.47mi |
| 2726 Grace Dr Unit A Corpus Christi, TX | 3.0 | 2.0 | 1300 | $2,095 | $1.61 | 44d | 1 | 1.49mi |
| 2706 Grace Dr Unit A Corpus Christi, TX | 3.0 | 2.0 | 1369 | $2,095 | $1.53 | 44d | 1 | 1.49mi |
Listing history 27 events
-
2026-06-18days on market $90,000 Active 98 DOM
-
2026-06-17days on market $90,000 Active 97 DOM
-
2026-06-16days on market $90,000 Active 96 DOM
-
2026-06-15days on market $90,000 Active 95 DOM
-
2026-06-14days on market $90,000 Active 93 DOM
-
2026-06-10days on market $90,000 Active 90 DOM
-
2026-06-09days on market $90,000 Active 89 DOM
-
2026-06-08days on market $90,000 Active 88 DOM
-
2026-06-07days on market $90,000 Active 87 DOM
-
2026-06-05days on market $90,000 Active 84 DOM
-
2026-06-03days on market $90,000 Active 83 DOM
-
2026-06-02days on market $90,000 Active 82 DOM
-
2026-06-01days on market $90,000 Active 81 DOM
-
2026-05-31days on market $90,000 Active 80 DOM
-
2026-05-30days on market $90,000 Active 79 DOM
-
2026-05-06price $90,000 168-char remark
Show marketing remark (168 chars)
Investor Special!! Have the Opportunity to Purchase this CASHFLOW GENERATING Property. It is Currently Occupied with Tenant. Easy to Show. Property is being SOLD AS IS.
-
2026-05-06$115,000 Active 168-char remark
Show marketing remark (168 chars)
Investor Special!! Have the Opportunity to Purchase this CASHFLOW GENERATING Property. It is Currently Occupied with Tenant. Easy to Show. Property is being SOLD AS IS.
-
2026-04-29historical 168-char remark
Show marketing remark (168 chars)
Investor Special!! Have the Opportunity to Purchase this CASHFLOW GENERATING Property. It is Currently Occupied with Tenant. Easy to Show. Property is being SOLD AS IS.
-
2026-03-31price $115,000 168-char remark
Show marketing remark (168 chars)
Investor Special!! Have the Opportunity to Purchase this CASHFLOW GENERATING Property. It is Currently Occupied with Tenant. Easy to Show. Property is being SOLD AS IS.
-
2026-03-05$124,000 Active 168-char remark
Show marketing remark (168 chars)
Investor Special!! Have the Opportunity to Purchase this CASHFLOW GENERATING Property. It is Currently Occupied with Tenant. Easy to Show. Property is being SOLD AS IS.
-
2014-01-29soldstatus 336-char remark
Show marketing remark (336 chars)
2bedroom, 2 bath in Meadow Park. Has 2 living areas. One of the living areas would work well as an additional bedroom. Large back yard with chain link fence and cross fenced for pets. Dine in Kitchen. Separate utility room with hook ups for washer and gas dryer. Unit was rented at $625. a month. Call your realtor for more information.
-
2014-01-29soldstatus
Show marketing remark (336 chars)
2bedroom, 2 bath in Meadow Park. Has 2 living areas. One of the living areas would work well as an additional bedroom. Large back yard with chain link fence and cross fenced for pets. Dine in Kitchen. Separate utility room with hook ups for washer and gas dryer. Unit was rented at $625. a month. Call your realtor for more information.
-
2011-01-24$40,000 336-char remark
Show marketing remark (336 chars)
2bedroom, 2 bath in Meadow Park. Has 2 living areas. One of the living areas would work well as an additional bedroom. Large back yard with chain link fence and cross fenced for pets. Dine in Kitchen. Separate utility room with hook ups for washer and gas dryer. Unit was rented at $625. a month. Call your realtor for more information.
-
2009-06-25$54,000
-
2007-03-06soldstatus
-
2007-01-31soldstatus
-
2006-12-11$49,900
ⓘ Source: listings_history table (triggers on properties + properties_extension) + one-shot
backfill from property_details.listing_events for pre-trigger history.
Tax reassessment forecast TX · Resets to sale price
- Current annual tax
- $2,908 · $242/mo
- Projected year-2 tax
- $2,908 · $242/mo
- Expected delta
- $0/yr ($0/mo · 0.0%)
ⓘ Screening estimate from a state-policy table — verify with the county assessor before closing.
Climate risk First Street
- Flood 1/10 Low FEMA zone X (unshaded) · 0% chance over 30 yrs
- Wildfire 1/10 Low
- Heat 10/10 Extreme 7 d/yr ≥107°F today · 25 d/yr by 30 yrs out
- Wind 9/10 Extreme 99% chance of damaging wind over 30 yrs
- Air quality 1/10 Low 0 unhealthy d/yr today · 0 by 30 yrs out
Nearby sold comps map
Loading sold comps map…
Walkable amenities ~0.75 mi
Loading nearby amenities…
Taxation est. · year 1
- Rental income
- $15,849
- − Mortgage interest
- −$5,041
- − Property taxes
- −$2,908
- − Insurance
- −$450
- − Repairs & maintenance
- −$1,268
- − Management
- −$1,268
- − Depreciation
- −$2,618
- Taxable income
- $2,296
- Est. tax owed @ 24.0%
- −$551
- After-tax cash flow
- $2,948/yr
For passive investors: Depreciation is non-cash, so a rental often shows a tax loss while cash-flowing — sheltering income. Rental losses are passive: they offset passive income freely, and up to $25,000/yr can offset ordinary (W-2) income if you actively participate and your MAGI is under $100k (phasing out to $0 by $150k); unused losses carry forward. On sale, claimed depreciation is recaptured at up to 25%, and gains may owe capital-gains tax (a 1031 exchange can defer both). Figures are a year-1 estimate at your 24.0% rate — not tax advice; consult a CPA.
Schools (NCES district)
- District
- Corpus Christi ISD
- NCES district ID
- 4815270
- Math proficiency
- 31% ▼ -18.00%
- Reading proficiency
- 35% ▼ -7.00%
- Median HH income
- $45,672
- Composite
- 28.27/100
- National rank
- #6793
- State rank
- #562 of 826 in TX
Livability — Corpus Christi
- Score
- 78/100
- State rank
- #66
- US rank
- #2404
Category grades
Schools grade is shown separately in the Schools card above.
Census & demographics
- Census place
- Corpus Christi, TX
- County
- Nueces County · 296,836 people
- City population
- 296,836
- Metro
- Corpus Christi, TX
- Population (ZIP)
- 14,602
- Household income
- $38,294
- Rent vs Own
- Severe rent burden
- 867.0
Population outlook (Nueces County) Hauer SSP2
- Today (2025)
- 418,037 people
- By 2030
- 447,123 · +7.0%
- By 2040
- 505,911 · +21.0%
- By 2050
- 567,522 · +35.8%
- By 2075
- 729,686 · +74.6%
- By 2100
- 847,087 · +102.6%
Race, ethnicity, and origin ACS 2023
- Neighborhood character
- Predominantly Hispanic (91%)
- Race & ethnicity
- Hispanic / Latino 91% Two or more races 48% Black 4% White 4%
- Hispanic origin (detail)
- Mexican 83%
- Foreign-born
- 18% · Canada
- Languages at home
- 52% English-only · Spanish 48%
Political lean MEDSL · Nueces
- 2024 margin
- R (+11.5) · D 43.8% · R 55.3%
- 2008→2024 swing
- -7.1pp toward R · 2008: -4.4pp · 2024: -11.5pp
- All cycles
- 2024: R+11.5 2020: R+2.9 2016: R+1.5 2012: R+3.2 2008: R+4.4
Not yet ingested
- Civics
- —
Market trends
- HPI YoY
- ▲ 1.42%
- Current HPI
- 113.2227
- Rent YoY
- —
- Metro
- Corpus Christi, TX
- State GDP YoY
- ▲ 3.95%
- F500 in state
- 110
Industry mix (Fortune 500 HQ in TX)
| Industry | F500 HQs | Revenue |
|---|---|---|
| Energy | 16 | $1,198B |
|
||
| Technology | 5 | $198B |
|
||
| Engineering / Construction | 4 | $72B |
|
||
| Energy Services | 3 | $60B |
|
||
| Utilities | 3 | $41B |
|
||
| Healthcare | 2 | $330B |
|
||
Price history
+80.4% since first listed12 events — show timeline
- 2026-05-06 Price Changed $90,000 CBMLS
- 2026-05-06 Listed $115,000 CBMLS
- 2026-04-29 Delisted — CBMLS
- 2026-03-31 Price Changed $115,000 CBMLS
- 2026-03-05 Listed $124,000 CBMLS
- 2014-01-29 Sold (Public Records) — Public Records
- 2014-01-29 Sold (MLS) — CBMLS
- 2011-01-24 Listed $40,000 CBMLS
- 2009-06-25 Listed $54,000 CBMLS
- 2007-03-06 Sold (Public Records) — Public Records
- 2007-01-31 Sold (MLS) — CBMLS
- 2006-12-11 Listed $49,900 CBMLS
Property tax history
+9.9%/yrLatest (2025): $2,908 · +3.6% YoY. Source: county tax records.
Cash-flow waterfall
monthlySold comps — $/sqft
last 12 mo · ≤1 miLoading sold comps…