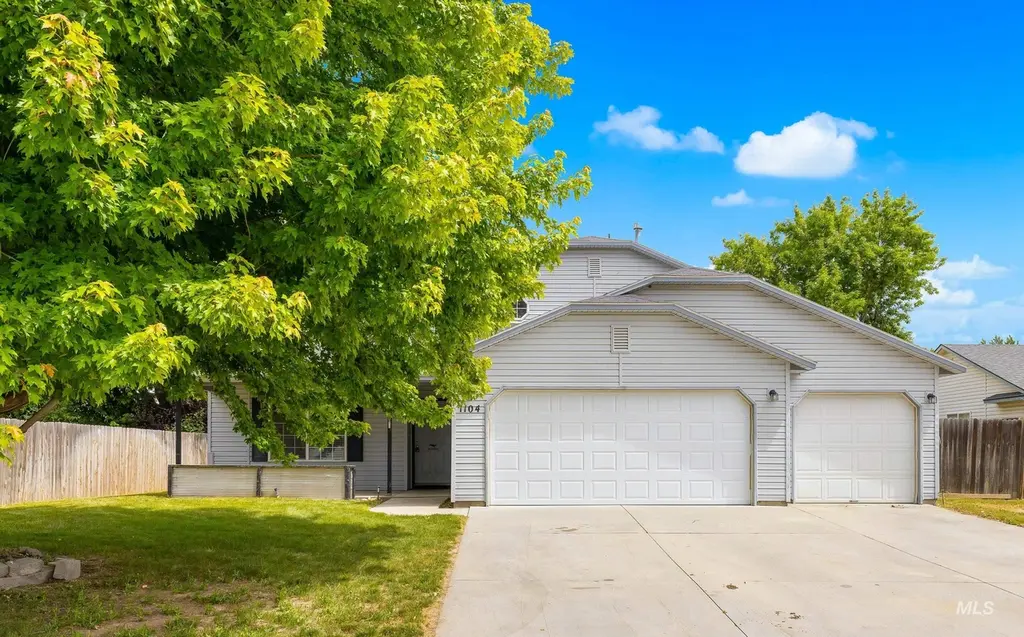
1104 Valley Ct · Middleton, ID
Flood risk 5/10 · Moderate
- FEMA flood zone
- X (unshaded)
- Chance of flooding over 30 yrs
- 0.64%
- Est. flood insurance / yr
- $507 – $1,088
Fire risk 5/10 · Moderate
- Est. fire insurance / yr
- $584 – $1,086
Heat risk 5/10 · Moderate
- Hot days now (above 98°F)
- 7 days/yr
- Hot days in 30 yrs
- 18 days/yr
Wind risk 1/10 · Minimal
- Chance of severe wind over 30 yrs
- —
Air-quality risk 8/10 · Major
- Unhealthy air days now
- 16 days/yr
- Unhealthy air days in 30 yrs
- 19 days/yr
Risk factors via First Street. Map © Google.
Why this score? — see what drove the D grade
The composite is a weighted blend of 9 inputs, each scored 0–100. Each bar is that input's sub-score; the figure is the points it added to the 100-point composite (weight × sub-score).
- Cash flow +14.3/30.0
- ARV discount +7.5/15.0
- DSCR +4.3/10.0
- Schools +4.3/10.0
- Livability +3.9/5.0
- 1% rule +2.9/10.0
- Rent growth +2.5/5.0
- Condition / age +2.5/5.0
- Appreciation +0.0/10.0
$334,000
🖨 Deal sheet (PDF) 📄 Offer letter ✓ Due diligence
Listing remarks
This is a rare find, similar homes have sold close to $400k. This one is a light fixer, needs paint, partial flooring, finish/trim work, landscape, a project that wont scare any DIY owner. Has recently new flooring downstairs, systems are all working, could qualify FHA. Huge . 37 acre lot with fenced area at the back for a garden, and a couple large shade trees. Potentially could have RV/trailer parking on the side, has space for it, plus a 3 car garage, master bedroom upstairs, other bedrooms downstairs, located around the corner from nice greenbelt/park area.
Key facts
- Fenced area
- Large shade trees
- Greenbelt park area
Tags
Property features AI
Finance
- HOA & community: Homeowners association with annual fee of $248
Exterior
- Parking: Attached garage with 3 covered parking spaces; RV access/parking
- Utilities: City water service; Sewer connected
- Home design: Single family residence; Built in 1999
- Construction: Frame construction with vinyl siding; Composition roof; Crawl space foundation
- Exterior features: Wood fencing; Garden; Automatic sprinkler system; Public road frontage
Interior
- Bedrooms: 4 bedrooms — master on upper level; remaining bedrooms on lower level
- Flooring: Carpet flooring
- Bathrooms: 2 bathrooms
- Heating & cooling: Forced air heating; Central air conditioning
- Interior features: Walk-in closets
Neighborhood map
What this means for you Summary
Snapshot
- This is a 4-bed/2.0-bath other listed at $334k.
Deal economics
- At list price, monthly cash flow is $60 ($721/yr) — positive.
- The deal already cash-flows at list — no discount required.
- To meet the 1% rule (rent ≥ 1% of price), the offer needs to be $263k (21.1% below list).
- Recommended offer: $263k (21.1% below list) — sets the bar for 1% rule.
- Cap rate 6.5% vs local median 2.5% in Middleton — top-decile yield for the area; either an underpriced asset or a hidden risk that comps aren't pricing in. Stress-test before assuming the spread holds.
Location & tenants
- Location reads 77/100 on livability (#22 in ID, #3,173 nationally) — a middle-class / working-renter tenant base. Strengths: crime A+, housing A+, health & safety A+; Watch: amenities F, commute F.
- Middleton District (suburban): math 41% / reading 58% proficiency, ranked #29 of 92 in ID (top 32%) — families likely to look elsewhere, expect single-tenant / working-renter base with shorter leases.
- Zoned schools: Middleton Mill Creek Elementary (math 52% / reading 60%, grade C+, #102 of 357 statewide, top 29%, 755 students, 18% FRL); Middleton Middle School (math 38% / reading 60%, grade C-, #34 of 109 statewide, top 34%, 1,007 students, 21% FRL); Middleton Academy (math 5% / reading 44%, grade F, #132 of 169 statewide, top 78%, 161 students, 34% FRL).
- Market conditions: 467 active listings in the ZIP; 2 comparable units currently listed for rent nearby; solid renter incomes; 3,620 units permitted in Canyon County in 2024 (196 in 5+ unit buildings).
- This rent runs 32% of the median local income ($97k/yr) — at the standard rent-burdened threshold; future hikes will face affordability resistance.
Forward outlook
- Local home prices are declining (-3.0%/yr); year-one equity from $2k of loan paydown is wiped out by about $10k of value loss. Plan a longer hold.
- Canyon County population projected at +41% by 2050 — long-run rental-demand tailwind backs the buy-and-hold thesis.
Negotiation context
- Only 1 days on market — expect competitive offers; lowballing is unlikely to land.
Risks & watch-outs
- Climate carrying-cost: moderate flood risk; moderate wildfire risk; extreme-heat days projected 7→18/yr by 2055 (HVAC capex compounding) — expect insurance premiums to compound above CPI over the hold.
Questions for the listing agent
- What does the HOA fee cover, when was the last increase, and are there any pending special assessments or reserve-fund shortfalls?
- Is there a deadline driving the sale (1031 exchange, divorce, estate, relocation)? That informs how much negotiation room exists.
- The area grade is low — what's the realistic commute time and amenity access for the typical tenant pool here? Any planned neighborhood developments (good or bad) we should know about?
- What's the average days-on-market for RENTAL listings here right now (not sales)? A rising rental-DOM trend means longer vacancies and softer asking-rent achievability than the comps imply.
- What's the recent tenant-quality profile in this submarket — average credit score on applications, eviction rate, late-payment / NSF rate, and stable-employment percentage? A property-management company in the area should have these aggregated.
- How much new for-sale + rental construction is in the pipeline within 1–3 miles? Heavy new supply typically softens prices + rents 12–24 months out; constrained supply supports both.
Investment metrics
- 1% rule
- 0.79% ✗
- Cap rate
- 6.51%
- Cash-on-cash
- 0.77%
- DSCR
- 1.03
- GRM
- 10.6
CMA / ARV
No comps found within radius.
Projected returns pro-forma
-3.0% appreciation · 3.0% rent growth · sell at horizon
- IRR
- -15.1%
- Equity multiple
- 0.46×
- Total profit
- $-50,433
- Equity at exit
- $49,800
- IRR
- -6.6%
- Equity multiple
- 0.58×
- Total profit
- $-39,546
- Equity at exit
- $28,878
Cash invested: $93,520 (down + closing). Projections, not guarantees.
Landlord ↔ Tenant lean methodology
- Overall (STATE)
- 91 Strongly Landlord-Friendly
- State Idaho
- 91 Strongly Landlord-Friendly · R+18
- County
- — inherits STATE
- City
- — inherits STATE
ZIP-level market 83644
- Active inventory
- 467
- Price-to-rent
- 10.6×
Monthly cashflow live
- Estimated rent
- $2,634 medium interval (Pro) →
- Mortgage (P&I)
- −$1,752
- Tax from tax record
- −$109 /mo · $1,309/yr
- Insurance
- −$139
- HOA
- −$21
- Vacancy / Maint / Mgmt
- −$553
- Net cashflow
- $60
Break-even live
Sensitivity live
| Price | -10% $249 | -5% $155 | +0% $60 | +5% $-34 | +10% $-129 |
|---|---|---|---|---|---|
| Rent | -10% $-148 | -5% $-44 | +0% $60 | +5% $164 | +10% $268 |
| Rate | -1.0pp $228 | -0.5pp $145 | base $60 | +0.5pp $-26 | +1.0pp $-115 |
UW: 25.0% down · 7.5% · 30yr · 1.5% tax · 5.0% vac · 8.0% maint · 8.0% mgmt
Financing live
Cash to close
- Down payment
- $83,500
- Closing costs
- $10,020
- Reserves months
- —
- Total cash needed
- —
Loan-product check · same deal, 3 products live
Conventional
25% down · 7.5% · 30yr
- Down + closing
- —
- Monthly P&I
- —
- Monthly cashflow
- —
- DSCR
- —
- Eligible?
- —
Personal DTI + credit; lowest rate.
DSCR
20% down · 8.5% · 30yr
- Down + closing
- —
- Monthly P&I
- —
- Monthly cashflow
- —
- DSCR
- —
- Eligible?
- —
No personal income docs; deal must DSCR.
Hard money
10% down · 12.0% · 12mo
- Down + closing
- —
- Monthly P&I
- —
- Monthly cashflow
- —
- DSCR
- —
- Eligible?
- —
Short-term bridge; refi at stabilization.
Rent comps 2 comps
| Address | Beds | Baths | Sqft | Rent | $/sqft | DOM | Units | Dist |
|---|---|---|---|---|---|---|---|---|
| 979 Peregrine Dr Middleton, ID | 3.0 | 2.0 | 1349 | $2,350 | $1.74 | 5d | 1 | 0.11mi |
| 10996 Willis Rd Middleton, ID | 3.0 | 2.0 | 1424 | $2,195 | $1.54 | 4d | 1 | 0.73mi |
HOA detail
- Monthly dues
- $21 · $252/yr
Listing history 3 events
-
2026-06-07status $334,000 Pending 1 DOM
-
2026-06-05remarks 567-char remark
-
2026-06-05$334,000 Active 1 DOM
ⓘ Source: listings_history table (triggers on properties + properties_extension) + one-shot
backfill from property_details.listing_events for pre-trigger history.
Tax reassessment forecast ID · Resets to sale price
- Current annual tax
- $1,309 · $109/mo
- Projected year-2 tax
- $2,305 · $192/mo
- Expected delta
- +$995/yr (+$83/mo · 76.0%)
ⓘ Screening estimate from a state-policy table — verify with the county assessor before closing.
Climate risk First Street
- Flood 5/10 Major FEMA zone X (unshaded) · 64% chance over 30 yrs
- Wildfire 5/10 Major
- Heat 5/10 Major 7 d/yr ≥98°F today · 18 d/yr by 30 yrs out
- Wind 1/10 Low
- Air quality 8/10 Severe 16 unhealthy d/yr today · 19 by 30 yrs out
Nearby sold comps map
Loading sold comps map…
Walkable amenities ~0.75 mi
Loading nearby amenities…
Taxation est. · year 1
- Rental income
- $31,608
- − Mortgage interest
- −$18,709
- − Property taxes
- −$1,309
- − Insurance
- −$1,670
- − Repairs & maintenance
- −$2,529
- − Management
- −$2,529
- − HOA
- −$252
- − Depreciation
- −$9,716
- Taxable loss
- −$5,106
- Est. tax savings @ 24.0%
- +$1,225
- After-tax cash flow
- $1,946/yr
For passive investors: Depreciation is non-cash, so a rental often shows a tax loss while cash-flowing — sheltering income. Rental losses are passive: they offset passive income freely, and up to $25,000/yr can offset ordinary (W-2) income if you actively participate and your MAGI is under $100k (phasing out to $0 by $150k); unused losses carry forward. On sale, claimed depreciation is recaptured at up to 25%, and gains may owe capital-gains tax (a 1031 exchange can defer both). Figures are a year-1 estimate at your 24.0% rate — not tax advice; consult a CPA.
Schools (NCES district)
- District
- Middleton District
- NCES district ID
- 1602130
- Math proficiency
- 41% ▼ -8.00%
- Reading proficiency
- 58% ▬ 0.00%
- Median HH income
- $53,089
- Composite
- 42.6/100
- National rank
- #3191
- State rank
- #29 of 92 in ID
Livability — Middleton
- Score
- 77/100
- State rank
- #22
- US rank
- #3173
Category grades
Schools grade is shown separately in the Schools card above.
Census & demographics
- Census place
- Middleton, ID
- County
- Canyon County · 235,358 people
- City population
- 16,293
- Metro
- Boise City, ID
- Population (ZIP)
- 16,293
- Household income
- $97,293
- Rent vs Own
- Severe rent burden
- 141.0
Population outlook (Canyon County) Hauer SSP2
- Today (2025)
- 248,853 people
- By 2030
- 269,596 · +8.3%
- By 2040
- 311,081 · +25.0%
- By 2050
- 350,809 · +41.0%
- By 2075
- 441,884 · +77.6%
- By 2100
- 505,641 · +103.2%
Race, ethnicity, and origin ACS 2023
- Neighborhood character
- Predominantly White (80%)
- Race & ethnicity
- White 80% Hispanic / Latino 12% Two or more races 8%
- Hispanic origin (detail)
- Mexican 11%
- Common ancestry
- Slovak 5% Portuguese 2% Iranian 2%
- Foreign-born
- 2% · Canada
- Languages at home
- 88% English-only · Spanish 9% Russian/Polish/Slavic 2% German/W. Germanic 1%
Political lean MEDSL · Canyon
- 2024 margin
- Solid R (+46.6) · D 25.4% · R 72.0% · Other 2.5%
- 2008→2024 swing
- -11.4pp toward R · 2008: -35.2pp · 2024: -46.6pp
- All cycles
- 2024: R+46.6 2020: R+39.7 2016: R+41.8 2012: R+37.1 2008: R+35.2
Not yet ingested
- Civics
- —
Market trends
- HPI YoY
- ▼ -159.72%
- Current HPI
- 295.3575
- Rent YoY
- —
- Metro
- Boise City, ID
- State GDP YoY
- ▲ 4.51%
- F500 in state
- 6
Industry mix (Fortune 500 HQ in ID)
| Industry | F500 HQs | Revenue |
|---|---|---|
| Retail | 1 | $79B |
|
||
| Technology | 1 | $25B |
|
||
| Food / Agriculture | 1 | $6B |
|
||
Price history
5 events — show timeline
- 2026-06-04 Listed $334,000 IMLS
- 2026-04-23 Sold (Public Records) — Public Records
- 2020-01-03 Sold (Public Records) — Public Records
- 2015-11-13 Sold (Public Records) — Public Records
- 2013-05-16 Sold (Public Records) — Public Records
Property tax history
-4.3%/yrLatest (2025): $1,309 · +5.2% YoY. Source: county tax records.
Cash-flow waterfall
monthlySold comps — $/sqft
last 12 mo · ≤1 miLoading sold comps…