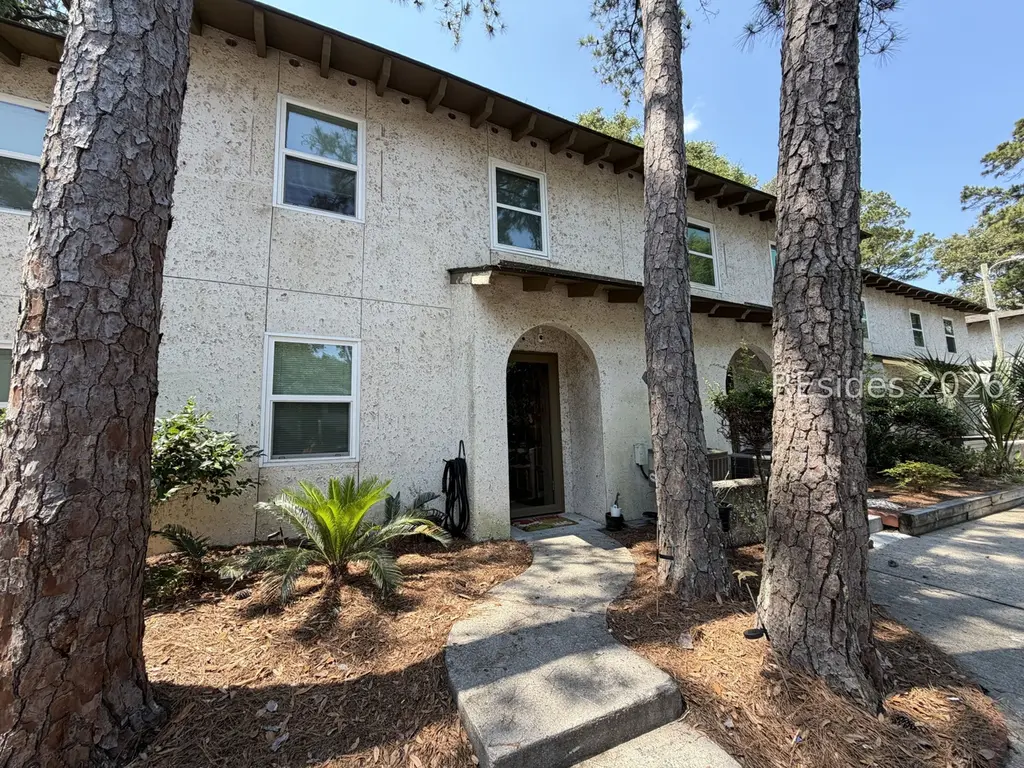
400 Wm Hilton Pkwy #54 · Hilton Head Island, SC
Flood risk 4/10 · Minor
- FEMA flood zone
- X (unshaded)
- Chance of flooding over 30 yrs
- 0.17%
- Est. flood insurance / yr
- $507 – $1,088
Fire risk 1/10 · Minimal
- Est. fire insurance / yr
- $783 – $1,453
Heat risk 10/10 · Severe
- Hot days now (above 106°F)
- 7 days/yr
- Hot days in 30 yrs
- 19 days/yr
Wind risk 9/10 · Severe
- Chance of severe wind over 30 yrs
- 99.0%
Air-quality risk 2/10 · Minimal
- Unhealthy air days now
- 2 days/yr
- Unhealthy air days in 30 yrs
- 2 days/yr
Risk factors via First Street. Map © Google.
Why this score? — see what drove the D grade
The composite is a weighted blend of 9 inputs, each scored 0–100. Each bar is that input's sub-score; the figure is the points it added to the 100-point composite (weight × sub-score).
- Cash flow +12.3/30.0
- ARV discount +7.5/15.0
- 1% rule +5.5/10.0
- Schools +4.1/10.0
- DSCR +3.7/10.0
- Livability +3.2/5.0
- Rent growth +2.5/5.0
- Condition / age +2.5/5.0
- Appreciation +0.0/10.0
$274,990
🖨 Deal sheet 📄 Offer letter ✓ Due diligence
Listing remarks MLS
Least expensive 3BR villa on Hilton Head with long term tenants in place who want to stay. This is a fabulous investment opportunity for businesses looking for workforce housing. Centrally located on Hilton Head Island close to schools, shops, hospital and the beach. Possible owner financing with 20% down.
Key facts
- Deep sink
- Deluxe shower system
- Barn door
Tags
Property features AI
Finance
- Other: Pets allowed with restrictions and breed restrictions
- HOA & community: Association manages common areas and structure maintenance; Association provides insurance, pest control, trash and water; Association amenities include pool, tennis courts, pickleball and playground
Exterior
- Parking: Assigned parking
- Utilities: Public water
- Home design: 2-story property; Faces east
- Construction: Block and stucco construction; Asphalt roof
- Exterior features: Balcony; Courtyard; Patio; Community free-form pool
Interior
- Kitchen: Dishwasher; Microwave; Range; Refrigerator
- Flooring: Carpet; Luxury vinyl; Luxury vinyl plank; Tile
- Bathrooms: 2 full bathrooms; 1 half bathroom
- Heating & cooling: Heat pump heating; Heat pump cooling
- Interior features: Unfurnished; Built-in features; Ceiling fans; Smooth ceilings; Primary bedroom on upper level
- Laundry & utility: Washer; Laundry room; Utility room
Neighborhood map
What this means for you Summary
Snapshot
- This is a 3-bed/2.5-bath condo listed at $275k.
Deal economics
- At list price, monthly cash flow is $-50 ($-595/yr) — negative.
- The deal already cash-flows at list — no discount required.
- Meets the 1% rule at list price ($3k rent vs $275k).
- Cap rate 6.1% vs local median 3.0% in Hilton Head Island — top-decile yield for the area; either an underpriced asset or a hidden risk that comps aren't pricing in. Stress-test before assuming the spread holds.
Location & tenants
- Location reads 64/100 on livability (#157 in SC) — a middle-class / working-renter tenant base. Strengths: employment A+, crime A-; Watch: amenities F, commute F, cost of living F.
- Beaufort 01 (town): math 42% / reading 51% proficiency, ranked #17 of 80 in SC (top 21%) — families likely to look elsewhere, expect single-tenant / working-renter base with shorter leases.
- Market conditions: Rents soft (-0.2%/yr); 385 active listings in the ZIP; 9 comparable units currently listed for rent nearby; rentals leasing fast (median 13d on market — plan ~1-2 weeks tenant-placement turnaround); solid renter incomes; 1,824 units permitted in Beaufort County in 2024 (618 in 5+ unit buildings).
- This rent runs 35% of the median local income ($98k/yr) — at the standard rent-burdened threshold; future hikes will face affordability resistance.
Forward outlook
- Local home prices are declining (-3.0%/yr); year-one equity from $2k of loan paydown is wiped out by about $8k of value loss. Plan a longer hold.
- Beaufort County population projected at +30% by 2050 — long-run rental-demand tailwind backs the buy-and-hold thesis.
Negotiation context
- Only 6 days on market — expect competitive offers; lowballing is unlikely to land.
- 5 sale attempts since 19y ago with the ask held roughly flat each time — persistent listings suggest the price (not the market) is what's stuck; bring a comps-based counter.
- Current owner paid $78k; list at $275k implies a 254% gain — meaningful room to come down on a strong offer.
Risks & watch-outs
- Watch-outs: HOA is 20% of rent.
- Climate carrying-cost: severe wind risk, 99% chance of damaging wind over 30y; extreme-heat days projected 7→19/yr by 2055 (HVAC capex compounding) — expect insurance premiums to compound above CPI over the hold.
Questions for the listing agent
- What do current leases actually rent for vs. the listed asking? Can we see a recent rent roll and the last 12 months of T-12 income?
- Built in 1978 — when were the roof, HVAC, electrical panel, plumbing, and water heater last replaced?
- What does the HOA fee cover, when was the last increase, and are there any pending special assessments or reserve-fund shortfalls?
- Any open or pending special assessments — roof, HVAC, plumbing, elevator, façade? What's the per-unit balance and payoff schedule, and is the seller paying it off at close or rolling it to the buyer?
- Is there a deadline driving the sale (1031 exchange, divorce, estate, relocation)? That informs how much negotiation room exists.
- Schools are B-rated — typically a magnet for longer-tenancy family renters. What's the average tenant stay here, and is there a school-zone premium baked into asking?
- The area grade is low — what's the realistic commute time and amenity access for the typical tenant pool here? Any planned neighborhood developments (good or bad) we should know about?
- What's the average days-on-market for RENTAL listings here right now (not sales)? A rising rental-DOM trend means longer vacancies and softer asking-rent achievability than the comps imply.
- What's the recent tenant-quality profile in this submarket — average credit score on applications, eviction rate, late-payment / NSF rate, and stable-employment percentage? A property-management company in the area should have these aggregated.
- How much new apartment / multifamily construction is in the pipeline within 1–3 miles? Heavy new supply (>2% of stock underway) typically softens rents 12–24 months out; light construction supports rent growth.
Investment metrics
- 1% rule
- 1.05% ✓
- Cap rate
- 6.08%
- Cash-on-cash
- -0.77%
- DSCR
- 0.97
- GRM
- 8.0
CMA / ARV
No comps found within radius.
Projected returns pro-forma
-3.0% appreciation · 0.0% rent growth · sell at horizon
- IRR
- -21.7%
- Equity multiple
- 0.27×
- Total profit
- $-55,854
- Equity at exit
- $41,002
- IRR
- -28.1%
- Equity multiple
- -0.09×
- Total profit
- $-84,079
- Equity at exit
- $23,776
Cash invested: $76,997 (down + closing). Projections, not guarantees.
Landlord ↔ Tenant lean methodology
- Overall (STATE)
- 90 Strongly Landlord-Friendly
- State South Carolina
- 90 Strongly Landlord-Friendly · R+6
- County
- — inherits STATE
- City
- — inherits STATE
ZIP-level market 29926
- Home prices YoY
- -26.7%
- Rents YoY
- -0.2%
- Active inventory
- 385
- Price-to-rent
- 8.0×
Monthly cashflow live
- Estimated rent
- $2,879 high interval (Pro) →
- Mortgage (P&I)
- −$1,442
- Tax from tax record
- −$179 /mo · $2,153/yr
- Insurance
- −$115
- HOA est. from 4 same-building comps
- −$588
- Vacancy / Maint / Mgmt
- −$605
- Net cashflow
- $-50
Break-even live
UW: 25.0% down · 7.5% · 30yr · 1.5% tax · 5.0% vac · 8.0% maint · 8.0% mgmt
Financing live
Cash to close
- Down payment
- $68,748
- Closing costs
- $8,250
- Reserves months
- —
- Total cash needed
- —
Loan-product check · same deal, 3 products live
Conventional
25% down · 7.5% · 30yr
- Down + closing
- —
- Monthly P&I
- —
- Monthly cashflow
- —
- DSCR
- —
- Eligible?
- —
Personal DTI + credit; lowest rate.
DSCR
20% down · 8.5% · 30yr
- Down + closing
- —
- Monthly P&I
- —
- Monthly cashflow
- —
- DSCR
- —
- Eligible?
- —
No personal income docs; deal must DSCR.
Hard money
10% down · 12.0% · 12mo
- Down + closing
- —
- Monthly P&I
- —
- Monthly cashflow
- —
- DSCR
- —
- Eligible?
- —
Short-term bridge; refi at stabilization.
Rent comps 9 comps
| Address | Beds | Baths | Sqft | Rent | $/sqft | DOM | Units | Dist |
|---|---|---|---|---|---|---|---|---|
| 400 William Hilton Pkwy Hilton Head Island, SC | 2.0 | 1.5 | 1161 | $2,000 | $1.72 | 43d | 1 | 0.02mi |
| 55 Gardner Dr Hilton Head Island, SC | 1.0–3.0 | 1.0–2.0 | 1175 | $3,481 | $2.96 | 13d | 9 | 0.19mi |
| 96 Mathews Dr Hilton Head Island, SC | 2.0 | 2.0–2.5 | 1000 | $2,500 | $2.50 | 20d | 2 | 0.27mi |
| 96 Mathews Dr Hilton Head Island, SC | 2.0 | 2.0 | 1012 | $2,400 | $2.37 | 13d | 2 | 0.27mi |
| 96 Mathews Dr #87 Hilton Head Island, SC | 2.0 | 2.0 | 1000 | $2,500 | $2.50 | 43d | 1 | 0.29mi |
| 112 Union Cemetery Rd Hilton Head Island, SC | 2.0 | 2.0 | 1025 | $2,125 | $2.07 | 13d | 1 | 1.02mi |
| 45 Folly Field Rd Unit 1316251P Hilton Head Island, SC | 2.0 | 2.0 | 1194 | $4,182 | $3.50 | 20d | 1 | 1.21mi |
| 3 Burkes Beach Rd Unit B Hilton Head Island, SC | 2.0 | 2.0 | 1100 | $2,500 | $2.27 | 13d | 1 | 1.30mi |
| 85 Folly Field Rd Unit 1316236P Hilton Head Island, SC | 2.0 | 2.5 | 1194 | $3,602 | $3.02 | 13d | 1 | 1.45mi |
HOA detail condo
- Monthly dues
- $0 · $0/yr
- Assessments
- None detected in remarks — confirm with the listing agent.
Listing history 6 events
-
2026-06-18days on market $274,990 Active 6 DOM
-
2026-06-17days on market $274,990 Active 5 DOM
-
2026-06-16days on market $274,990 Active 4 DOM
-
2026-06-15days on market $274,990 Active 3 DOM
-
2026-06-13remarks 679-char remark
-
2026-06-13$274,990 Active 1 DOM
ⓘ Source: listings_history table (triggers on properties + properties_extension) + one-shot
backfill from property_details.listing_events for pre-trigger history.
Tax reassessment forecast SC · Resets to sale price
- Current annual tax
- $2,153 · $179/mo
- Projected year-2 tax
- $2,153 · $179/mo
- Expected delta
- $0/yr ($0/mo · 0.0%)
ⓘ Screening estimate from a state-policy table — verify with the county assessor before closing.
Climate risk First Street
- Flood 4/10 Moderate FEMA zone X (unshaded) · 17% chance over 30 yrs
- Wildfire 1/10 Low
- Heat 10/10 Extreme 7 d/yr ≥106°F today · 19 d/yr by 30 yrs out
- Wind 9/10 Extreme 99% chance of damaging wind over 30 yrs
- Air quality 2/10 Low 2 unhealthy d/yr today · 2 by 30 yrs out
Nearby sold comps map
Loading sold comps map…
Walkable amenities ~0.75 mi
Loading nearby amenities…
Taxation est. · year 1
- Rental income
- $34,548
- − Mortgage interest
- −$15,404
- − Property taxes
- −$2,153
- − Insurance
- −$1,375
- − Repairs & maintenance
- −$2,764
- − Management
- −$2,764
- − HOA
- −$7,056
- − Depreciation
- −$8,000
- Taxable loss
- −$4,967
- Est. tax savings @ 24.0%
- +$1,192
- After-tax cash flow
- $597/yr
For passive investors: Depreciation is non-cash, so a rental often shows a tax loss while cash-flowing — sheltering income. Rental losses are passive: they offset passive income freely, and up to $25,000/yr can offset ordinary (W-2) income if you actively participate and your MAGI is under $100k (phasing out to $0 by $150k); unused losses carry forward. On sale, claimed depreciation is recaptured at up to 25%, and gains may owe capital-gains tax (a 1031 exchange can defer both). Figures are a year-1 estimate at your 24.0% rate — not tax advice; consult a CPA.
Schools (NCES district)
- District
- Beaufort 01
- NCES district ID
- 4501110
- Math proficiency
- 42% ▼ -8.00%
- Reading proficiency
- 51% ▲ 2.00%
- Median HH income
- $57,430
- Composite
- 40.56/100
- National rank
- #3699
- State rank
- #17 of 80 in SC
Livability — Hilton Head Island
- Score
- 64/100
- State rank
- #157
- US rank
- #14648
Category grades
Schools grade is shown separately in the Schools card above.
Census & demographics
- Census place
- Hilton Head Island, SC
- County
- Beaufort County · 163,770 people
- City population
- 40,243
- Metro
- Hilton Head Island-Bluffton, SC
- Population (ZIP)
- 24,458
- Household income
- $97,948
- Rent vs Own
- Severe rent burden
- 562.0
Population outlook (Beaufort County) Hauer SSP2
- Today (2025)
- 211,915 people
- By 2030
- 227,272 · +7.2%
- By 2040
- 253,861 · +19.8%
- By 2050
- 275,126 · +29.8%
- By 2075
- 311,022 · +46.8%
- By 2100
- 321,286 · +51.6%
Race, ethnicity, and origin ACS 2023
- Neighborhood character
- Predominantly White (70%)
- Race & ethnicity
- White 70% Hispanic / Latino 19% Two or more races 9% Black 8%
- Hispanic origin (detail)
- Mexican 13%
- Common ancestry
- Romanian 3% Slovak 3% Lithuanian 2%
- Foreign-born
- 14% · Canada, Jamaica
- Languages at home
- 82% English-only · Spanish 16% French/Haitian/Cajun 1% Other Indo-European 1%
Political lean MEDSL · Beaufort
- 2024 margin
- R (+14.5) · D 42.1% · R 56.6% · Other 1.2%
- 2008→2024 swing
- -3.7pp toward R · 2008: -10.8pp · 2024: -14.5pp
- All cycles
- 2024: R+14.5 2020: R+10.0 2016: R+14.3 2012: R+17.5 2008: R+10.8
Not yet ingested
- Civics
- —
Market trends
- HPI YoY
- ▼ -98.89%
- Current HPI
- 271.4783
- Rent YoY
- ▼ -0.16%
- Metro
- Hilton Head Island-Bluffton, SC
- State GDP YoY
- ▲ 4.51%
- F500 in state
- 2
Industry mix (Fortune 500 HQ in SC)
| Industry | F500 HQs | Revenue |
|---|---|---|
| Packaging | 1 | $7B |
|
||
Price history
+300.0% since first listed18 events — show timeline
- 2026-06-12 Listed $274,990 RSMLS
- 2018-11-07 Sold (Public Records) $77,703 Public Records
- 2018-11-01 Sold (MLS) $115,000 RSMLS
- 2018-04-16 Listed $119,000 RSMLS
- 2012-09-06 Sold (Public Records) $32,000 Public Records
- 2012-09-04 Sold (MLS) $32,000 RSMLS
- 2012-07-18 Listed $29,900 RSMLS
- 2012-02-29 Sold (MLS) $13,500 RSMLS
- 2012-01-20 Listed $18,000 RSMLS
- 2011-08-01 Sold (Public Records) $226,105 Public Records
- 2007-06-01 Sold (Public Records) $105,000 Public Records
- 2007-05-30 Sold (MLS) $105,000 RSMLS
- 2007-04-30 Listed $150,000 RSMLS
- 2004-04-16 Sold (Public Records) $55,000 Public Records
- 1996-07-01 Sold (Public Records) $39,000 Public Records
- 1993-09-01 Sold (Public Records) $23,000 Public Records
- 1990-04-27 Sold (Public Records) $76,000 Public Records
- 1983-07-01 Sold (Public Records) $68,750 Public Records
Property tax history
+14.9%/yrLatest (2025): $2,153 · +1.5% YoY. Source: county tax records.
Cash-flow waterfall
monthlySold comps — $/sqft
last 12 mo · ≤1 miLoading sold comps…