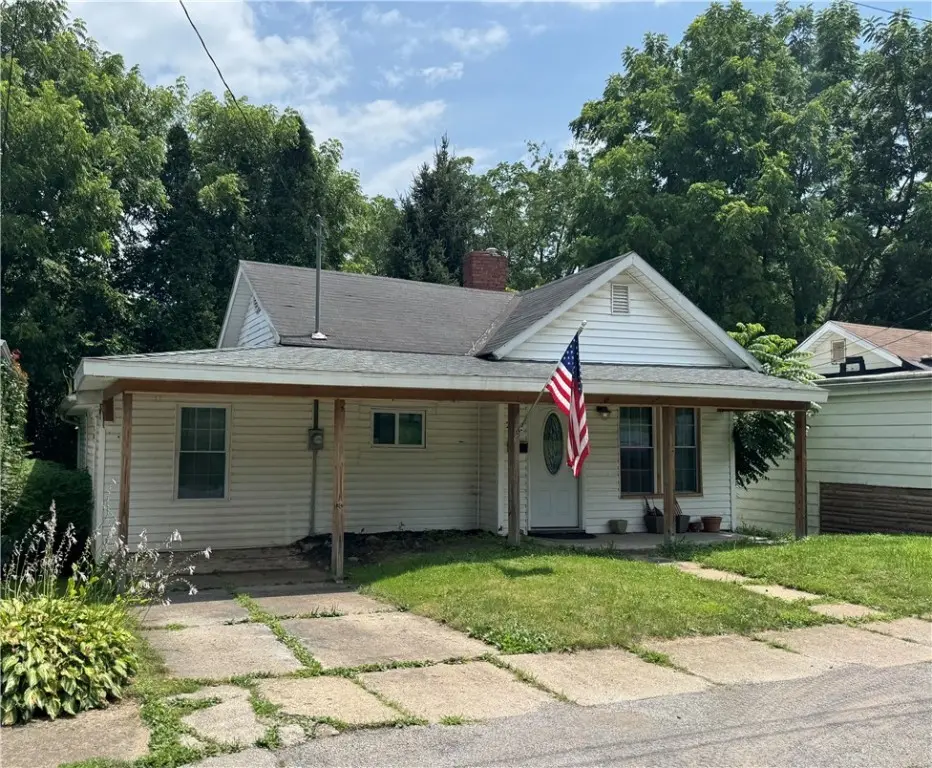
21 S Round St · Oakland, PA
Flood risk 1/10 · Minimal
- FEMA flood zone
- X (unshaded)
- Chance of flooding over 30 yrs
- 0.0%
- Est. flood insurance / yr
- $473 – $860
Fire risk 1/10 · Minimal
- Est. fire insurance / yr
- $511 – $949
Heat risk 3/10 · Minor
- Hot days now (above 98°F)
- 7 days/yr
- Hot days in 30 yrs
- 16 days/yr
Wind risk 1/10 · Minimal
- Chance of severe wind over 30 yrs
- 0.0%
Air-quality risk 2/10 · Minimal
- Unhealthy air days now
- 1 days/yr
- Unhealthy air days in 30 yrs
- 3 days/yr
Risk factors via First Street. Map © Google.
Why this score? — see what drove the B+ grade
The composite is a weighted blend of 9 inputs, each scored 0–100. Each bar is that input's sub-score; the figure is the points it added to the 100-point composite (weight × sub-score).
- Cash flow +30.0/30.0
- ARV discount +15.0/15.0
- 1% rule +10.0/10.0
- DSCR +10.0/10.0
- Rent growth +5.0/5.0
- Schools +4.2/10.0
- Livability +2.5/5.0
- Condition / age +2.5/5.0
- Appreciation +0.0/10.0
$79,900
🖨 Deal sheet 📄 Offer letter ✓ Due diligence
Listing remarks MLS
Great Investment or Starter Opportunity. This charming 2-bedroom home offers comfortable living with practical updates and a history of reliable rental income. Featuring a spacious oak kitchen, updated full bathroom, and convenient main floor laundry, it’s move-in ready with room to make it your own. Off-street parking adds extra value, while the manageable layout and low-maintenance exterior make it an ideal choice for investors or first-time buyers alike. Whether you're looking to expand your portfolio or find a place to call home, this property checks all the boxes.
Key facts
- Oak kitchen
- Off street parking
- Main floor laundry
Tags
Neighborhood map
What this means for you Summary
Snapshot
- This is a 3-bed/1.5-bath single-family listed at $80k.
Deal economics
- At list price, monthly cash flow is $485 ($6k/yr) — positive.
- The deal already cash-flows at list — no discount required.
- Meets the 1% rule at list price ($1k rent vs $80k).
- Recommended offer: $70k (12.0% below list) — sets the bar for market timing.
- Cap rate 13.6% vs local median 5.4% in Oakland — top-decile yield for the area; either an underpriced asset or a hidden risk that comps aren't pricing in. Stress-test before assuming the spread holds.
Location & tenants
- Location reads: area grade B — affects rentability + tenant quality, not the cash-flow math above.
- Union Area SD (town): math 40% / reading 59% proficiency, ranked #203 of 539 in PA (top 38%) — families likely to look elsewhere, expect single-tenant / working-renter base with shorter leases.
- Market conditions: Rents rising fast (+20.1%/yr); 118 active listings in the ZIP; 51 units permitted in Lawrence County in 2024 (0 in 5+ unit buildings).
Forward outlook
- Local home prices are declining (-3.0%/yr); year-one equity from $552 of loan paydown is wiped out by about $2k of value loss. Plan a longer hold.
- Lawrence County population projected at -25% by 2050 — secular population decline; favor cash flow + early exit over multi-decade hold.
- At projected returns (-3.0% appreciation + 8.0% rent growth), your $22k cash investment doubles in ~4 years — after that, you're playing with house money.
Negotiation context
- It's been on market 330 days — a 12% lower offer ($70k) is reasonable based on typical stale-listing flexibility.
- 2 sale attempts since 9y ago with the ask held roughly flat each time — persistent listings suggest the price (not the market) is what's stuck; bring a comps-based counter.
- Current owner paid $6k; list at $80k implies a 1129% gain — meaningful room to come down on a strong offer.
Risks & watch-outs
- Watch-outs: built in 1925 — expect roof / HVAC / electrical / plumbing capex.
Questions for the listing agent
- It's been on market 330 days. Have you received any prior offers? Is the seller open to a 12% concession, seller financing, or rate buy-down credit?
- Built in 1925 — when were the roof, HVAC, electrical panel, plumbing, and water heater last replaced?
- Why hasn't it sold? Are there any deal-killer items the seller is aware of (foundation, flood, title, zoning, code violations)?
- Is there a deadline driving the sale (1031 exchange, divorce, estate, relocation)? That informs how much negotiation room exists.
- What's the average days-on-market for RENTAL listings here right now (not sales)? A rising rental-DOM trend means longer vacancies and softer asking-rent achievability than the comps imply.
- What's the recent tenant-quality profile in this submarket — average credit score on applications, eviction rate, late-payment / NSF rate, and stable-employment percentage? A property-management company in the area should have these aggregated.
- How much new for-sale + rental construction is in the pipeline within 1–3 miles? Heavy new supply typically softens prices + rents 12–24 months out; constrained supply supports both.
Investment metrics
- 1% rule
- 1.57% ✓
- Cap rate
- 13.58%
- Cash-on-cash
- 26.01%
- DSCR
- 2.16
- GRM
- 5.3
CMA / ARV
- ARV (median comp)
- $119,883
- List price
- $79,900
- Delta
- -33.35%
- Verdict
- UNDERPRICED
- Comps
- 20 within 1.0 mi
Show comp detail 9 sales within ~0.75 mi
| Address | Dist | Beds/Ba | Sqft | Sold | Price | $/sf | Match |
|---|---|---|---|---|---|---|---|
| 1429 W Washington St | 0.23mi | 2/1.0 (-1) | 924 (+4%) | 9mo | $119,900 | $130 | 68 |
| 94 S Lee Ave | 0.21mi | 2/1.0 (-1) | 805 (-9%) | 3mo | $59,900 | $74 | 66 |
| 89 S Lee Ave | 0.20mi | 3/1.0 | 767 (-14%) | 7mo | $18,000 | $23 | 60 |
| 1006 Matilda Ave | 0.28mi | 2/1.0 (-1) | 952 (+7%) | 13mo | $117,000 | $123 | 57 |
| 1920 Robinwood St | 0.69mi | 2/1.0 (-1) | 952 (+7%) | 1mo | $95,000 | $100 | 48 |
| 105 Grandview Ave | 0.64mi | 2/1.0 (-1) | 883 (-1%) | 17mo | $82,316 | $93 | 48 |
| 72 Bluff St | 0.54mi | 3/1.0 | 776 (-13%) | 14mo | $56,172 | $72 | 40 |
| 521 W Parkway St | 0.59mi | 2/1.0 (-1) | 942 (+6%) | 23mo | $37,000 | $39 | 36 |
| 1927 W Washington St | 0.71mi | 2/1.0 (-1) | 1,000 (+13%) | 8mo | $135,000 | $135 | 32 |
Match score weights: distance 35% · size 25% · config 20% · recency 20%. Top-matched comps best support the ARV.
Projected returns pro-forma
-3.0% appreciation · 8.0% rent growth · sell at horizon
- IRR
- 25.0%
- Equity multiple
- 2.10×
- Total profit
- $24,579
- Equity at exit
- $11,913
- IRR
- 35.7%
- Equity multiple
- 5.09×
- Total profit
- $91,400
- Equity at exit
- $6,908
Cash invested: $22,372 (down + closing). Projections, not guarantees.
Landlord ↔ Tenant lean methodology
- Overall (STATE)
- 62 Landlord-Friendly
- State Pennsylvania
- 62 Landlord-Friendly · EVEN
- County
- — inherits STATE
- City
- — inherits STATE
ZIP-level market 16101
- Home prices YoY
- -26.3%
- Rents YoY
- 20.1%
- Active inventory
- 118
- Price-to-rent
- 5.3×
Monthly cashflow live
- Estimated rent
- $1,258 medium interval (Pro) →
- Mortgage (P&I)
- −$419
- Tax from tax record
- −$57 /mo · $679/yr
- Insurance
- −$33
- HOA
- −$0
- Vacancy / Maint / Mgmt
- −$264
- Net cashflow
- $485
Break-even live
UW: 25.0% down · 7.5% · 30yr · 1.5% tax · 5.0% vac · 8.0% maint · 8.0% mgmt
Financing live
Cash to close
- Down payment
- $19,975
- Closing costs
- $2,397
- Reserves months
- —
- Total cash needed
- —
Loan-product check · same deal, 3 products live
Conventional
25% down · 7.5% · 30yr
- Down + closing
- —
- Monthly P&I
- —
- Monthly cashflow
- —
- DSCR
- —
- Eligible?
- —
Personal DTI + credit; lowest rate.
DSCR
20% down · 8.5% · 30yr
- Down + closing
- —
- Monthly P&I
- —
- Monthly cashflow
- —
- DSCR
- —
- Eligible?
- —
No personal income docs; deal must DSCR.
Hard money
10% down · 12.0% · 12mo
- Down + closing
- —
- Monthly P&I
- —
- Monthly cashflow
- —
- DSCR
- —
- Eligible?
- —
Short-term bridge; refi at stabilization.
Listing history 23 events
-
2026-06-19days on market $79,900 Active 330 DOM
-
2026-06-18days on market $79,900 Active 329 DOM
-
2026-06-17days on market $79,900 Active 328 DOM
-
2026-06-16days on market $79,900 Active 327 DOM
-
2026-06-15days on market $79,900 Active 326 DOM
-
2026-06-14days on market $79,900 Active 324 DOM
-
2026-06-12days on market $79,900 Active 323 DOM
-
2026-06-09days on market $79,900 Active 320 DOM
-
2026-06-08days on market $79,900 Active 319 DOM
-
2026-06-07days on market $79,900 Active 318 DOM
-
2026-06-05days on market $79,900 Active 315 DOM
-
2026-06-02days on market $79,900 Active 313 DOM
-
2026-06-01days on market $79,900 Active 312 DOM
-
2026-05-31days on market $79,900 Active 311 DOM
-
2026-05-30days on market $79,900 Active 310 DOM
-
2025-07-24$79,900 Active 581-char remark
Show marketing remark (581 chars)
Great Investment or Starter Opportunity. This charming 2-bedroom home offers comfortable living with practical updates and a history of reliable rental income. Featuring a spacious oak kitchen, updated full bathroom, and convenient main floor laundry, it’s move-in ready with room to make it your own. Off-street parking adds extra value, while the manageable layout and low-maintenance exterior make it an ideal choice for investors or first-time buyers alike. Whether you're looking to expand your portfolio or find a place to call home, this property checks all the boxes.
-
2018-04-18soldstatus $6,500
-
2017-04-04price $6,500 256-char remark
Show marketing remark (256 chars)
The interior needs an entire redo. Kitchen cabinets remain. Exterior walls are panelling. Some remodel started but not finished. Furnace looks newer and so do some windows. Covered front porch. Great for a handy man to finish and live in or use for income.
-
2017-03-17soldstatus $6,500 Sold 256-char remark
Show marketing remark (256 chars)
The interior needs an entire redo. Kitchen cabinets remain. Exterior walls are panelling. Some remodel started but not finished. Furnace looks newer and so do some windows. Covered front porch. Great for a handy man to finish and live in or use for income.
-
2017-02-17status Under Contract 256-char remark
Show marketing remark (256 chars)
The interior needs an entire redo. Kitchen cabinets remain. Exterior walls are panelling. Some remodel started but not finished. Furnace looks newer and so do some windows. Covered front porch. Great for a handy man to finish and live in or use for income.
-
2017-02-17price $13,000 256-char remark
Show marketing remark (256 chars)
The interior needs an entire redo. Kitchen cabinets remain. Exterior walls are panelling. Some remodel started but not finished. Furnace looks newer and so do some windows. Covered front porch. Great for a handy man to finish and live in or use for income.
-
2017-01-12$13,000 Active 256-char remark
Show marketing remark (256 chars)
The interior needs an entire redo. Kitchen cabinets remain. Exterior walls are panelling. Some remodel started but not finished. Furnace looks newer and so do some windows. Covered front porch. Great for a handy man to finish and live in or use for income.
-
2007-10-02soldstatus $12,000
ⓘ Source: listings_history table (triggers on properties + properties_extension) + one-shot
backfill from property_details.listing_events for pre-trigger history.
Tax reassessment forecast PA · Partial reset (capped growth)
- Current annual tax
- $679 · $57/mo
- Projected year-2 tax
- $971 · $81/mo
- Expected delta
- +$292/yr (+$24/mo · 42.9%)
ⓘ Screening estimate from a state-policy table — verify with the county assessor before closing.
Climate risk First Street
- Flood 1/10 Low FEMA zone X (unshaded) · 0% chance over 30 yrs
- Wildfire 1/10 Low
- Heat 3/10 Moderate 7 d/yr ≥98°F today · 16 d/yr by 30 yrs out
- Wind 1/10 Low 0% chance of damaging wind over 30 yrs
- Air quality 2/10 Low 1 unhealthy d/yr today · 3 by 30 yrs out
Nearby sold comps map
Loading sold comps map…
Walkable amenities ~0.75 mi
Loading nearby amenities…
Taxation est. · year 1
- Rental income
- $15,096
- − Mortgage interest
- −$4,476
- − Property taxes
- −$679
- − Insurance
- −$400
- − Repairs & maintenance
- −$1,208
- − Management
- −$1,208
- − Depreciation
- −$2,324
- Taxable income
- $4,802
- Est. tax owed @ 24.0%
- −$1,152
- After-tax cash flow
- $4,667/yr
For passive investors: Depreciation is non-cash, so a rental often shows a tax loss while cash-flowing — sheltering income. Rental losses are passive: they offset passive income freely, and up to $25,000/yr can offset ordinary (W-2) income if you actively participate and your MAGI is under $100k (phasing out to $0 by $150k); unused losses carry forward. On sale, claimed depreciation is recaptured at up to 25%, and gains may owe capital-gains tax (a 1031 exchange can defer both). Figures are a year-1 estimate at your 24.0% rate — not tax advice; consult a CPA.
Schools (NCES district)
- District
- Union Area SD
- NCES district ID
- 4224060
- Math proficiency
- 40% ▼ -13.00%
- Reading proficiency
- 59% ▼ -8.00%
- Median HH income
- $42,958
- Composite
- 41.62/100
- National rank
- #3432
- State rank
- #203 of 539 in PA
Livability — Oakland
No livability data for this city. (Only ~50 U.S. cities are tracked.)
Census & demographics
- Census place
- Oakland, PA
- County
- Lawrence County · 30,767 people
- Metro
- New Castle, PA
- Population (ZIP)
- 30,767
- Household income
- $51,128
- Rent vs Own
- Severe rent burden
- 1047.0
Population outlook (Lawrence County) Hauer SSP2
- Today (2025)
- 81,781 people
- By 2030
- 77,978 · -4.7%
- By 2040
- 69,522 · -15.0%
- By 2050
- 61,344 · -25.0%
- By 2075
- 45,027 · -44.9%
- By 2100
- 31,305 · -61.7%
Race, ethnicity, and origin ACS 2023
- Neighborhood character
- Predominantly White (82%)
- Race & ethnicity
- White 82% Two or more races 8% Black 7% Hispanic / Latino 3%
- Common ancestry
- Romanian 7% Serbian 3% Iranian 1%
- Foreign-born
- 2% · Canada
- Languages at home
- 96% English-only · Spanish 2% Other Indo-European 1%
Political lean MEDSL · Lawrence
- 2024 margin
- Solid R (+33.8) · D 32.8% · R 66.5%
- 2008→2024 swing
- -28.7pp toward R · 2008: -5.1pp · 2024: -33.8pp
- All cycles
- 2024: R+33.8 2020: R+29.6 2016: R+28.1 2012: R+9.0 2008: R+5.1
Not yet ingested
- Civics
- —
Market trends
- HPI YoY
- ▼ -56.77%
- Current HPI
- 159.3091
- Rent YoY
- ▲ 20.05%
- Metro
- New Castle, PA
- State GDP YoY
- ▲ 1.68%
- F500 in state
- 34
Industry mix (Fortune 500 HQ in PA)
| Industry | F500 HQs | Revenue |
|---|---|---|
| Healthcare | 2 | $309B |
|
||
| Insurance | 2 | $27B |
|
||
| Telecommunications / Media | 1 | $124B |
|
||
| Industrial Distribution | 1 | $22B |
|
||
| Financial Services | 1 | $20B |
|
||
| Chemicals / Materials | 1 | $18B |
|
||
Price history
+565.8% since first listed8 events — show timeline
- 2025-07-24 Listed $79,900 West Penn MLS
- 2018-04-18 Sold (Public Records) $6,500 Public Records
- 2017-04-04 Price Changed $6,500 West Penn MLS
- 2017-03-17 Sold (MLS) $6,500 West Penn MLS
- 2017-02-17 Pending — West Penn MLS
- 2017-02-17 Price Changed $13,000 West Penn MLS
- 2017-01-12 Listed $13,000 West Penn MLS
- 2007-10-02 Sold (Public Records) $12,000 Public Records
Property tax history
+2.4%/yrLatest (2025): $679 · +4.0% YoY. Source: county tax records.
Cash-flow waterfall
monthlySold comps — $/sqft
last 12 mo · ≤1 miLoading sold comps…