941 E Elm St · Union City, OH
Flood risk 1/10 · Minimal
- FEMA flood zone
- X (unshaded)
- Chance of flooding over 30 yrs
- 0.0%
- Est. flood insurance / yr
- $507 – $1,088
Fire risk 1/10 · Minimal
- Est. fire insurance / yr
- $713 – $1,323
Heat risk 3/10 · Minor
- Hot days now (above 99°F)
- 7 days/yr
- Hot days in 30 yrs
- 18 days/yr
Wind risk 2/10 · Minimal
- Chance of severe wind over 30 yrs
- 1.0%
Air-quality risk 3/10 · Minor
- Unhealthy air days now
- 2 days/yr
- Unhealthy air days in 30 yrs
- 3 days/yr
Risk factors via First Street. Map © Google.
Why this score? — see what drove the A- grade
The composite is a weighted blend of 9 inputs, each scored 0–100. Each bar is that input's sub-score; the figure is the points it added to the 100-point composite (weight × sub-score).
- Cash flow +30.0/30.0
- 1% rule +10.0/10.0
- DSCR +10.0/10.0
- Appreciation +10.0/10.0
- ARV discount +7.5/15.0
- Schools +4.5/10.0
- Livability +3.2/5.0
- Rent growth +2.5/5.0
- Condition / age +2.5/5.0
$39,900
🖨 Deal sheet (PDF) 📄 Offer letter ✓ Due diligence
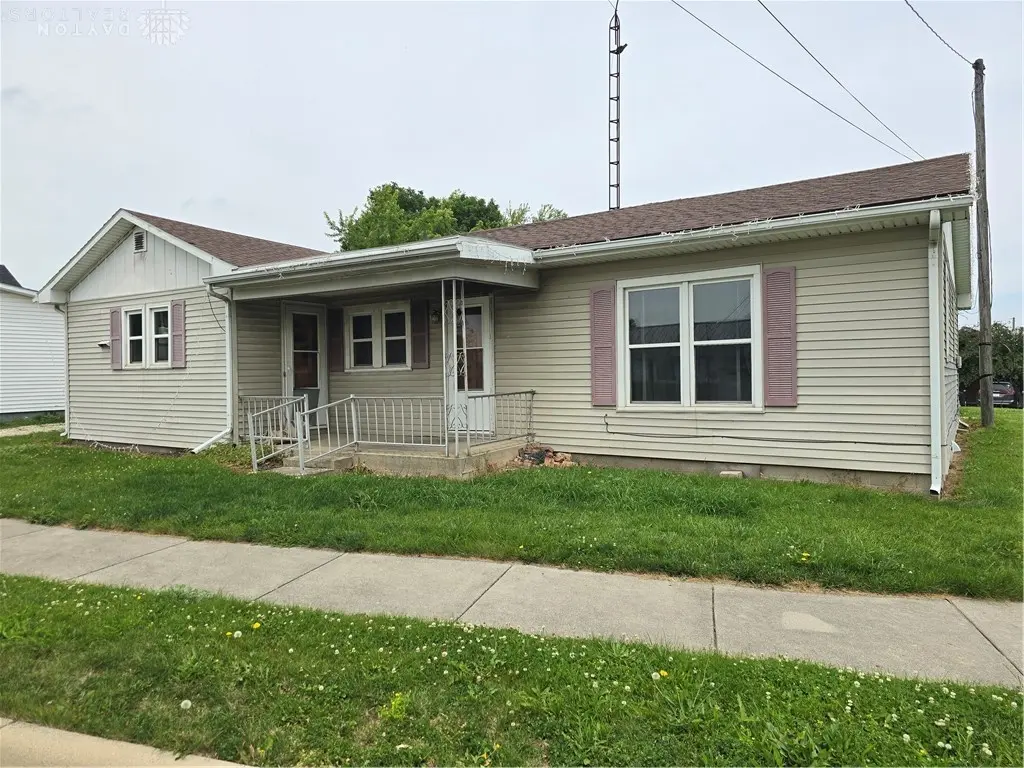
Listing remarks
Investor special! Fire-damaged 2-bedroom, 1.5-bath ranch home situated on a 0.19-acre lot in Union City. Property features an attached garage and is being sold strictly AS-IS. Fire damage reportedly affected the roof, attic, kitchen, garage door, and electrical components. Excellent opportunity for investors, contractors, or buyers looking for a rehabilitation project. Seller will make no repairs. Cash offers preferred. Buyer to perform all due diligence regarding condition, utilities, room sizes, and permitted uses.
Key facts
- 8,320 sq ft lot
- Built 1930
- Listed 9 days
Property features AI
Finance
- Financial info: Offered for sale
Exterior
- Parking: No garage
- Home design: Single-story framed residence; Slab foundation
- Construction: Frame construction; Slab foundation
- Exterior features: Residential lot approximately 0.19 acres (lot dimensions: 47 x 96 x 49 x 113)
Interior
- Bedrooms: Two bedrooms on the main level (approx. 10 x 10 and 12 x 12)
- Bathrooms: Two full bathrooms and one half bathroom; Two bathrooms located on the main level
- Interior features: One-level living
Neighborhood map
What this means for you Summary
Snapshot
- This is a 2-bed/2.5-bath single-family listed at $40k.
Deal economics
- At list price, monthly cash flow is $377 ($5k/yr) — positive.
- The deal already cash-flows at list — no discount required.
- Meets the 1% rule at list price ($841 rent vs $40k).
Location & tenants
- Location reads 63/100 on livability (#854 in OH) — a middle-class / working-renter tenant base. Strengths: cost of living A+, crime A, housing B; Watch: health & safety C-, amenities F, commute F.
- Mississinawa Valley Local (rural): math 56% / reading 51% proficiency, ranked #405 of 656 in OH (top 62%) — acceptable for families but not a draw, mixed tenant base, ~2y average lease; 70% free/reduced lunch — lower-income household profile, screen leases tightly.
- Zoned schools: Mississinawa Valley Elementary School (math 56% / reading 49%, grade C-, #846 of 1,584 statewide, top 54%, 316 students, 99% FRL); Mississinawa Valley Jr/Sr High School (math 57% / reading 57%, grade C, #275 of 781 statewide, top 37%, 280 students, 0% FRL) — zoned schools average 50% FRL vs 70% district-wide (20 pts lower); this property's tenant base skews higher-income than the district average.
- Market conditions: 15 active listings in the ZIP; 1 comparable units currently listed for rent nearby; 43 units permitted in Darke County in 2024 (0 in 5+ unit buildings).
Forward outlook
- In year one you build about $4k of equity ($276 loan paydown + $4k appreciation (10.0% local appreciation)).
- Darke County population projected at -20% by 2050 — secular population decline; favor cash flow + early exit over multi-decade hold.
- At projected returns (10.0% appreciation + 3.0% rent growth), your $11k cash investment doubles in ~2 years — after that, you're playing with house money.
- By year 7, paydown + projected appreciation supports a ~$31k cash-out refi (75% LTV) — recoverable capital for the next deal without selling this one.
Negotiation context
- Only 9 days on market — expect competitive offers; lowballing is unlikely to land.
Risks & watch-outs
- Watch-outs: built in 1930 — expect roof / HVAC / electrical / plumbing capex.
Questions for the listing agent
- Built in 1930 — when were the roof, HVAC, electrical panel, plumbing, and water heater last replaced?
- Is there a deadline driving the sale (1031 exchange, divorce, estate, relocation)? That informs how much negotiation room exists.
- What's the average days-on-market for RENTAL listings here right now (not sales)? A rising rental-DOM trend means longer vacancies and softer asking-rent achievability than the comps imply.
- What's the recent tenant-quality profile in this submarket — average credit score on applications, eviction rate, late-payment / NSF rate, and stable-employment percentage? A property-management company in the area should have these aggregated.
- How much new for-sale + rental construction is in the pipeline within 1–3 miles? Heavy new supply typically softens prices + rents 12–24 months out; constrained supply supports both.
Investment metrics
- 1% rule
- 2.11% ✓
- Cap rate
- 17.62%
- Cash-on-cash
- 40.47%
- DSCR
- 2.80
- GRM
- 4.0
CMA / ARV
- ARV (on-the-fly)
- $127,680
- Comps found
- 6
Show comp detail 6 sales within ~0.75 mi
| Address | Dist | Beds/Ba | Sqft | Sold | Price | $/sf | Match |
|---|---|---|---|---|---|---|---|
| 121 N Sycamore St | 0.39mi | 3/1.0 (+1) | 1,056 (-6%) | 1mo | $120,000 | $114 | 60 |
| 717 Lynwood Ct | 0.20mi | 3/1.5 (+1) | 1,107 (-1%) | 24mo | $129,900 | $117 | 60 |
| 119 N Sycamore St | 0.39mi | 3/1.0 (+1) | 1,016 (-9%) | 7mo | $110,000 | $108 | 50 |
| 543 N Walnut St | 0.55mi | 3/1.0 (+1) | 1,008 (-10%) | 6mo | $112,550 | $112 | 41 |
| 225 S State Line St | 0.71mi | 2/1.0 | 1,212 (+8%) | 18mo | $80,000 | $66 | 33 |
| 10077 State Road 47 | 0.63mi | 3/1.0 (+1) | 988 (-12%) | 17mo | $135,000 | $137 | 26 |
Match score weights: distance 35% · size 25% · config 20% · recency 20%. Top-matched comps best support the ARV.
Projected returns pro-forma
10.0% appreciation · 3.0% rent growth · sell at horizon
- IRR
- 55.6%
- Equity multiple
- 5.09×
- Total profit
- $45,745
- Equity at exit
- $35,945
- IRR
- 49.2%
- Equity multiple
- 11.37×
- Total profit
- $115,883
- Equity at exit
- $77,517
Cash invested: $11,172 (down + closing). Projections, not guarantees.
Landlord ↔ Tenant lean methodology
- Overall (STATE)
- 73 Landlord-Friendly
- State Ohio
- 73 Landlord-Friendly · R+6
- County
- — inherits STATE
- City
- — inherits STATE
ZIP-level market 45390
- Home prices YoY
- 5.1%
- Active inventory
- 15
- Price-to-rent
- 4.0×
Monthly cashflow live
- Estimated rent
- $841 medium interval (Pro) →
- Mortgage (P&I)
- −$209
- Tax from tax record
- −$62 /mo · $741/yr
- Insurance
- −$17
- HOA
- −$0
- Vacancy / Maint / Mgmt
- −$177
- Net cashflow
- $377
Break-even live
Sensitivity live
| Price | -10% $399 | -5% $388 | +0% $377 | +5% $365 | +10% $354 |
|---|---|---|---|---|---|
| Rent | -10% $310 | -5% $344 | +0% $377 | +5% $410 | +10% $443 |
| Rate | -1.0pp $397 | -0.5pp $387 | base $377 | +0.5pp $366 | +1.0pp $356 |
UW: 25.0% down · 7.5% · 30yr · 1.5% tax · 5.0% vac · 8.0% maint · 8.0% mgmt
Financing live
Cash to close
- Down payment
- $9,975
- Closing costs
- $1,197
- Reserves months
- —
- Total cash needed
- —
Loan-product check · same deal, 3 products live
Conventional
25% down · 7.5% · 30yr
- Down + closing
- —
- Monthly P&I
- —
- Monthly cashflow
- —
- DSCR
- —
- Eligible?
- —
Personal DTI + credit; lowest rate.
DSCR
20% down · 8.5% · 30yr
- Down + closing
- —
- Monthly P&I
- —
- Monthly cashflow
- —
- DSCR
- —
- Eligible?
- —
No personal income docs; deal must DSCR.
Hard money
10% down · 12.0% · 12mo
- Down + closing
- —
- Monthly P&I
- —
- Monthly cashflow
- —
- DSCR
- —
- Eligible?
- —
Short-term bridge; refi at stabilization.
Rent comps 1 comps
| Address | Beds | Baths | Sqft | Rent | $/sqft | DOM | Units | Dist |
|---|---|---|---|---|---|---|---|---|
| 310 N Walnut St Union City, IN | 1.0–2.0 | 1.0 | 750 | $841 | $1.12 | 45d | 1 | 0.97mi |
Listing history 8 events
-
2026-06-21days on market $39,900 Active 9 DOM
-
2026-06-21days on market $39,900 Active 8 DOM
-
2026-06-18days on market $39,900 Active 6 DOM
-
2026-06-17days on market $39,900 Active 5 DOM
-
2026-06-16days on market $39,900 Active 4 DOM
-
2026-06-15days on market $39,900 Active 3 DOM
-
2026-06-12remarks 522-char remark
-
2026-06-12$39,900 Active 1 DOM
ⓘ Source: listings_history table (triggers on properties + properties_extension) + one-shot
backfill from property_details.listing_events for pre-trigger history.
Tax reassessment forecast OH · Partial reset (capped growth)
- Current annual tax
- $741 · $62/mo
- Projected year-2 tax
- $741 · $62/mo
- Expected delta
- $0/yr ($0/mo · 0.0%)
ⓘ Screening estimate from a state-policy table — verify with the county assessor before closing.
Climate risk First Street
- Flood 1/10 Low FEMA zone X (unshaded) · 0% chance over 30 yrs
- Wildfire 1/10 Low
- Heat 3/10 Moderate 7 d/yr ≥99°F today · 18 d/yr by 30 yrs out
- Wind 2/10 Low 100% chance of damaging wind over 30 yrs
- Air quality 3/10 Moderate 2 unhealthy d/yr today · 3 by 30 yrs out
Nearby sold comps map
Loading sold comps map…
Walkable amenities ~0.75 mi
Loading nearby amenities…
Taxation est. · year 1
- Rental income
- $10,092
- − Mortgage interest
- −$2,235
- − Property taxes
- −$741
- − Insurance
- −$200
- − Repairs & maintenance
- −$807
- − Management
- −$807
- − Depreciation
- −$1,161
- Taxable income
- $4,141
- Est. tax owed @ 24.0%
- −$994
- After-tax cash flow
- $3,527/yr
For passive investors: Depreciation is non-cash, so a rental often shows a tax loss while cash-flowing — sheltering income. Rental losses are passive: they offset passive income freely, and up to $25,000/yr can offset ordinary (W-2) income if you actively participate and your MAGI is under $100k (phasing out to $0 by $150k); unused losses carry forward. On sale, claimed depreciation is recaptured at up to 25%, and gains may owe capital-gains tax (a 1031 exchange can defer both). Figures are a year-1 estimate at your 24.0% rate — not tax advice; consult a CPA.
Schools (NCES district)
- District
- Mississinawa Valley Local
- NCES district ID
- 3904667
- Math proficiency
- 56% ▼ -11.00%
- Reading proficiency
- 51% ▼ -13.00%
- Median HH income
- $40,999
- Composite
- 44.86/100
- National rank
- #2727
- State rank
- #405 of 656 in OH
Livability — Union City
- Score
- 63/100
- State rank
- #854
- US rank
- #15985
Category grades
Schools grade is shown separately in the Schools card above.
Census & demographics
- Census place
- Union City, OH
- County
- Darke · 50,606 people
- Population (ZIP)
- 3,349
- Household income
- $46,974
- Rent vs Own
- Severe rent burden
- 5.9
Population outlook (Darke County) Hauer SSP2
- Today (2025)
- 49,377 people
- By 2030
- 47,494 · -3.8%
- By 2040
- 43,553 · -11.8%
- By 2050
- 39,320 · -20.4%
- By 2075
- 30,091 · -39.1%
- By 2100
- 21,110 · -57.2%
Race, ethnicity, and origin ACS 2023
- Neighborhood character
- Predominantly White (88%)
- Race & ethnicity
- White 88% Hispanic / Latino 9% Two or more races 6% Asian 2%
- Hispanic origin (detail)
- Mexican 4% Cuban 4%
- Common ancestry
- Iranian 1% Slovak 1%
- Foreign-born
- 2% · Canada, China
- Languages at home
- 96% English-only · Spanish 2% Chinese 2%
Political lean MEDSL · Darke
- 2024 margin
- Solid R (+65.4) · D 17.0% · R 82.3%
- 2008→2024 swing
- -29.2pp toward R · 2008: -36.1pp · 2024: -65.4pp
- All cycles
- 2024: R+65.4 2020: R+63.6 2016: R+61.2 2012: R+44.9 2008: R+36.1
Not yet ingested
- Civics
- —
Market trends
- HPI YoY
- ▲ 13.15%
- Current HPI
- 270.1901
- Rent YoY
- —
- Metro
- —
- State GDP YoY
- ▲ 1.98%
- F500 in state
- 48
Industry mix (Fortune 500 HQ in OH)
| Industry | F500 HQs | Revenue |
|---|---|---|
| Insurance | 3 | $145B |
|
||
| Industrial Machinery | 3 | $49B |
|
||
| Financial Services | 3 | $24B |
|
||
| Consumer Goods | 2 | $93B |
|
||
| Aerospace / Defense | 2 | $47B |
|
||
| Utilities | 2 | $33B |
|
||
Price history
1 event — show timeline
- 2026-06-12 Listed $39,900 Dayton MLS
Property tax history
+4.6%/yrLatest (2025): $741 · -0.2% YoY. Source: county tax records.
Cash-flow waterfall
monthlySold comps — $/sqft
last 12 mo · ≤1 miLoading sold comps…