 🏷️ Likely Rental
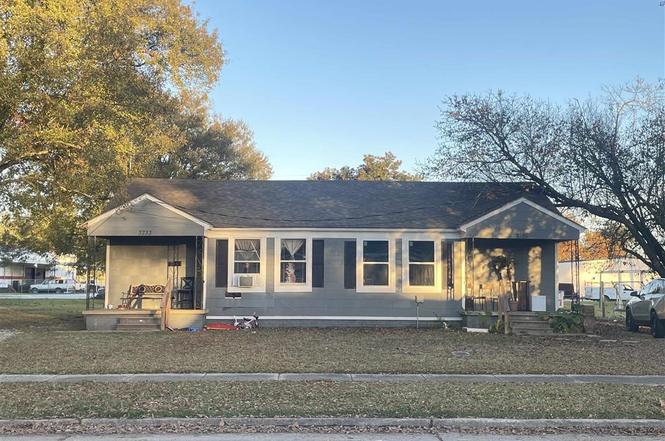
3733 & 3735 Harvard St · Lake Charles, LA
Flood risk 3/10 · Minor
- FEMA flood zone
- X (unshaded)
- Chance of flooding over 30 yrs
- 0.07%
- Est. flood insurance / yr
- $507 – $1,088
Fire risk 1/10 · Minimal
- Est. fire insurance / yr
- $1,269 – $2,357
Heat risk 9/10 · Severe
- Hot days now (above 109°F)
- 7 days/yr
- Hot days in 30 yrs
- 22 days/yr
Wind risk 9/10 · Severe
- Chance of severe wind over 30 yrs
- 99.0%
Air-quality risk 2/10 · Minimal
- Unhealthy air days now
- 1 days/yr
- Unhealthy air days in 30 yrs
- 1 days/yr
Risk factors via First Street. Map © Google.
Why this score? — see what drove the B+ grade
The composite is a weighted blend of 9 inputs, each scored 0–100. Each bar is that input's sub-score; the figure is the points it added to the 100-point composite (weight × sub-score).
- Cash flow +30.0/30.0
- ARV discount +15.0/15.0
- 1% rule +10.0/10.0
- DSCR +10.0/10.0
- Rent growth +4.6/5.0
- Livability +3.4/5.0
- Schools +3.1/10.0
- Condition / age +2.5/5.0
- Appreciation +0.0/10.0
$130,000
🖨 Deal sheet 📄 Offer letter ✓ Due diligence
Multi-family units
County records classify this as Multi-Family (2-4 Unit). Listing-text estimate: 2 units. confirmed
Listing remarks
Investment Opportunity – Tenant-Occupied Duplex. Income-producing duplex featuring two 1-bedroom, 1-bath units, each with a living room, dining area, kitchen, and full bath. Both units are currently tenant occupied, generating $750 per unit in monthly rental income. The property includes a storage building at the rear (given no value) and offers the added benefit of rear access backing up to Kirkman Street, providing additional accessibility and future flexibility. An excellent opportunity for investors seeking steady cash flow in a convenient location. Property is being sold AS IS. Inspections are for buyer’s informational purposes only. All measurements are M/L.
Key facts
- Kitchen
- Living room
- Dining area
Tags
Neighborhood map
What this means for you Summary
Snapshot
- This is a 2 × 1-bed/1.0-bath units multifamily listed at $130k.
Deal economics
- At list price, monthly cash flow is $687 ($8k/yr) — positive. Per door: $344/mo.
- The deal already cash-flows at list — no discount required.
- Meets the 1% rule at list price ($2k rent vs $130k).
- Recommended offer: $118k (9.0% below list) — sets the bar for market timing.
- Cap rate 12.6% vs local median 4.3% in Lake Charles — top-decile yield for the area; either an underpriced asset or a hidden risk that comps aren't pricing in. Stress-test before assuming the spread holds.
Location & tenants
- Location reads 68/100 on livability (#95 in LA) — a middle-class / working-renter tenant base. Strengths: commute A+, cost of living A+, housing A+; Watch: crime F, amenities F, employment D-.
- Calcasieu Parish (other): math 30% / reading 44% proficiency, ranked #29 of 98 in LA (top 30%) — families likely to look elsewhere, expect single-tenant / working-renter base with shorter leases.
- Market conditions: Rents rising fast (+8.6%/yr); 567 active listings in the ZIP; 10 comparable units currently listed for rent nearby; rentals at typical pace (median 21d on market — plan ~3-4 weeks tenant-placement turnaround); 40% of comp listings sitting > 30 days — soft ceiling on asking rent; 1,298 units permitted in Calcasieu Parish in 2024 (526 in 5+ unit buildings).
- This rent runs 40% of the median local income ($60k/yr) — at the standard rent-burdened threshold; future hikes will face affordability resistance.
Forward outlook
- Local home prices are declining (-3.0%/yr); year-one equity from $899 of loan paydown is wiped out by about $4k of value loss. Plan a longer hold.
- Calcasieu County population projected at +11% by 2050 — modest demand growth; plan on rents tracking national, not racing it.
- At projected returns (-3.0% appreciation + 8.0% rent growth), your $36k cash investment doubles in ~5 years — after that, you're playing with house money.
Negotiation context
- It's been on market 95 days — a 9% lower offer ($118k) is reasonable based on typical stale-listing flexibility.
Risks & watch-outs
- Climate carrying-cost: severe wind risk, 99% chance of damaging wind over 30y; extreme-heat days projected 7→22/yr by 2055 (HVAC capex compounding) — expect insurance premiums to compound above CPI over the hold.
Questions for the listing agent
- It's been on market 95 days. Have you received any prior offers? Is the seller open to a 9% concession, seller financing, or rate buy-down credit?
- Can we see the unit-by-unit rent roll, current vacancy, and any below-market leases? What's the average tenancy length?
- What capital expenditures (roof, boiler, parking lot, exteriors) have been made in the last 5 years, and what's planned in the next 2?
- Why hasn't it sold? Are there any deal-killer items the seller is aware of (foundation, flood, title, zoning, code violations)?
- Is there a deadline driving the sale (1031 exchange, divorce, estate, relocation)? That informs how much negotiation room exists.
- Schools are B-rated — typically a magnet for longer-tenancy family renters. What's the average tenant stay here, and is there a school-zone premium baked into asking?
- Crime grade is F in this area — have there been break-ins, vandalism, or insurance claims at this property in the last 3 years? What carrier currently insures it and at what premium?
- What's the average days-on-market for RENTAL listings here right now (not sales)? A rising rental-DOM trend means longer vacancies and softer asking-rent achievability than the comps imply.
- What's the recent tenant-quality profile in this submarket — average credit score on applications, eviction rate, late-payment / NSF rate, and stable-employment percentage? A property-management company in the area should have these aggregated.
- How much new apartment / multifamily construction is in the pipeline within 1–3 miles? Heavy new supply (>2% of stock underway) typically softens rents 12–24 months out; light construction supports rent growth.
Investment metrics
- 1% rule
- 1.54% ✓
- Cap rate
- 12.64%
- Cash-on-cash
- 22.65%
- DSCR
- 2.01
- GRM
- 5.4
CMA / ARV
- ARV (on-the-fly)
- $169,500
- Comps found
- 1
Show comp detail 1 sale within ~0.75 mi
| Address | Dist | Beds/Ba | Sqft | Sold | Price | $/sf | Match |
|---|---|---|---|---|---|---|---|
| 3823 Swanee St | 0.18mi | 4/4.0 | 1,459 (-3%) | 8mo | $165,000 | $113 | 80 |
Match score weights: distance 35% · size 25% · config 20% · recency 20%. Top-matched comps best support the ARV.
Projected returns pro-forma
-3.0% appreciation · 8.0% rent growth · sell at horizon
- IRR
- 21.1%
- Equity multiple
- 1.92×
- Total profit
- $33,335
- Equity at exit
- $19,383
- IRR
- 32.4%
- Equity multiple
- 4.68×
- Total profit
- $133,778
- Equity at exit
- $11,240
Cash invested: $36,400 (down + closing). Projections, not guarantees.
Landlord ↔ Tenant lean methodology
- Overall (STATE)
- 90 Strongly Landlord-Friendly
- State Louisiana
- 90 Strongly Landlord-Friendly · R+12
- County
- — inherits STATE
- City
- — inherits STATE
ZIP-level market 70607
- Rents YoY
- 8.6%
- Active inventory
- 567
- Price-to-rent
- 10.8×
Monthly cashflow live
- Estimated rent
- $2,007 high interval (Pro) →
- Mortgage (P&I)
- −$682
- Tax est. 1.5%
- −$162 /mo · $1,950/yr
- Insurance
- −$54
- HOA
- −$0
- Vacancy / Maint / Mgmt
- −$421
- Net cashflow
- $687
Break-even live
2-unit breakdown (identical units grouped — click to expand)
| Units | Beds | Baths | Est. rent |
|---|---|---|---|
| 2× units | 1 | 1 | $2,006 |
| #1 | 1 | 1 | $1,003 |
| #2 | 1 | 1 | $1,003 |
| Total (2 units) | $2,007 | ||
UW: 25.0% down · 7.5% · 30yr · 1.5% tax · 5.0% vac · 8.0% maint · 8.0% mgmt
Financing live
Cash to close
- Down payment
- $32,500
- Closing costs
- $3,900
- Reserves months
- —
- Total cash needed
- —
Loan-product check · same deal, 3 products live
Conventional
25% down · 7.5% · 30yr
- Down + closing
- —
- Monthly P&I
- —
- Monthly cashflow
- —
- DSCR
- —
- Eligible?
- —
Personal DTI + credit; lowest rate.
DSCR
20% down · 8.5% · 30yr
- Down + closing
- —
- Monthly P&I
- —
- Monthly cashflow
- —
- DSCR
- —
- Eligible?
- —
No personal income docs; deal must DSCR.
Hard money
10% down · 12.0% · 12mo
- Down + closing
- —
- Monthly P&I
- —
- Monthly cashflow
- —
- DSCR
- —
- Eligible?
- —
Short-term bridge; refi at stabilization.
Rent comps 10 comps
| Address | Beds | Baths | Sqft | Rent | $/sqft | DOM | Units | Dist |
|---|---|---|---|---|---|---|---|---|
| 617 E School St Unit A Lake Charles, LA | 3.0 | 2.0 | 1800 | $2,500 | $1.39 | 43d | 1 | 0.20mi |
| 930 Azalea St Lake Charles, LA | 4.0 | 2.0 | 1658 | $1,500 | $0.90 | 20d | 1 | 0.28mi |
| 807 Camelia St Lake Charles, LA | 3.0 | 1.0 | 1322 | $1,500 | $1.13 | 43d | 1 | 0.31mi |
| 417 E Claude St Lake Charles, LA | 4.0 | 1.0 | 1610 | $1,400 | $0.87 | 43d | 1 | 0.36mi |
| 4128 Center St Lake Charles, LA | 4.0 | 2.0 | 2227 | $1,500 | $0.67 | 43d | 1 | 0.54mi |
| 3601 1st Ave Lake Charles, LA | 3.0 | 2.0 | 1512 | $1,295 | $0.86 | 13d | 1 | 0.58mi |
| 3206 Louisiana Ave Lake Charles, LA | 4.0 | 2.0 | 1600 | $1,600 | $1.00 | 13d | 1 | 0.70mi |
| 3619 Texas St Lake Charles, LA | 1.0–3.0 | 1.0–2.0 | 950 | $1,087 | $1.14 | 13d | 6 | 0.85mi |
| 1509 Sage Dr Lake Charles, LA | 4.0 | 1.0 | 1157 | $1,195 | $1.03 | 20d | 1 | 0.88mi |
| 2700 Ernest St Lake Charles, LA | 1.0–3.0 | 1.0–2.0 | 1054 | $1,598 | $1.52 | 13d | 1 | 1.30mi |
Listing history 3 events
-
2026-03-24status Pending
-
2026-03-11price $130,000
-
2025-12-19$140,000 Active
ⓘ Source: listings_history table (triggers on properties + properties_extension) + one-shot
backfill from property_details.listing_events for pre-trigger history.
Climate risk First Street
- Flood 3/10 Moderate FEMA zone X (unshaded) · 7% chance over 30 yrs
- Wildfire 1/10 Low
- Heat 9/10 Extreme 7 d/yr ≥109°F today · 22 d/yr by 30 yrs out
- Wind 9/10 Extreme 99% chance of damaging wind over 30 yrs
- Air quality 2/10 Low 1 unhealthy d/yr today · 1 by 30 yrs out
Nearby sold comps map
Loading sold comps map…
Walkable amenities ~0.75 mi
Loading nearby amenities…
Taxation est. · year 1
- Rental income
- $24,084
- − Mortgage interest
- −$7,282
- − Property taxes
- −$1,950
- − Insurance
- −$650
- − Repairs & maintenance
- −$1,927
- − Management
- −$1,927
- − Depreciation
- −$3,782
- Taxable income
- $6,567
- Est. tax owed @ 24.0%
- −$1,576
- After-tax cash flow
- $6,670/yr
For passive investors: Depreciation is non-cash, so a rental often shows a tax loss while cash-flowing — sheltering income. Rental losses are passive: they offset passive income freely, and up to $25,000/yr can offset ordinary (W-2) income if you actively participate and your MAGI is under $100k (phasing out to $0 by $150k); unused losses carry forward. On sale, claimed depreciation is recaptured at up to 25%, and gains may owe capital-gains tax (a 1031 exchange can defer both). Figures are a year-1 estimate at your 24.0% rate — not tax advice; consult a CPA.
Schools (NCES district)
- District
- Calcasieu Parish
- NCES district ID
- 2200330
- Math proficiency
- 30% ▼ -39.00%
- Reading proficiency
- 44% ▼ -33.00%
- Median HH income
- $44,700
- Composite
- 31.45/100
- National rank
- #5979
- State rank
- #29 of 98 in LA
Livability — Lake Charles
- Score
- 68/100
- State rank
- #95
- US rank
- #9820
Category grades
Schools grade is shown separately in the Schools card above.
Census & demographics
- Census place
- Lake Charles, LA
- County
- Calcasieu Parish · 170,889 people
- City population
- 133,538
- Metro
- Lake Charles, LA
- Population (ZIP)
- 27,080
- Household income
- $60,351
- Rent vs Own
- Severe rent burden
- 1267.0
Population outlook (Calcasieu County) Hauer SSP2
- Today (2025)
- 212,179 people
- By 2030
- 218,199 · +2.8%
- By 2040
- 228,486 · +7.7%
- By 2050
- 236,208 · +11.3%
- By 2075
- 251,696 · +18.6%
- By 2100
- 247,848 · +16.8%
Race, ethnicity, and origin ACS 2023
- Neighborhood character
- Diverse neighborhood (Simpson 0.65)
- Race & ethnicity
- White 46% Black 36% Two or more races 11% Hispanic / Latino 6% Asian 2%
- Hispanic origin (detail)
- Mexican 1%
- Common ancestry
- Lithuanian 10% Serbian 1%
- Foreign-born
- 5% · Canada, Vietnam
- Languages at home
- 93% English-only · Spanish 4% French/Haitian/Cajun 2% Other Indo-European 1%
Political lean MEDSL · Calcasieu
- 2024 margin
- Solid R (+39.6) · D 29.5% · R 69.0% · Other 1.5%
- 2008→2024 swing
- -15.0pp toward R · 2008: -24.6pp · 2024: -39.6pp
- All cycles
- 2024: R+39.6 2020: R+35.2 2016: R+33.3 2012: R+28.7 2008: R+24.6
Not yet ingested
- Civics
- —
Market trends
- HPI YoY
- ▼ -91.59%
- Current HPI
- 93.679
- Rent YoY
- ▲ 8.55%
- Metro
- Lake Charles, LA
- State GDP YoY
- ▲ 3.29%
- F500 in state
- 10
Industry mix (Fortune 500 HQ in LA)
| Industry | F500 HQs | Revenue |
|---|---|---|
| Telecommunications | 2 | $23B |
|
||
| Utilities | 1 | $12B |
|
||
| Wholesale / Distribution | 1 | $5B |
|
||
| Advertising | 1 | $2B |
|
||
Price history
-7.1% since first listed3 events — show timeline
- 2026-03-24 Pending — SWLAR
- 2026-03-11 Price Changed $130,000 SWLAR
- 2025-12-19 Listed $140,000 SWLAR
Cash-flow waterfall
monthlySold comps — $/sqft
last 12 mo · ≤1 miLoading sold comps…