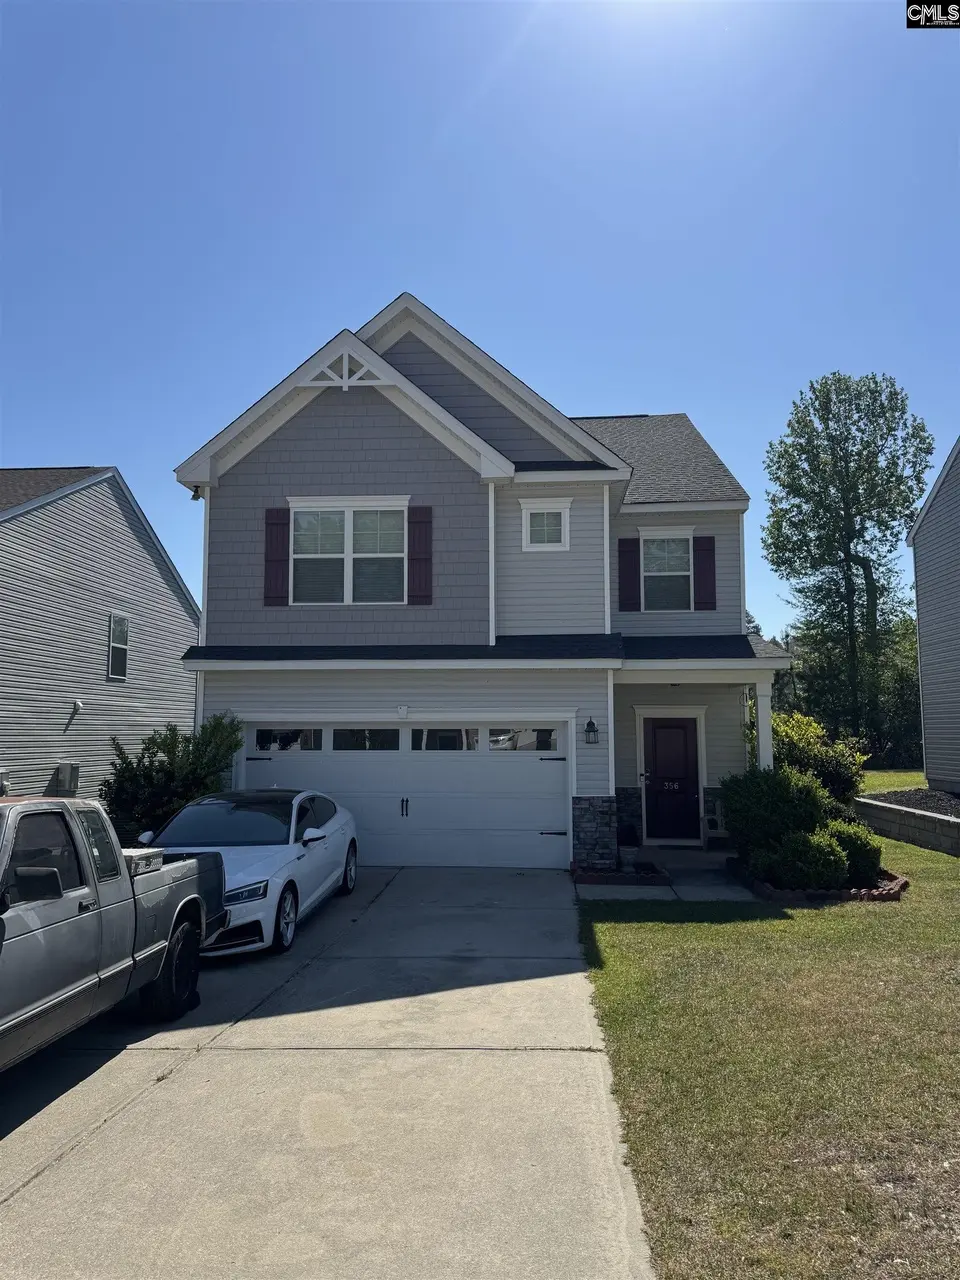
356 Gracemount Ln · Columbia, SC
Flood risk 1/10 · Minimal
- FEMA flood zone
- X (unshaded)
- Chance of flooding over 30 yrs
- 0.0%
- Est. flood insurance / yr
- $507 – $1,088
Fire risk 4/10 · Minor
- Est. fire insurance / yr
- $783 – $1,453
Heat risk 7/10 · Major
- Hot days now (above 107°F)
- 7 days/yr
- Hot days in 30 yrs
- 16 days/yr
Wind risk 6/10 · Moderate
- Chance of severe wind over 30 yrs
- 66.0%
Air-quality risk 3/10 · Minor
- Unhealthy air days now
- 2 days/yr
- Unhealthy air days in 30 yrs
- 3 days/yr
Risk factors via First Street. Map © Google.
Why this score? — see what drove the C- grade
The composite is a weighted blend of 9 inputs, each scored 0–100. Each bar is that input's sub-score; the figure is the points it added to the 100-point composite (weight × sub-score).
- Cash flow +18.3/30.0
- ARV discount +12.9/15.0
- DSCR +5.7/10.0
- 1% rule +4.2/10.0
- Livability +3.9/5.0
- Schools +3.6/10.0
- Rent growth +3.2/5.0
- Condition / age +2.5/5.0
- Appreciation +0.0/10.0
$259,000
🖨 Deal sheet (PDF) 📄 Offer letter ✓ Due diligence
Listing remarks
Beautiful 4-bedroom, 2.5-bath home located in the highly desirable Lake Carolina community! This spacious home features an open-concept layout with hardwood floors, a large living area, and a modern kitchen complete with granite countertops, island, and plenty of cabinet space. Upstairs you’ll find generously sized bedrooms, including a spacious primary suite with a private bath and walk-in closet. Additional flex space is perfect for a home office, media room, or guest space. Enjoy a 2-car garage, great curb appeal, and a convenient location close to shopping, dining, and major interstates. Don’t miss your opportunity to own in one of Columbia’s most sought-after neighbor
Key facts
- 2 garage spots
- Built 2017
- Listed 40 days
Property features AI
Finance
- HOA & community: Property is part of an association
Exterior
- Parking: Attached garage with 2 garage spaces
- Utilities: Public sewer
- Home design: Single-family property
- Construction: Slab foundation
- Exterior features: Vinyl exterior finish; Paved road access; Public water
Interior
- Bedrooms: Master bedroom on the second floor
- Bathrooms: Two full bathrooms and one half bathroom
- Interior features: Central heating and central air conditioning
Neighborhood map
What this means for you Summary
Snapshot
- This is a 4-bed/3.0-bath single-family listed at $259k.
Deal economics
- At list price, monthly cash flow is $236 ($3k/yr) — positive.
- The deal already cash-flows at list — no discount required.
- To meet the 1% rule (rent ≥ 1% of price), the offer needs to be $238k (8.1% below list).
- Recommended offer: $238k (8.1% below list) — sets the bar for 1% rule.
- Cap rate 7.4% vs local median 5.1% in Columbia — top-decile yield for the area; either an underpriced asset or a hidden risk that comps aren't pricing in. Stress-test before assuming the spread holds.
Location & tenants
- Location reads 78/100 on livability (#18 in SC, #2,436 nationally) — a middle-class / working-renter tenant base. Strengths: amenities A+, commute A+, cost of living A+; Watch: employment D, crime F.
- Richland 02 (suburban): math 35% / reading 47% proficiency, ranked #29 of 80 in SC (top 36%) — families likely to look elsewhere, expect single-tenant / working-renter base with shorter leases.
- Zoned schools: Bridge Creek Elementary (math 35% / reading 31%, grade F, #364 of 597 statewide, top 61%, 558 students, 80% FRL); Blythewood High (math 72% / reading 92%, grade A, #19 of 196 statewide, top 10%, 2,094 students, 39% FRL) — zoned schools average 59% FRL vs 38% district-wide (21 pts higher); higher-poverty schools than district average — tighter screening recommended.
- Zoned-school proficiency averages 58% at this address vs 41% district-wide (+16 pts) — the actual schools serving this property are materially stronger than the Richland 02 average implies; a family-tenant draw the district grade alone would hide.
- Market conditions: Rents rising (+2.8%/yr); 417 active listings in the ZIP; 9 comparable units currently listed for rent nearby; rentals at typical pace (median 16d on market — plan ~3-4 weeks tenant-placement turnaround); 3,472 units permitted in Richland County in 2024 (1,096 in 5+ unit buildings).
- This rent runs 39% of the median local income ($74k/yr) — at the standard rent-burdened threshold; future hikes will face affordability resistance.
Forward outlook
- Local home prices are declining (-3.0%/yr); year-one equity from $2k of loan paydown is wiped out by about $8k of value loss. Plan a longer hold.
- Richland County population projected at +30% by 2050 — long-run rental-demand tailwind backs the buy-and-hold thesis.
Negotiation context
- It's been on market 40 days — a 3% lower offer ($251k) is reasonable based on typical stale-listing flexibility.
Risks & watch-outs
- Climate carrying-cost: major wind risk, 66% chance of damaging wind over 30y; extreme-heat days projected 7→16/yr by 2055 (HVAC capex compounding) — expect insurance premiums to compound above CPI over the hold.
Questions for the listing agent
- It's been on market 40 days. Have you received any prior offers? Is the seller open to a 8% concession, seller financing, or rate buy-down credit?
- Is there a deadline driving the sale (1031 exchange, divorce, estate, relocation)? That informs how much negotiation room exists.
- Schools are D-rated, which usually means shorter tenancies and higher turnover. Who's the typical renter profile here, and what's been the actual vacancy rate?
- Crime grade is F in this area — have there been break-ins, vandalism, or insurance claims at this property in the last 3 years? What carrier currently insures it and at what premium?
- What's the average days-on-market for RENTAL listings here right now (not sales)? A rising rental-DOM trend means longer vacancies and softer asking-rent achievability than the comps imply.
- What's the recent tenant-quality profile in this submarket — average credit score on applications, eviction rate, late-payment / NSF rate, and stable-employment percentage? A property-management company in the area should have these aggregated.
- How much new for-sale + rental construction is in the pipeline within 1–3 miles? Heavy new supply typically softens prices + rents 12–24 months out; constrained supply supports both.
Investment metrics
- 1% rule
- 0.92% ✗
- Cap rate
- 7.39%
- Cash-on-cash
- 3.91%
- DSCR
- 1.17
- GRM
- 9.1
CMA / ARV
- ARV (on-the-fly)
- $294,226
- Comps found
- 3
Show comp detail 3 sales within ~0.75 mi
| Address | Dist | Beds/Ba | Sqft | Sold | Price | $/sf | Match |
|---|---|---|---|---|---|---|---|
| 743 Eden Hall Dr | 0.23mi | 3/2.0 (-1) | 2,151 (-4%) | 0mo | $349,900 | $163 | 73 |
| 408 Edenhall Dr | 0.18mi | 4/2.5 | 2,433 (+8%) | 19mo | $260,000 | $107 | 60 |
| 3 Hidden Sands Ct | 0.60mi | 4/2.5 | 2,060 (-8%) | 9mo | $270,000 | $131 | 49 |
Match score weights: distance 35% · size 25% · config 20% · recency 20%. Top-matched comps best support the ARV.
Projected returns pro-forma
-3.0% appreciation · 2.81% rent growth · sell at horizon
- IRR
- -10.4%
- Equity multiple
- 0.62×
- Total profit
- $-27,422
- Equity at exit
- $38,618
- IRR
- -1.3%
- Equity multiple
- 0.91×
- Total profit
- $-6,570
- Equity at exit
- $22,394
Cash invested: $72,520 (down + closing). Projections, not guarantees.
Landlord ↔ Tenant lean methodology
- Overall (STATE)
- 90 Strongly Landlord-Friendly
- State South Carolina
- 90 Strongly Landlord-Friendly · R+6
- County
- — inherits STATE
- City
- — inherits STATE
ZIP-level market 29229
- Home prices YoY
- -21.5%
- Rents YoY
- 2.8%
- Active inventory
- 417
- Price-to-rent
- 9.1×
Monthly cashflow live
- Estimated rent
- $2,379 high interval (Pro) →
- Mortgage (P&I)
- −$1,358
- Tax from tax record
- −$177 /mo · $2,125/yr
- Insurance
- −$108
- HOA
- −$0
- Vacancy / Maint / Mgmt
- −$500
- Net cashflow
- $236
Break-even live
Sensitivity live
| Price | -10% $383 | -5% $310 | +0% $236 | +5% $163 | +10% $90 |
|---|---|---|---|---|---|
| Rent | -10% $48 | -5% $142 | +0% $236 | +5% $330 | +10% $424 |
| Rate | -1.0pp $367 | -0.5pp $302 | base $236 | +0.5pp $169 | +1.0pp $101 |
UW: 25.0% down · 7.5% · 30yr · 1.5% tax · 5.0% vac · 8.0% maint · 8.0% mgmt
Financing live
Cash to close
- Down payment
- $64,750
- Closing costs
- $7,770
- Reserves months
- —
- Total cash needed
- —
Loan-product check · same deal, 3 products live
Conventional
25% down · 7.5% · 30yr
- Down + closing
- —
- Monthly P&I
- —
- Monthly cashflow
- —
- DSCR
- —
- Eligible?
- —
Personal DTI + credit; lowest rate.
DSCR
20% down · 8.5% · 30yr
- Down + closing
- —
- Monthly P&I
- —
- Monthly cashflow
- —
- DSCR
- —
- Eligible?
- —
No personal income docs; deal must DSCR.
Hard money
10% down · 12.0% · 12mo
- Down + closing
- —
- Monthly P&I
- —
- Monthly cashflow
- —
- DSCR
- —
- Eligible?
- —
Short-term bridge; refi at stabilization.
Rent comps 9 comps
| Address | Beds | Baths | Sqft | Rent | $/sqft | DOM | Units | Dist |
|---|---|---|---|---|---|---|---|---|
| 456 Edenhall Dr Columbia, SC | 4.0 | 2.5 | 2158 | $2,600 | $1.20 | 25d | 1 | 0.18mi |
| 2000 Lake Carolina Dr Columbia, SC | 4.0 | 2.5 | 1841 | $2,089 | $1.13 | 16d | 1 | 0.20mi |
| 1964 Lake Carolina Dr Columbia, SC | 4.0 | 2.5 | 1841 | $1,939 | $1.05 | 23d | 1 | 0.27mi |
| 252 Bassett Loop Columbia, SC | 4.0 | 3.0 | 2260 | $2,295 | $1.02 | 25d | 1 | 0.72mi |
| 499 Fox Trot Dr Columbia, SC | 4.0 | 2.5 | 2006 | $2,195 | $1.09 | 5d | 1 | 0.86mi |
| 221 Fox Grove Cir Unit 1 Columbia, SC | 4.0 | 2.0 | 2046 | $1,700 | $0.83 | 4d | 1 | 0.88mi |
| 219 Pineclave Cir Columbia, SC | 4.0 | 3.0 | 2300 | $2,000 | $0.87 | 25d | 1 | 1.14mi |
| 44 Ginkgo Ct Columbia, SC | 5.0 | 3.0 | 2743 | $2,750 | $1.00 | 5d | 1 | 1.31mi |
| 201 Clearmeadow Dr Columbia, SC | 3.0 | 2.0 | 2423 | $2,379 | $0.98 | 4d | 1 | 1.41mi |
Listing history 5 events
-
2026-06-03statusdays on market $259,000 Pending 40 DOM
-
2026-06-01days on market $259,000 Active 39 DOM
-
2026-05-31days on market $259,000 Active 38 DOM
-
2026-04-23$269,000 Active
-
2021-11-08soldstatus $231,500
ⓘ Source: listings_history table (triggers on properties + properties_extension) + one-shot
backfill from property_details.listing_events for pre-trigger history.
Tax reassessment forecast SC · Resets to sale price
- Current annual tax
- $2,125 · $177/mo
- Projected year-2 tax
- $2,125 · $177/mo
- Expected delta
- $0/yr ($0/mo · 0.0%)
ⓘ Screening estimate from a state-policy table — verify with the county assessor before closing.
Climate risk First Street
- Flood 1/10 Low FEMA zone X (unshaded) · 0% chance over 30 yrs
- Wildfire 4/10 Moderate
- Heat 7/10 Severe 7 d/yr ≥107°F today · 16 d/yr by 30 yrs out
- Wind 6/10 Major 66% chance of damaging wind over 30 yrs
- Air quality 3/10 Moderate 2 unhealthy d/yr today · 3 by 30 yrs out
Nearby sold comps map
Loading sold comps map…
Walkable amenities ~0.75 mi
Loading nearby amenities…
Taxation est. · year 1
- Rental income
- $28,551
- − Mortgage interest
- −$14,508
- − Property taxes
- −$2,125
- − Insurance
- −$1,295
- − Repairs & maintenance
- −$2,284
- − Management
- −$2,284
- − Depreciation
- −$7,535
- Taxable loss
- −$1,480
- Est. tax savings @ 24.0%
- +$355
- After-tax cash flow
- $3,192/yr
For passive investors: Depreciation is non-cash, so a rental often shows a tax loss while cash-flowing — sheltering income. Rental losses are passive: they offset passive income freely, and up to $25,000/yr can offset ordinary (W-2) income if you actively participate and your MAGI is under $100k (phasing out to $0 by $150k); unused losses carry forward. On sale, claimed depreciation is recaptured at up to 25%, and gains may owe capital-gains tax (a 1031 exchange can defer both). Figures are a year-1 estimate at your 24.0% rate — not tax advice; consult a CPA.
Schools (NCES district)
- District
- Richland 02
- NCES district ID
- 4503390
- Math proficiency
- 35% ▼ -15.00%
- Reading proficiency
- 47% ▼ -5.00%
- Median HH income
- $59,684
- Composite
- 36.2/100
- National rank
- #4730
- State rank
- #29 of 80 in SC
Livability — Columbia
- Score
- 78/100
- State rank
- #18
- US rank
- #2436
Category grades
Schools grade is shown separately in the Schools card above.
Census & demographics
- County
- Richland County · 389,530 people
- City population
- 335,994
- Metro
- Columbia, SC
- Population (ZIP)
- 51,861
- Household income
- $74,043
- Rent vs Own
- Severe rent burden
- 1939.0
Population outlook (Richland County) Hauer SSP2
- Today (2025)
- 459,667 people
- By 2030
- 487,524 · +6.1%
- By 2040
- 542,035 · +17.9%
- By 2050
- 595,371 · +29.5%
- By 2075
- 732,998 · +59.5%
- By 2100
- 820,415 · +78.5%
Race, ethnicity, and origin ACS 2023
- Neighborhood character
- Diverse neighborhood (Simpson 0.56)
- Race & ethnicity
- Black 62% White 24% Hispanic / Latino 8% Two or more races 6% Asian 3%
- Hispanic origin (detail)
- Mexican 2% Puerto Rican 2%
- Common ancestry
- Slovak 1% Lithuanian 1% Romanian 1%
- Foreign-born
- 7% · Canada, South Korea, Jamaica
- Languages at home
- 89% English-only · Spanish 6% Other Indo-European 1% Korean 1%
Political lean MEDSL · Richland
- 2024 margin
- Solid D (+34.6) · D 66.4% · R 31.8% · Other 1.8%
- 2008→2024 swing
- +5.7pp toward D · 2008: 28.9pp · 2024: 34.6pp
- All cycles
- 2024: D+34.6 2020: D+38.3 2016: D+32.9 2012: D+33.3 2008: D+28.9
Not yet ingested
- Civics
- —
Market trends
- HPI YoY
- ▼ -51.11%
- Current HPI
- 186.782
- Rent YoY
- ▲ 2.81%
- Metro
- Columbia, SC
- State GDP YoY
- ▲ 4.51%
- F500 in state
- 2
Industry mix (Fortune 500 HQ in SC)
| Industry | F500 HQs | Revenue |
|---|---|---|
| Packaging | 1 | $7B |
|
||
Price history
+16.2% since first listed2 events — show timeline
- 2026-04-23 Listed $269,000 Consolidated MLS
- 2021-11-08 Sold (Public Records) $231,500 Public Records
Property tax history
+45.9%/yrLatest (2025): $2,125 · +3.6% YoY. Source: county tax records.
Cash-flow waterfall
monthlySold comps — $/sqft
last 12 mo · ≤1 miLoading sold comps…