 🌊 Lakefront
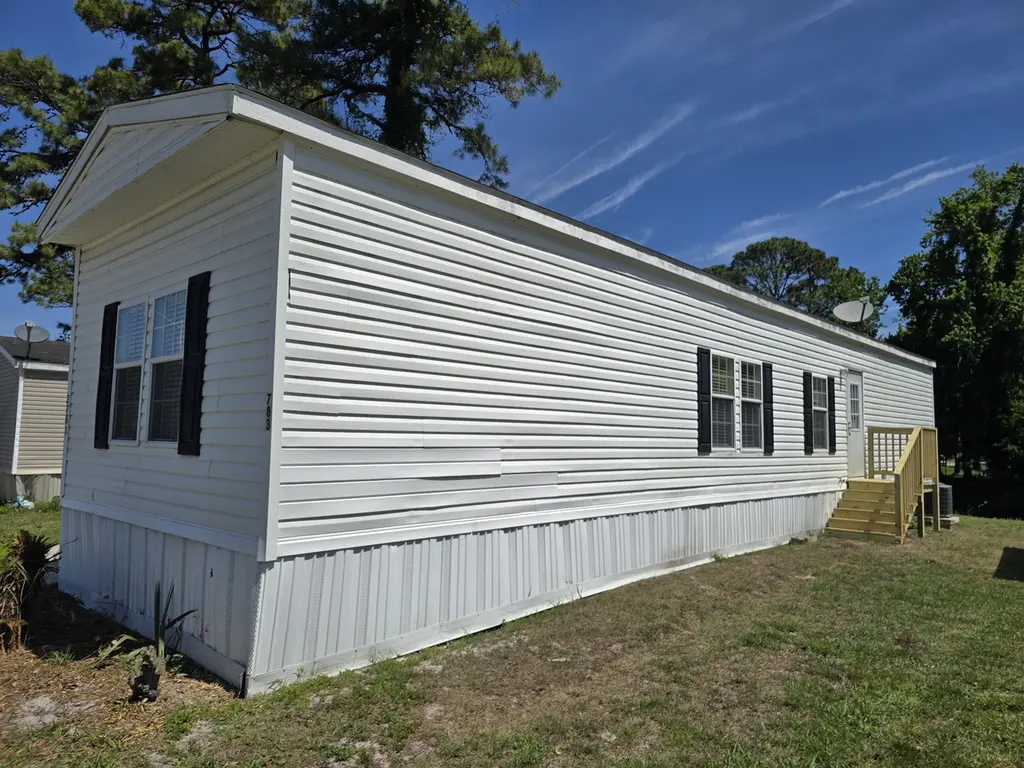
2781 Suni Pines Blvd #783 · Jacksonville, FL
Flood risk 1/10 · Minimal
- FEMA flood zone
- X (unshaded)
- Chance of flooding over 30 yrs
- 0.0%
- Est. flood insurance / yr
- $507 – $1,088
Fire risk 3/10 · Minor
- Est. fire insurance / yr
- $947 – $1,759
Heat risk 10/10 · Severe
- Hot days now (above 105°F)
- 7 days/yr
- Hot days in 30 yrs
- 20 days/yr
Wind risk 10/10 · Severe
- Chance of severe wind over 30 yrs
- 99.0%
Air-quality risk 4/10 · Minor
- Unhealthy air days now
- 4 days/yr
- Unhealthy air days in 30 yrs
- 7 days/yr
Risk factors via First Street. Map © Google.
Why this score? — see what drove the D+ grade
The composite is a weighted blend of 9 inputs, each scored 0–100. Each bar is that input's sub-score; the figure is the points it added to the 100-point composite (weight × sub-score).
- Cash flow +15.0/30.0
- ARV discount +7.5/15.0
- 1% rule +5.0/10.0
- DSCR +5.0/10.0
- Livability +4.2/5.0
- Schools +3.9/10.0
- Rent growth +3.8/5.0
- Condition / age +2.5/5.0
- Appreciation +0.0/10.0
$35,300
🖨 Deal sheet 📄 Offer letter ✓ Due diligence
Listing remarks
* THIS IS A RESALE LISTING * You'll love living in this 2 bedroom, 2 bathroom home within a wonderful family-friendly community. Check out the awesome amenities your community has to offer such as a soccer field, scenic views, a picnic area / pavilion / grill, and more! This home won't be on the market long, so call us today for more information or to schedule a tour. Deposits & Fees are subject to change.
Key facts
- Pavilion
- Picnic area
- Grill
Tags
Property features AI
Finance
- Financial info: Listed as active with list price $35,300
Exterior
- Utilities: Electric service; Central air conditioning
- Home design: Condominium (unit at 2781 Suni Pines Blvd #783, Jacksonville, FL 32250); Spec home (plan 93521)
- Exterior features: Living area approximately 1056
Interior
- Bedrooms: 2 bedrooms
- Bathrooms: 2 full bathrooms
- Heating & cooling: Electric heating; Central air conditioning
- Interior features: 2 total bathrooms; 2 total bedrooms
Neighborhood map
What this means for you Summary
Snapshot
- This is a 2-bed/2.0-bath manufactured listed at $35k.
Deal economics
- At list price, monthly cash flow is $1k ($17k/yr) — positive.
- The deal already cash-flows at list — no discount required.
- Meets the 1% rule at list price ($2k rent vs $35k).
- Cap rate 54.8% vs local median 4.0% in Jacksonville — top-decile yield for the area; either an underpriced asset or a hidden risk that comps aren't pricing in. Stress-test before assuming the spread holds.
Location & tenants
- Location reads 83/100 on livability (#50 in FL, #911 nationally) — a professional / high-income tenant draw. Strengths: amenities A+, commute A+, housing A+.
- Duval (urban): math 46% / reading 45% proficiency, ranked #48 of 73 in FL (top 66%) — families likely to look elsewhere, expect single-tenant / working-renter base with shorter leases.
- Market conditions: Rents rising fast (+5.0%/yr); 307 active listings in the ZIP; 18 comparable units currently listed for rent nearby; rentals at typical pace (median 15d on market — plan ~3-4 weeks tenant-placement turnaround); high-income renter base; 6,503 units permitted in Duval County in 2024 (1,131 in 5+ unit buildings).
Forward outlook
- Local home prices are declining (-3.0%/yr); year-one equity from $244 of loan paydown is wiped out by about $1k of value loss. Plan a longer hold.
- Duval County population projected at +19% by 2050 — long-run rental-demand tailwind backs the buy-and-hold thesis.
- At projected returns (-3.0% appreciation + 5.0% rent growth), your $10k cash investment doubles in ~1 year — after that, you're playing with house money.
Negotiation context
- Only 14 days on market — expect competitive offers; lowballing is unlikely to land.
Risks & watch-outs
- Climate carrying-cost: severe wind risk, 99% chance of damaging wind over 30y; extreme-heat days projected 7→20/yr by 2055 (HVAC capex compounding) — expect insurance premiums to compound above CPI over the hold.
Questions for the listing agent
- Is there a deadline driving the sale (1031 exchange, divorce, estate, relocation)? That informs how much negotiation room exists.
- Schools are B-rated — typically a magnet for longer-tenancy family renters. What's the average tenant stay here, and is there a school-zone premium baked into asking?
- The area grade is low — what's the realistic commute time and amenity access for the typical tenant pool here? Any planned neighborhood developments (good or bad) we should know about?
- This sits on a lake — are riparian / water-frontage rights deeded with the parcel? Any dock permits, shoreline easements, or HOA water-use restrictions?
- What's the documented flood / surge / shoreline-erosion history here (FEMA AND non-FEMA — e.g., storm surge, creek backup, septic-field saturation)?
- Any water-quality or seasonal algae-bloom issues that affect tenant satisfaction or short-term-rental demand?
- What's the average days-on-market for RENTAL listings here right now (not sales)? A rising rental-DOM trend means longer vacancies and softer asking-rent achievability than the comps imply.
- What's the recent tenant-quality profile in this submarket — average credit score on applications, eviction rate, late-payment / NSF rate, and stable-employment percentage? A property-management company in the area should have these aggregated.
- How much new for-sale + rental construction is in the pipeline within 1–3 miles? Heavy new supply typically softens prices + rents 12–24 months out; constrained supply supports both.
Investment metrics
- 1% rule
- 5.99% ✓
- Cap rate
- 54.79%
- Cash-on-cash
- 173.20%
- DSCR
- 8.71
- GRM
- 1.4
CMA / ARV
- ARV (on-the-fly)
- $175,296
- Comps found
- 1
Show comp detail 1 sale within ~0.75 mi
| Address | Dist | Beds/Ba | Sqft | Sold | Price | $/sf | Match |
|---|---|---|---|---|---|---|---|
| 2903 Bratcher Rd | 0.65mi | 3/2.0 (+1) | 916 (-13%) | 1mo | $152,100 | $166 | 42 |
Match score weights: distance 35% · size 25% · config 20% · recency 20%. Top-matched comps best support the ARV.
Projected returns pro-forma
-3.0% appreciation · 5.03% rent growth · sell at horizon
- IRR
- —
- Equity multiple
- 10.06×
- Total profit
- $89,576
- Equity at exit
- $5,263
- IRR
- —
- Equity multiple
- 22.65×
- Total profit
- $213,974
- Equity at exit
- $3,052
Cash invested: $9,884 (down + closing). Projections, not guarantees.
Landlord ↔ Tenant lean methodology
- Overall (STATE)
- 87 Strongly Landlord-Friendly
- State Florida
- 87 Strongly Landlord-Friendly · R+3
- County
- — inherits STATE
- City
- — inherits STATE
ZIP-level market 32250
- Rents YoY
- 5.0%
- Active inventory
- 307
- Price-to-rent
- 1.4×
Monthly cashflow live
- Estimated rent
- $2,115 high interval (Pro) →
- Mortgage (P&I)
- −$185
- Tax est. 1.5%
- −$44 /mo · $530/yr
- Insurance
- −$15
- HOA
- −$0
- Vacancy / Maint / Mgmt
- −$444
- Net cashflow
- $1,427
Break-even live
UW: 25.0% down · 7.5% · 30yr · 1.5% tax · 5.0% vac · 8.0% maint · 8.0% mgmt
Financing live
Cash to close
- Down payment
- $8,825
- Closing costs
- $1,059
- Reserves months
- —
- Total cash needed
- —
Loan-product check · same deal, 3 products live
Conventional
25% down · 7.5% · 30yr
- Down + closing
- —
- Monthly P&I
- —
- Monthly cashflow
- —
- DSCR
- —
- Eligible?
- —
Personal DTI + credit; lowest rate.
DSCR
20% down · 8.5% · 30yr
- Down + closing
- —
- Monthly P&I
- —
- Monthly cashflow
- —
- DSCR
- —
- Eligible?
- —
No personal income docs; deal must DSCR.
Hard money
10% down · 12.0% · 12mo
- Down + closing
- —
- Monthly P&I
- —
- Monthly cashflow
- —
- DSCR
- —
- Eligible?
- —
Short-term bridge; refi at stabilization.
Rent comps 18 comps
| Address | Beds | Baths | Sqft | Rent | $/sqft | DOM | Units | Dist |
|---|---|---|---|---|---|---|---|---|
| 2942 Rockford Falls Dr N Jacksonville, FL | 3.0 | 2.0 | 1490 | $2,100 | $1.41 | 17d | 1 | 0.36mi |
| 13717 Otway Rd Jacksonville, FL | 3.0 | 2.0 | 1476 | $3,500 | $2.37 | 7d | 1 | 0.46mi |
| 2443 Footbridge Ln Jacksonville, FL | 3.0 | 2.0 | 1450 | $3,000 | $2.07 | 4d | 1 | 0.51mi |
| 14051 Beach Blvd Jacksonville Beach, FL | 1.0–2.0 | 1.0–2.0 | 1001 | $2,410 | $2.41 | 1d | 17 | 0.54mi |
| 13793 Herons Landing Way Jacksonville, FL | 3.0 | 2.0 | 1346 | $1,850 | $1.37 | 23d | 1 | 0.70mi |
| 2001 Hodges Blvd Jacksonville, FL | 1.0–3.0 | 1.0–2.0 | 1000 | $1,498 | $1.50 | 20d | 15 | 1.08mi |
| 13364 Beach Blvd Jacksonville, FL | 2.0–3.0 | 2.0 | 1418 | $1,850 | $1.30 | 14d | 5 | 1.08mi |
| 13364 Beach Blvd Jacksonville, FL | 2.0–3.0 | 2.0 | 1418 | $1,800 | $1.27 | 4d | 6 | 1.08mi |
| 3477 Nightscape Cir Jacksonville, FL | 2.0 | 2.5 | 1078 | $1,750 | $1.62 | 23d | 1 | 1.21mi |
| 3435 Nightscape Cir Jacksonville, FL | 2.0 | 2.5 | 1078 | $1,800 | $1.67 | 23d | 1 | 1.23mi |
| 3684 Summerlin Ln Jacksonville, FL | 2.0 | 2.5 | 1110 | $1,600 | $1.44 | 23d | 1 | 1.27mi |
| 3551 San Pablo Rd S Jacksonville, FL | 1.0–2.0 | 1.0–1.5 | 800 | $1,399 | $1.75 | 3d | 11 | 1.28mi |
| 3504 Summerlin Ln Jacksonville, FL | 2.0 | 2.5 | 1110 | $1,475 | $1.33 | 23d | 1 | 1.30mi |
| 1715 Hodges Blvd Jacksonville, FL | 1.0–3.0 | 1.0–2.0 | 850 | $1,463 | $1.72 | 1d | 60 | 1.37mi |
| 1700 San Pablo Rd S Jacksonville, FL | 1.0–4.0 | 1.0–2.0 | 1309 | $1,896 | $1.45 | 1d | 16 | 1.43mi |
| 13700 Richmond Park Dr N #1002 Jacksonville, FL | 2.0 | 2.0 | 1015 | $1,396 | $1.38 | 14d | 1 | 1.46mi |
| 13700 Richmond Park Dr N #1002 Jacksonville, FL | 2.0 | 2.0 | 1015 | $1,396 | $1.38 | 21d | 1 | 1.46mi |
| 3709 San Pablo Rd S Jacksonville, FL | 1.0–2.0 | 1.0–2.0 | 800 | $1,890 | $2.36 | 2d | 14 | 1.49mi |
Climate risk First Street
- Flood 1/10 Low FEMA zone X (unshaded) · 0% chance over 30 yrs
- Wildfire 3/10 Moderate
- Heat 10/10 Extreme 7 d/yr ≥105°F today · 20 d/yr by 30 yrs out
- Wind 10/10 Extreme 99% chance of damaging wind over 30 yrs
- Air quality 4/10 Moderate 4 unhealthy d/yr today · 7 by 30 yrs out
Nearby sold comps map
Loading sold comps map…
Walkable amenities ~0.75 mi
Loading nearby amenities…
Taxation est. · year 1
- Rental income
- $25,375
- − Mortgage interest
- −$1,977
- − Property taxes
- −$530
- − Insurance
- −$176
- − Repairs & maintenance
- −$2,030
- − Management
- −$2,030
- − Depreciation
- −$1,027
- Taxable income
- $17,605
- Est. tax owed @ 24.0%
- −$4,225
- After-tax cash flow
- $12,894/yr
For passive investors: Depreciation is non-cash, so a rental often shows a tax loss while cash-flowing — sheltering income. Rental losses are passive: they offset passive income freely, and up to $25,000/yr can offset ordinary (W-2) income if you actively participate and your MAGI is under $100k (phasing out to $0 by $150k); unused losses carry forward. On sale, claimed depreciation is recaptured at up to 25%, and gains may owe capital-gains tax (a 1031 exchange can defer both). Figures are a year-1 estimate at your 24.0% rate — not tax advice; consult a CPA.
Schools (NCES district)
- District
- Duval
- NCES district ID
- 1200480
- Math proficiency
- 46% ▼ -11.00%
- Reading proficiency
- 45% ▼ -4.00%
- Median HH income
- $48,987
- Composite
- 38.97/100
- National rank
- #4076
- State rank
- #48 of 73 in FL
Livability — Jacksonville
- Score
- 83/100
- State rank
- #50
- US rank
- #911
Category grades
Schools grade is shown separately in the Schools card above.
Census & demographics
- Census place
- Jacksonville, FL
- County
- Duval County · 1,015,274 people
- City population
- 979,034
- Metro
- Jacksonville, FL
- Population (ZIP)
- 29,072
- Household income
- $117,724
- Rent vs Own
- Severe rent burden
- 719.0
Population outlook (Duval County) Hauer SSP2
- Today (2025)
- 1,013,010 people
- By 2030
- 1,059,228 · +4.6%
- By 2040
- 1,141,439 · +12.7%
- By 2050
- 1,205,258 · +19.0%
- By 2075
- 1,324,282 · +30.7%
- By 2100
- 1,319,620 · +30.3%
Race, ethnicity, and origin ACS 2023
- Neighborhood character
- Predominantly White (83%)
- Race & ethnicity
- White 83% Two or more races 8% Hispanic / Latino 8% Black 3% Asian 2%
- Hispanic origin (detail)
- Mexican 3% Puerto Rican 2% Cuban 1%
- Common ancestry
- Italian 4% Slovak 3% Romanian 3%
- Foreign-born
- 6% · Canada, China
- Languages at home
- 92% English-only · Spanish 4% Other Indo-European 1% Russian/Polish/Slavic 1%
Political lean MEDSL · Duval
- 2024 margin
- Toss-up / Even · D 48.7% · R 50.1% · Other 1.2%
- 2008→2024 swing
- +0.4pp no change · 2008: -1.9pp · 2024: -1.5pp
- All cycles
- 2024: R+1.5 2020: D+3.8 2016: R+1.5 2012: R+3.6 2008: R+1.9
Not yet ingested
- Civics
- —
Market trends
- HPI YoY
- ▼ -581.25%
- Current HPI
- 329.7742
- Rent YoY
- ▲ 5.03%
- Metro
- Jacksonville, FL
- State GDP YoY
- ▲ 3.28%
- F500 in state
- 36
Industry mix (Fortune 500 HQ in FL)
| Industry | F500 HQs | Revenue |
|---|---|---|
| Industrial Technology | 2 | $29B |
|
||
| Insurance | 2 | $17B |
|
||
| Retail | 1 | $60B |
|
||
| Technology Distribution | 1 | $58B |
|
||
| Homebuilding | 1 | $35B |
|
||
| Technology Manufacturing | 1 | $35B |
|
||
Cash-flow waterfall
monthlySold comps — $/sqft
last 12 mo · ≤1 miLoading sold comps…