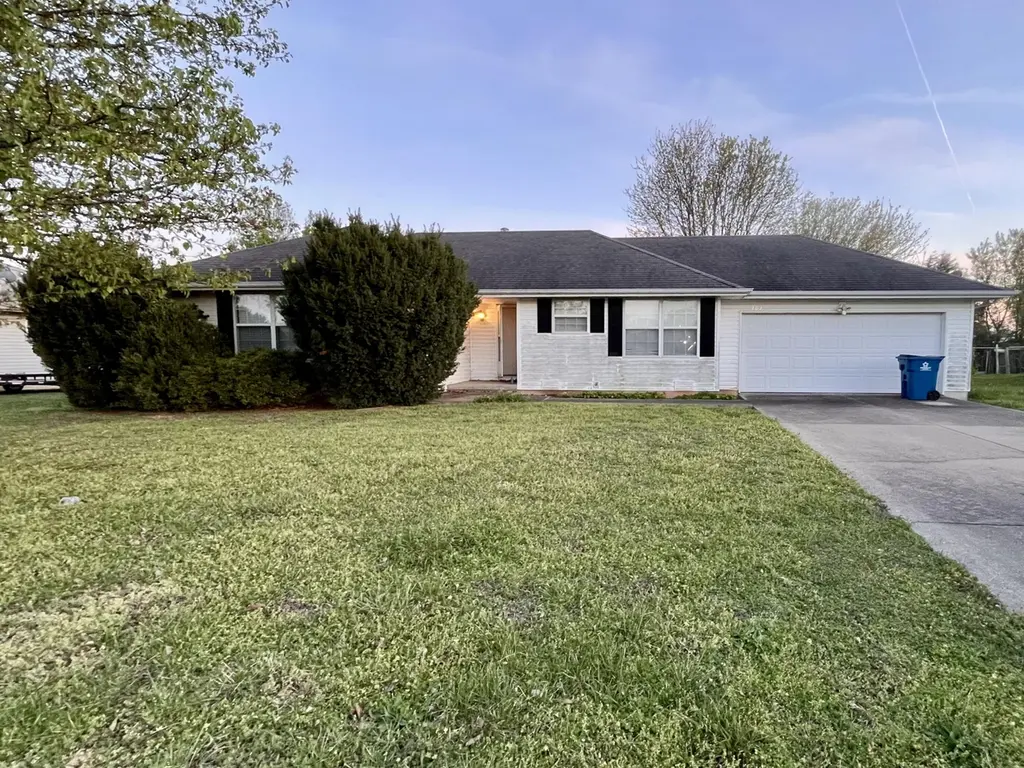
109 Willowridge Ln · Willard, MO
Flood risk 1/10 · Minimal
- FEMA flood zone
- X (unshaded)
- Chance of flooding over 30 yrs
- 0.0%
- Est. flood insurance / yr
- $507 – $1,088
Fire risk 3/10 · Minor
- Est. fire insurance / yr
- $1,054 – $1,958
Heat risk 5/10 · Moderate
- Hot days now (above 106°F)
- 7 days/yr
- Hot days in 30 yrs
- 20 days/yr
Wind risk 2/10 · Minimal
- Chance of severe wind over 30 yrs
- 1.0%
Air-quality risk 1/10 · Minimal
- Unhealthy air days now
- 0 days/yr
- Unhealthy air days in 30 yrs
- 0 days/yr
Risk factors via First Street. Map © Google.
Why this score? — see what drove the B- grade
The composite is a weighted blend of 9 inputs, each scored 0–100. Each bar is that input's sub-score; the figure is the points it added to the 100-point composite (weight × sub-score).
- Cash flow +25.7/30.0
- ARV discount +15.0/15.0
- DSCR +8.6/10.0
- 1% rule +6.5/10.0
- Schools +3.9/10.0
- Livability +3.7/5.0
- Rent growth +2.5/5.0
- Condition / age +2.5/5.0
- Appreciation +0.0/10.0
$149,900
🖨 Deal sheet (PDF) 📄 Offer letter ✓ Due diligence
Listing remarks
SELLER HAS ACCEPTED AN OFFER. WILL SHOW PENDING AFTER APPROVAL FROM ATTORNEY. Looking for a project with a massive upside? This home is ready for its next chapter. Home has a great layout with a functional flow. Located on a cul-de-sac in a lovely neighborhood in highly desired Willard School District. This is a rare opportunity to get into the market at a price point that allows for a full custom renovation. Schedule your showing today! To be sold 'As-Is' Seller to do no repairs. Please be cautious when entering home.
Key facts
- 0.26 acre lot
- 2 garage spots
- Built 2001
Neighborhood map
What this means for you Summary
Snapshot
- This is a 3-bed/2.0-bath single-family listed at $150k.
Deal economics
- At list price, monthly cash flow is $359 ($4k/yr) — positive.
- The deal already cash-flows at list — no discount required.
- Meets the 1% rule at list price ($2k rent vs $150k).
- Cap rate 9.2% vs local median 3.5% in Willard — top-decile yield for the area; either an underpriced asset or a hidden risk that comps aren't pricing in. Stress-test before assuming the spread holds.
Location & tenants
- Location reads 73/100 on livability (#79 in MO) — a middle-class / working-renter tenant base. Strengths: cost of living A+, housing A+, crime A; Watch: amenities F, commute F, health & safety F.
- Willard R-II (rural): math 41% / reading 50% proficiency, ranked #83 of 324 in MO (top 26%) — families likely to look elsewhere, expect single-tenant / working-renter base with shorter leases.
- Zoned schools: Willard East Elem. (math 57% / reading 57%, grade C+, #159 of 1,115 statewide, top 16%, 326 students, 32% FRL); Willard Middle (math 43% / reading 48%, grade D+, #105 of 391 statewide, top 27%, 741 students, 32% FRL); Willard High (math 37% / reading 60%, grade D, #147 of 521 statewide, top 29%, 1,381 students, 29% FRL) — zoned schools at 31% FRL track the district average.
- Market conditions: 93 active listings in the ZIP; 1,302 units permitted in Greene County in 2024 (250 in 5+ unit buildings).
Forward outlook
- Local home prices are declining (-3.0%/yr); year-one equity from $1k of loan paydown is wiped out by about $4k of value loss. Plan a longer hold.
- Greene County population projected at +25% by 2050 — long-run rental-demand tailwind backs the buy-and-hold thesis.
Negotiation context
- Only 5 days on market — expect competitive offers; lowballing is unlikely to land.
Risks & watch-outs
- Climate carrying-cost: extreme-heat days projected 7→20/yr by 2055 (HVAC capex compounding) — expect insurance premiums to compound above CPI over the hold.
Questions for the listing agent
- Is there a deadline driving the sale (1031 exchange, divorce, estate, relocation)? That informs how much negotiation room exists.
- What's the average days-on-market for RENTAL listings here right now (not sales)? A rising rental-DOM trend means longer vacancies and softer asking-rent achievability than the comps imply.
- What's the recent tenant-quality profile in this submarket — average credit score on applications, eviction rate, late-payment / NSF rate, and stable-employment percentage? A property-management company in the area should have these aggregated.
- How much new for-sale + rental construction is in the pipeline within 1–3 miles? Heavy new supply typically softens prices + rents 12–24 months out; constrained supply supports both.
Investment metrics
- 1% rule
- 1.15% ✓
- Cap rate
- 9.17%
- Cash-on-cash
- 10.28%
- DSCR
- 1.46
- GRM
- 7.3
CMA / ARV
- ARV (on-the-fly)
- $210,756
- Comps found
- 12
Show comp detail 12 sales within ~0.75 mi
| Address | Dist | Beds/Ba | Sqft | Sold | Price | $/sf | Match |
|---|---|---|---|---|---|---|---|
| 109 Willowridge Ln | 0.00mi | 3/2.0 | 1,092 (0%) | 1mo | $149,900 | $137 | 100 |
| 105 Sedona Ln | 0.09mi | 3/2.0 | 1,103 (+1%) | 8mo | $225,000 | $204 | 88 |
| 121 Holly Cir | 0.24mi | 3/2.0 | 1,132 (+4%) | 1mo | $229,900 | $203 | 82 |
| 108 W Fall Creek Rd | 0.15mi | 3/2.0 | 1,211 (+11%) | 5mo | $229,000 | $189 | 71 |
| 103 Arrowhead Rd | 0.57mi | 3/2.0 | 1,085 (-1%) | 1mo | $215,000 | $198 | 71 |
| 102 Arrowhead Rd | 0.57mi | 3/2.0 | 1,085 (-1%) | 2mo | $215,000 | $198 | 71 |
| 217 Arrowhead Rd | 0.11mi | 3/2.0 | 1,200 (+10%) | 10mo | $229,500 | $191 | 70 |
| 204 Arrowhead Rd | 0.19mi | 3/2.0 | 1,227 (+12%) | 10mo | $214,900 | $175 | 62 |
| 204 Eagle Ln | 0.34mi | 3/2.0 | 1,236 (+13%) | 3mo | $249,900 | $202 | 59 |
| 113 Holly Ridge Rd | 0.29mi | 2/2.0 (-1) | 1,176 (+8%) | 14mo | $215,000 | $183 | 57 |
| 119 N Grand Prairie Dr | 0.51mi | 3/2.0 | 1,219 (+12%) | 11mo | $219,900 | $180 | 48 |
| 100 Dorcas Dr | 0.64mi | 3/1.0 | 960 (-12%) | 2mo | $185,000 | $193 | 45 |
Match score weights: distance 35% · size 25% · config 20% · recency 20%. Top-matched comps best support the ARV.
Projected returns pro-forma
-3.0% appreciation · 3.0% rent growth · sell at horizon
- IRR
- -0.9%
- Equity multiple
- 0.97×
- Total profit
- $-1,396
- Equity at exit
- $22,351
- IRR
- 8.8%
- Equity multiple
- 1.67×
- Total profit
- $28,278
- Equity at exit
- $12,961
Cash invested: $41,972 (down + closing). Projections, not guarantees.
Landlord ↔ Tenant lean methodology
- Overall (STATE)
- 81 Strongly Landlord-Friendly
- State Missouri
- 81 Strongly Landlord-Friendly · R+10
- County
- — inherits STATE
- City
- — inherits STATE
ZIP-level market 65781
- Home prices YoY
- -27.1%
- Active inventory
- 93
- Price-to-rent
- 7.3×
Monthly cashflow live
- Estimated rent
- $1,722 medium interval (Pro) →
- Mortgage (P&I)
- −$786
- Tax from tax record
- −$153 /mo · $1,830/yr
- Insurance
- −$62
- HOA
- −$0
- Vacancy / Maint / Mgmt
- −$362
- Net cashflow
- $359
Break-even live
Sensitivity live
| Price | -10% $444 | -5% $402 | +0% $359 | +5% $317 | +10% $275 |
|---|---|---|---|---|---|
| Rent | -10% $223 | -5% $291 | +0% $359 | +5% $427 | +10% $495 |
| Rate | -1.0pp $435 | -0.5pp $398 | base $359 | +0.5pp $321 | +1.0pp $281 |
UW: 25.0% down · 7.5% · 30yr · 1.5% tax · 5.0% vac · 8.0% maint · 8.0% mgmt
Financing live
Cash to close
- Down payment
- $37,475
- Closing costs
- $4,497
- Reserves months
- —
- Total cash needed
- —
Loan-product check · same deal, 3 products live
Conventional
25% down · 7.5% · 30yr
- Down + closing
- —
- Monthly P&I
- —
- Monthly cashflow
- —
- DSCR
- —
- Eligible?
- —
Personal DTI + credit; lowest rate.
DSCR
20% down · 8.5% · 30yr
- Down + closing
- —
- Monthly P&I
- —
- Monthly cashflow
- —
- DSCR
- —
- Eligible?
- —
No personal income docs; deal must DSCR.
Hard money
10% down · 12.0% · 12mo
- Down + closing
- —
- Monthly P&I
- —
- Monthly cashflow
- —
- DSCR
- —
- Eligible?
- —
Short-term bridge; refi at stabilization.
Listing history 7 events
-
2026-04-13status Pending
-
2026-04-08$149,900 Active
-
2008-12-17soldstatus
-
2008-12-17soldstatus
-
2005-03-09soldstatus
-
2002-07-09soldstatus
-
2001-03-21soldstatus
ⓘ Source: listings_history table (triggers on properties + properties_extension) + one-shot
backfill from property_details.listing_events for pre-trigger history.
Tax reassessment forecast MO · Resets to sale price
- Current annual tax
- $1,830 · $153/mo
- Projected year-2 tax
- $1,830 · $153/mo
- Expected delta
- $0/yr ($0/mo · -0.0%)
ⓘ Screening estimate from a state-policy table — verify with the county assessor before closing.
Climate risk First Street
- Flood 1/10 Low FEMA zone X (unshaded) · 0% chance over 30 yrs
- Wildfire 3/10 Moderate
- Heat 5/10 Major 7 d/yr ≥106°F today · 20 d/yr by 30 yrs out
- Wind 2/10 Low 100% chance of damaging wind over 30 yrs
- Air quality 1/10 Low 0 unhealthy d/yr today · 0 by 30 yrs out
Nearby sold comps map
Loading sold comps map…
Walkable amenities ~0.75 mi
Loading nearby amenities…
Taxation est. · year 1
- Rental income
- $20,665
- − Mortgage interest
- −$8,397
- − Property taxes
- −$1,830
- − Insurance
- −$750
- − Repairs & maintenance
- −$1,653
- − Management
- −$1,653
- − Depreciation
- −$4,361
- Taxable income
- $2,022
- Est. tax owed @ 24.0%
- −$485
- After-tax cash flow
- $3,828/yr
For passive investors: Depreciation is non-cash, so a rental often shows a tax loss while cash-flowing — sheltering income. Rental losses are passive: they offset passive income freely, and up to $25,000/yr can offset ordinary (W-2) income if you actively participate and your MAGI is under $100k (phasing out to $0 by $150k); unused losses carry forward. On sale, claimed depreciation is recaptured at up to 25%, and gains may owe capital-gains tax (a 1031 exchange can defer both). Figures are a year-1 estimate at your 24.0% rate — not tax advice; consult a CPA.
Schools (NCES district)
- District
- Willard R-II
- NCES district ID
- 2932010
- Math proficiency
- 41% ▼ -2.00%
- Reading proficiency
- 50% ▼ -2.00%
- Median HH income
- $50,200
- Composite
- 39.04/100
- National rank
- #4063
- State rank
- #83 of 324 in MO
Livability — Willard
- Score
- 73/100
- State rank
- #79
- US rank
- #5258
Category grades
Schools grade is shown separately in the Schools card above.
Census & demographics
- Census place
- Willard, MO
- Population (ZIP)
- 9,160
Population outlook (Greene County) Hauer SSP2
- Today (2025)
- 319,054 people
- By 2030
- 335,135 · +5.0%
- By 2040
- 366,186 · +14.8%
- By 2050
- 397,431 · +24.6%
- By 2075
- 477,035 · +49.5%
- By 2100
- 520,828 · +63.2%
Race, ethnicity, and origin ACS 2023
- Neighborhood character
- Predominantly White (93%)
- Race & ethnicity
- White 93% Two or more races 5% Hispanic / Latino 4%
- Common ancestry
- Iranian 4% Italian 3% Slovak 2%
- Foreign-born
- 2% · Canada
- Languages at home
- 96% English-only · Spanish 2% Russian/Polish/Slavic 2%
Political lean MEDSL · Greene
- 2024 margin
- Strong R (+20.8) · D 38.9% · R 59.7% · Other 1.4%
- 2008→2024 swing
- -5.0pp toward R · 2008: -15.8pp · 2024: -20.8pp
- All cycles
- 2024: R+20.8 2020: R+20.1 2016: R+27.4 2012: R+24.4 2008: R+15.8
Not yet ingested
- Civics
- —
Market trends
- HPI YoY
- ▼ -80.06%
- Current HPI
- 214.9498
- Rent YoY
- —
- Metro
- —
- State GDP YoY
- ▲ 1.84%
- F500 in state
- 20
Industry mix (Fortune 500 HQ in MO)
| Industry | F500 HQs | Revenue |
|---|---|---|
| Healthcare | 1 | $163B |
|
||
| Insurance | 1 | $21B |
|
||
| Industrial Technology | 1 | $17B |
|
||
| Retail | 1 | $16B |
|
||
| Industrial Distribution | 1 | $10B |
|
||
| Utilities | 1 | $9B |
|
||
Price history
7 events — show timeline
- 2026-04-13 Pending — SOMO
- 2026-04-08 Listed $149,900 SOMO
- 2008-12-17 Sold (Public Records) — Public Records
- 2008-12-17 Sold (Public Records) — Public Records
- 2005-03-09 Sold (Public Records) — Public Records
- 2002-07-09 Sold (Public Records) — Public Records
- 2001-03-21 Sold (Public Records) — Public Records
Property tax history
+5.7%/yrLatest (2025): $1,830 · +32.3% YoY. Source: county tax records.
Cash-flow waterfall
monthlySold comps — $/sqft
last 12 mo · ≤1 miLoading sold comps…