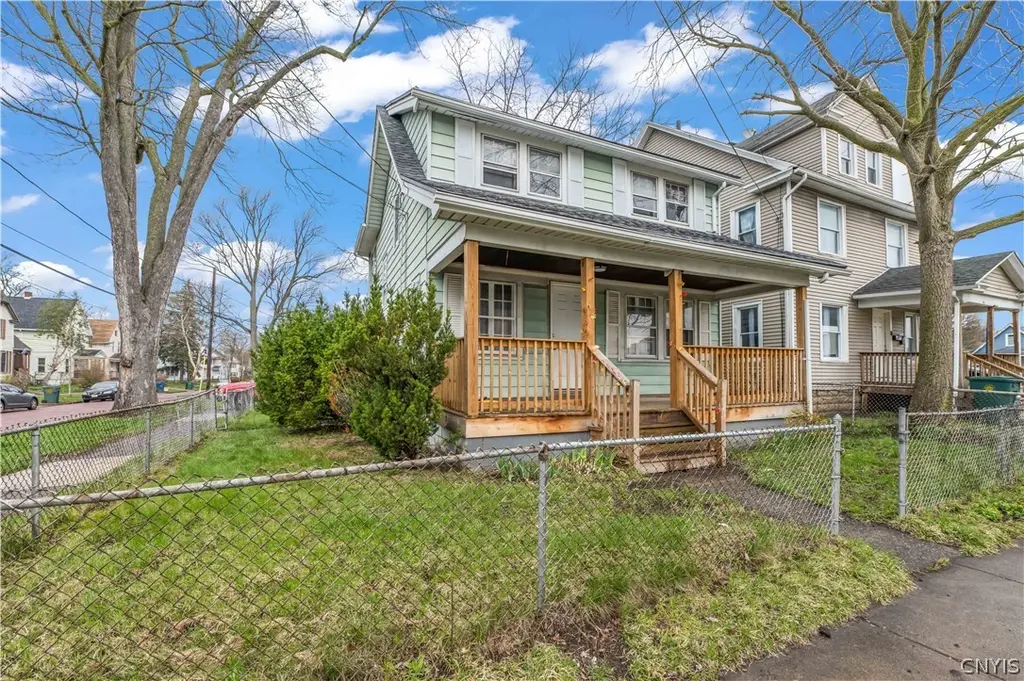
44 Wabash St · Rochester, NY
Flood risk 3/10 · Minor
- FEMA flood zone
- X (unshaded)
- Chance of flooding over 30 yrs
- 0.1%
- Est. flood insurance / yr
- $473 – $860
Fire risk 1/10 · Minimal
- Est. fire insurance / yr
- $691 – $1,283
Heat risk 2/10 · Minimal
- Hot days now (above 95°F)
- 7 days/yr
- Hot days in 30 yrs
- 15 days/yr
Wind risk 1/10 · Minimal
- Chance of severe wind over 30 yrs
- —
Air-quality risk 2/10 · Minimal
- Unhealthy air days now
- 1 days/yr
- Unhealthy air days in 30 yrs
- 2 days/yr
Risk factors via First Street. Map © Google.
Why this score? — see what drove the B grade
The composite is a weighted blend of 9 inputs, each scored 0–100. Each bar is that input's sub-score; the figure is the points it added to the 100-point composite (weight × sub-score).
- Cash flow +30.0/30.0
- 1% rule +10.0/10.0
- DSCR +10.0/10.0
- ARV discount +7.5/15.0
- Rent growth +4.5/5.0
- Livability +3.8/5.0
- Condition / age +2.5/5.0
- Schools +1.9/10.0
- Appreciation +0.0/10.0
$84,900
🖨 Deal sheet 📄 Offer letter ✓ Due diligence
Listing remarks
This 3 bedroom home offers solid potential for investors or owner occupants looking to build equity. Featuring over 1,200 sq ft of living space, this property is ready for your vision and updates.
Key facts
- 4,400 sq ft lot
- 2 garage spots
- Built 1900
Neighborhood map
What this means for you Summary
Snapshot
- This is a 3-bed/1.5-bath single-family listed at $85k.
Deal economics
- At list price, monthly cash flow is $840 ($10k/yr) — positive.
- The deal already cash-flows at list — no discount required.
- Meets the 1% rule at list price ($2k rent vs $85k).
- Cap rate 18.2% vs local median 9.3% in Rochester — top-decile yield for the area; either an underpriced asset or a hidden risk that comps aren't pricing in. Stress-test before assuming the spread holds.
Location & tenants
- Location reads 76/100 on livability (#222 in NY, #3,482 nationally) — a middle-class / working-renter tenant base. Strengths: commute A+, cost of living A+, housing A+; Watch: schools D+, crime F, employment F.
- Rochester City School District (urban): math 21% / reading 26% proficiency, ranked #589 of 590 in NY (top 100%) — low school quality limits family demand, transient renter base, plan for 1-2y turnover; 82% free/reduced lunch — lower-income household profile, screen leases tightly.
- Market conditions: Rents rising fast (+7.9%/yr); 199 active listings in the ZIP; 40 comparable units currently listed for rent nearby; rentals at typical pace (median 21d on market — plan ~3-4 weeks tenant-placement turnaround); 1,169 units permitted in Monroe County in 2024 (591 in 5+ unit buildings).
- This rent runs 32% of the median local income ($65k/yr) — at the standard rent-burdened threshold; future hikes will face affordability resistance.
Forward outlook
- Local home prices are declining (-3.0%/yr); year-one equity from $587 of loan paydown is wiped out by about $3k of value loss. Plan a longer hold.
- Monroe County population projected to shrink 6% by 2050 — rents likely to lag national; underwrite the cash flow, not the appreciation.
- At projected returns (-3.0% appreciation + 7.9% rent growth), your $24k cash investment doubles in ~3 years — after that, you're playing with house money.
Negotiation context
- Only 6 days on market — expect competitive offers; lowballing is unlikely to land.
- 2 sale attempts with the ask held roughly flat each time — persistent listings suggest the price (not the market) is what's stuck; bring a comps-based counter.
Risks & watch-outs
- Watch-outs: built in 1900 — expect roof / HVAC / electrical / plumbing capex.
Questions for the listing agent
- Built in 1900 — when were the roof, HVAC, electrical panel, plumbing, and water heater last replaced?
- Is there a deadline driving the sale (1031 exchange, divorce, estate, relocation)? That informs how much negotiation room exists.
- Schools are D-rated, which usually means shorter tenancies and higher turnover. Who's the typical renter profile here, and what's been the actual vacancy rate?
- Crime grade is F in this area — have there been break-ins, vandalism, or insurance claims at this property in the last 3 years? What carrier currently insures it and at what premium?
- What's the average days-on-market for RENTAL listings here right now (not sales)? A rising rental-DOM trend means longer vacancies and softer asking-rent achievability than the comps imply.
- What's the recent tenant-quality profile in this submarket — average credit score on applications, eviction rate, late-payment / NSF rate, and stable-employment percentage? A property-management company in the area should have these aggregated.
- How much new for-sale + rental construction is in the pipeline within 1–3 miles? Heavy new supply typically softens prices + rents 12–24 months out; constrained supply supports both.
Investment metrics
- 1% rule
- 2.04% ✓
- Cap rate
- 18.17%
- Cash-on-cash
- 42.41%
- DSCR
- 2.89
- GRM
- 4.1
CMA / ARV
- ARV (on-the-fly)
- $175,168
- Comps found
- 12
Show comp detail 12 sales within ~0.75 mi
| Address | Dist | Beds/Ba | Sqft | Sold | Price | $/sf | Match |
|---|---|---|---|---|---|---|---|
| 865 N Goodman St | 0.04mi | 4/1.5 (+1) | 1,245 (-3%) | 2mo | $76,000 | $61 | 86 |
| 147 5th St | 0.19mi | 4/1.0 (+1) | 1,289 (+0%) | 3mo | $150,000 | $116 | 82 |
| 144 Peck St | 0.41mi | 3/1.5 | 1,264 (-2%) | 0mo | $173,000 | $137 | 77 |
| 157 Cummings St | 0.45mi | 3/2.0 | 1,272 (-1%) | 2mo | $250,000 | $197 | 73 |
| 155 3rd St | 0.30mi | 4/1.0 (+1) | 1,392 (+8%) | 2mo | $67,500 | $48 | 64 |
| 1015 N Goodman St | 0.25mi | 3/1.0 | 1,126 (-13%) | 3mo | $135,000 | $120 | 63 |
| 281 Ellison St | 0.49mi | 4/3.0 (+1) | 1,350 (+5%) | 0mo | $184,000 | $136 | 58 |
| 163 Winterroth St | 0.38mi | 4/1.0 (+1) | 1,410 (+10%) | 2mo | $100,000 | $71 | 57 |
| 1824 Clifford Ave | 0.58mi | 3/1.0 | 1,188 (-8%) | 2mo | $62,500 | $53 | 56 |
| 227 Newcomb St | 0.75mi | 3/2.0 | 1,372 (+6%) | 1mo | $225,000 | $164 | 52 |
| 201 Arbutus St | 0.73mi | 4/1.5 (+1) | 1,180 (-8%) | 0mo | $210,000 | $178 | 47 |
| 82 Willmont St | 0.67mi | 2/1.0 (-1) | 1,100 (-15%) | 1mo | $155,000 | $141 | 36 |
Match score weights: distance 35% · size 25% · config 20% · recency 20%. Top-matched comps best support the ARV.
Projected returns pro-forma
-3.0% appreciation · 7.89% rent growth · sell at horizon
- IRR
- 44.4%
- Equity multiple
- 3.05×
- Total profit
- $48,669
- Equity at exit
- $12,659
- IRR
- 52.4%
- Equity multiple
- 7.38×
- Total profit
- $151,784
- Equity at exit
- $7,341
Cash invested: $23,772 (down + closing). Projections, not guarantees.
Landlord ↔ Tenant lean methodology
- Overall (STATE)
- 15 Strongly Tenant-Friendly
- State New York
- 15 Strongly Tenant-Friendly · D+10
- County
- — inherits STATE
- City
- — inherits STATE
ZIP-level market 14609
- Home prices YoY
- -30.4%
- Rents YoY
- 7.9%
- Active inventory
- 199
- Price-to-rent
- 4.1×
Monthly cashflow live
- Estimated rent
- $1,730 high interval (Pro) →
- Mortgage (P&I)
- −$445
- Tax from tax record
- −$46 /mo · $548/yr
- Insurance
- −$35
- HOA
- −$0
- Vacancy / Maint / Mgmt
- −$363
- Net cashflow
- $840
Break-even live
UW: 25.0% down · 7.5% · 30yr · 1.5% tax · 5.0% vac · 8.0% maint · 8.0% mgmt
Financing live
Cash to close
- Down payment
- $21,225
- Closing costs
- $2,547
- Reserves months
- —
- Total cash needed
- —
Loan-product check · same deal, 3 products live
Conventional
25% down · 7.5% · 30yr
- Down + closing
- —
- Monthly P&I
- —
- Monthly cashflow
- —
- DSCR
- —
- Eligible?
- —
Personal DTI + credit; lowest rate.
DSCR
20% down · 8.5% · 30yr
- Down + closing
- —
- Monthly P&I
- —
- Monthly cashflow
- —
- DSCR
- —
- Eligible?
- —
No personal income docs; deal must DSCR.
Hard money
10% down · 12.0% · 12mo
- Down + closing
- —
- Monthly P&I
- —
- Monthly cashflow
- —
- DSCR
- —
- Eligible?
- —
Short-term bridge; refi at stabilization.
Rent comps 40 comps
| Address | Beds | Baths | Sqft | Rent | $/sqft | DOM | Units | Dist |
|---|---|---|---|---|---|---|---|---|
| 52 Frances St Rochester, NY | 4.0 | 1.0 | 1256 | $1,595 | $1.27 | 43d | 1 | 0.15mi |
| 147 5th St Rochester, NY | 4.0 | 1.0 | 1289 | $1,950 | $1.51 | 21d | 1 | 0.20mi |
| 86-88 Baycliff Dr Unit 86 Rochester, NY | 2.0 | 1.0 | 900 | $1,030 | $1.14 | 21d | 1 | 0.31mi |
| 126 Parsells Ave Rochester, NY | 3.0 | 1.0 | 1574 | $1,800 | $1.14 | 43d | 1 | 0.36mi |
| 126 Parsells Ave Rochester, NY | 3.0 | 1.0 | 1574 | $1,800 | $1.14 | 21d | 1 | 0.36mi |
| 47 Priscilla St Rochester, NY | 4.0 | 1.5 | 1250 | $1,900 | $1.52 | 21d | 1 | 0.37mi |
| 222 Ellison St Rochester, NY | 2.0 | 1.0 | 971 | $1,000 | $1.03 | 13d | 1 | 0.41mi |
| 195 Parsells Ave Rochester, NY | 4.0 | 1.0 | 1413 | $1,265 | $0.90 | 3d | 1 | 0.45mi |
| 1890 Clifford Ave Rochester, NY | 3.0 | 1.0 | 936 | $1,800 | $1.92 | 23d | 1 | 0.62mi |
| 25 Trust St Rochester, NY | 3.0 | 1.5 | 1003 | $1,600 | $1.60 | 3d | 1 | 0.66mi |
| 459-461 Parsells Ave Rochester, NY | 2.0 | 1.0 | 1053 | $1,450 | $1.38 | 23d | 1 | 0.75mi |
| 207 Lux St Rochester, NY | 4.0 | 1.5 | 1728 | $2,150 | $1.24 | 10d | 1 | 0.81mi |
| 127 Carter St #125 Rochester, NY | 2.0 | 1.0 | 1320 | $1,400 | $1.06 | 43d | 1 | 0.82mi |
| 811 Portland Ave Rochester, NY | 2.0 | 1.0 | 1616 | $1,300 | $0.80 | 14d | 1 | 0.85mi |
| 420 Rosewood Ter Rochester, NY | 3.0 | 1.0 | 1246 | $1,300 | $1.04 | 3d | 1 | 0.85mi |
| 326 Northland Ave Rochester, NY | 3.0 | 1.0 | 1168 | $1,500 | $1.28 | 2d | 1 | 0.90mi |
| 1159 Culver Rd Unit A2 UP Rochester, NY | 3.0 | 1.0 | 1313 | $1,500 | $1.14 | 43d | 1 | 0.90mi |
| 395 Alexander St Unit UN12 Rochester, NY | 2.0 | 1.5 | 1226 | $2,200 | $1.79 | 14d | 1 | 1.02mi |
| 108 Bowman St Unit 1 Rochester, NY | 3.0 | 1.0 | 1200 | $1,600 | $1.33 | 43d | 1 | 1.02mi |
| 733 University Ave #3 Rochester, NY | 3.0 | 1.5 | 1400 | $1,850 | $1.32 | 43d | 1 | 1.04mi |
| 21 Rundel Park Unit 2 Rochester, NY | 2.0 | 1.0 | 1250 | $2,099 | $1.68 | 18d | 1 | 1.07mi |
| 182 Laurelton Rd Unit 182 Rochester, NY | 2.0 | 1.5 | 1000 | $1,600 | $1.60 | 10d | 1 | 1.07mi |
| 176 Roycroft Dr Rochester, NY | 3.0 | 1.0 | 1169 | $950 | $0.81 | 10d | 1 | 1.08mi |
| 171 Mohawk St Rochester, NY | 3.0 | 2.0 | 1054 | $1,775 | $1.68 | 43d | 1 | 1.09mi |
| 933 University Ave Rochester, NY | 1.0–2.0 | 1.0–2.0 | 1295 | $3,815 | $2.94 | 2d | 12 | 1.13mi |
| — Rochester, NY | 2.0 | 1.0 | 896 | $1,100 | $1.23 | 13d | 1 | 1.14mi |
| 474 East Ave Rochester, NY | 1.0–2.0 | 1.0–2.0 | 1125 | $2,800 | $2.49 | 23d | 1 | 1.20mi |
| 1079 Garson Ave Rochester, NY | 3.0 | 1.5 | 1273 | $2,100 | $1.65 | 10d | 1 | 1.24mi |
| 152 Gibbs St Rochester, NY | 1.0–2.0 | 1.0 | 950 | $1,875 | $1.97 | 13d | 3 | 1.27mi |
| 322 Wisconsin St Rochester, NY | 2.0 | 1.0 | 1100 | $1,200 | $1.09 | 21d | 1 | 1.28mi |
| 128 Gibbs St Unit 136 Rochester, NY | 2.0 | 1.0 | 900 | $1,795 | $1.99 | 10d | 1 | 1.30mi |
| 128 Gibbs St Unit 130 Rochester, NY | 2.0 | 1.0 | 1000 | $1,875 | $1.88 | 10d | 1 | 1.30mi |
| 200 East Ave Rochester, NY | 1.0–2.0 | 1.0–2.5 | 936 | $2,481 | $2.65 | 43d | 1 | 1.30mi |
| 15 Vick Park B Unit A Rochester, NY | 2.0 | 1.5 | 1616 | $2,350 | $1.45 | 23d | 1 | 1.31mi |
| 36 Charwood Cir Irondequoit, NY | 1.0–2.0 | 1.0–1.5 | 930 | $2,005 | $2.16 | 2d | 9 | 1.32mi |
| 36 Charwood Cir Irondequoit, NY | 2.0 | 1.0–1.5 | 1000 | $1,675 | $1.68 | 43d | 3 | 1.32mi |
| 100 Fairbanks St Rochester, NY | 2.0 | 1.0 | 1456 | $1,100 | $0.76 | 44d | 1 | 1.34mi |
| 59 Clark Ave Rochester, NY | 4.0 | 1.0 | 1728 | $1,800 | $1.04 | 2d | 1 | 1.34mi |
| 21 Arnold Park Rochester, NY | 2.0 | 1.0 | 750 | $1,425 | $1.90 | 2d | 15 | 1.40mi |
| 260 Oxford St Unit UP Rochester, NY | 2.0 | 1.0 | 1850 | $2,600 | $1.41 | 43d | 1 | 1.41mi |
Listing history 4 events
-
2026-04-23status Pending
-
2026-04-16$84,900 Active
-
2026-03-06historical $1,650
-
2026-02-03$1,650
ⓘ Source: listings_history table (triggers on properties + properties_extension) + one-shot
backfill from property_details.listing_events for pre-trigger history.
Tax reassessment forecast NY · Partial reset (capped growth)
- Current annual tax
- $548 · $46/mo
- Projected year-2 tax
- $992 · $83/mo
- Expected delta
- +$443/yr (+$37/mo · 80.8%)
ⓘ Screening estimate from a state-policy table — verify with the county assessor before closing.
Climate risk First Street
- Flood 3/10 Moderate FEMA zone X (unshaded) · 10% chance over 30 yrs
- Wildfire 1/10 Low
- Heat 2/10 Low 7 d/yr ≥95°F today · 15 d/yr by 30 yrs out
- Wind 1/10 Low
- Air quality 2/10 Low 1 unhealthy d/yr today · 2 by 30 yrs out
Nearby sold comps map
Loading sold comps map…
Walkable amenities ~0.75 mi
Loading nearby amenities…
Taxation est. · year 1
- Rental income
- $20,756
- − Mortgage interest
- −$4,756
- − Property taxes
- −$548
- − Insurance
- −$424
- − Repairs & maintenance
- −$1,660
- − Management
- −$1,660
- − Depreciation
- −$2,470
- Taxable income
- $9,236
- Est. tax owed @ 24.0%
- −$2,217
- After-tax cash flow
- $7,865/yr
For passive investors: Depreciation is non-cash, so a rental often shows a tax loss while cash-flowing — sheltering income. Rental losses are passive: they offset passive income freely, and up to $25,000/yr can offset ordinary (W-2) income if you actively participate and your MAGI is under $100k (phasing out to $0 by $150k); unused losses carry forward. On sale, claimed depreciation is recaptured at up to 25%, and gains may owe capital-gains tax (a 1031 exchange can defer both). Figures are a year-1 estimate at your 24.0% rate — not tax advice; consult a CPA.
Schools (NCES district)
- District
- Rochester City School District
- NCES district ID
- 3624750
- Math proficiency
- 21% ▬ 0.00%
- Reading proficiency
- 26% ▲ 4.00%
- Median HH income
- $30,923
- Composite
- 18.98/100
- National rank
- #8850
- State rank
- #589 of 590 in NY
Livability — Rochester
- Score
- 76/100
- State rank
- #222
- US rank
- #3482
Category grades
Schools grade is shown separately in the Schools card above.
Census & demographics
- Census place
- Rochester, NY
- County
- Monroe County · 674,131 people
- City population
- 432,803
- Metro
- Rochester, NY
- Population (ZIP)
- 40,274
- Household income
- $64,603
- Rent vs Own
- Severe rent burden
- 2183.0
Population outlook (Monroe County) Hauer SSP2
- Today (2025)
- 759,460 people
- By 2030
- 757,154 · -0.3%
- By 2040
- 740,644 · -2.5%
- By 2050
- 714,443 · -5.9%
- By 2075
- 645,883 · -15.0%
- By 2100
- 547,084 · -28.0%
Race, ethnicity, and origin ACS 2023
- Neighborhood character
- Diverse neighborhood (Simpson 0.69)
- Race & ethnicity
- White 44% Black 28% Hispanic / Latino 20% Two or more races 10% Asian 2%
- Hispanic origin (detail)
- Puerto Rican 15% Cuban 1% Dominican 1%
- Common ancestry
- Romanian 4% Lithuanian 2% Iranian 1%
- Foreign-born
- 8% · Canada
- Languages at home
- 81% English-only · Spanish 14% Russian/Polish/Slavic 2% Other Indo-European 1%
Political lean MEDSL · Monroe
- 2024 margin
- D (+19.1) · D 59.5% · R 40.5%
- 2008→2024 swing
- +1.4pp toward D · 2008: 17.7pp · 2024: 19.1pp
- All cycles
- 2024: D+19.1 2020: D+21.0 2016: D+14.1 2012: D+17.4 2008: D+17.7
Not yet ingested
- Civics
- —
Market trends
- HPI YoY
- ▼ -143.57%
- Current HPI
- 328.7053
- Rent YoY
- ▲ 7.89%
- Metro
- Rochester, NY
- State GDP YoY
- ▲ 2.60%
- F500 in state
- 92
Industry mix (Fortune 500 HQ in NY)
| Industry | F500 HQs | Revenue |
|---|---|---|
| Financial Services | 10 | $950B |
|
||
| Consumer Goods | 9 | $162B |
|
||
| Insurance | 4 | $225B |
|
||
| Telecommunications | 2 | $144B |
|
||
| Pharmaceuticals | 2 | $112B |
|
||
| Media / Entertainment | 2 | $69B |
|
||
Price history
+5045.5% since first listed4 events — show timeline
- 2026-04-23 Pending — CNYIS
- 2026-04-16 Listed $84,900 CNYIS
- 2026-03-06 Rental Removed $1,650 TURBOTENANT
- 2026-02-03 Listed for Rent $1,650 TURBOTENANT
Property tax history
+0.9%/yrLatest (2025): $548 · +0.0% YoY. Source: county tax records.
Cash-flow waterfall
monthlySold comps — $/sqft
last 12 mo · ≤1 miLoading sold comps…