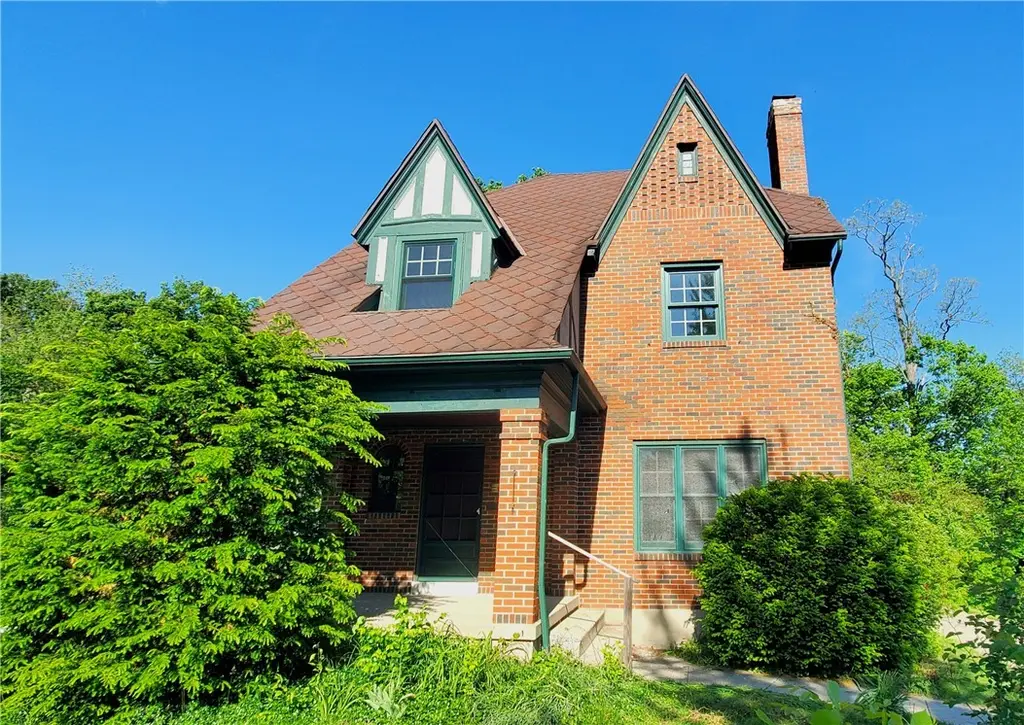
1936 Burroughs Dr · Dayton, OH
Flood risk 1/10 · Minimal
- FEMA flood zone
- X (unshaded)
- Chance of flooding over 30 yrs
- 0.0%
- Est. flood insurance / yr
- $473 – $860
Fire risk 1/10 · Minimal
- Est. fire insurance / yr
- $713 – $1,323
Heat risk 3/10 · Minor
- Hot days now (above 103°F)
- 7 days/yr
- Hot days in 30 yrs
- 18 days/yr
Wind risk 2/10 · Minimal
- Chance of severe wind over 30 yrs
- —
Air-quality risk 3/10 · Minor
- Unhealthy air days now
- 2 days/yr
- Unhealthy air days in 30 yrs
- 4 days/yr
Risk factors via First Street. Map © Google.
Why this score? — see what drove the D+ grade
The composite is a weighted blend of 9 inputs, each scored 0–100. Each bar is that input's sub-score; the figure is the points it added to the 100-point composite (weight × sub-score).
- Cash flow +15.4/30.0
- ARV discount +12.5/15.0
- DSCR +4.7/10.0
- 1% rule +3.8/10.0
- Rent growth +3.3/5.0
- Livability +3.2/5.0
- Condition / age +2.5/5.0
- Schools +1.3/10.0
- Appreciation +0.0/10.0
$139,000
🖨 Deal sheet 📄 Offer letter ✓ Due diligence
Listing remarks
Solid brick beauty in College Hill / Dayton Triangle on a sought-after street with lots of character! Traditional two-story solid with a large lounge, dining room, kitchen and extra pantry / storage room. 1/2 bath just off stairs to basement, and a shower was installed downstairs as well off the kitchen. Mature landscaping with lots of great plants just needs some love. Covered front porch and a screened "catio" out back accessed from french doors in the dining room. Gorgeous wood staircase leads up to 3 generous sized bedrooms and a large full bathroom. Detached two-car garage with side entrance. Lots of dry storage in full basement. Water heater 2016. Natural gas water boiler r
Key facts
- Covered front porch
- Large lounge
- Extra pantry
Tags
Property features AI
Finance
- Financial info: Offered for sale
Exterior
- Parking: Detached two-car garage with additional storage
- Security: Smoke detectors
- Utilities: Public water; Sewer available (storm sewer)
- Home design: 2-story brick home; Residential zoning
- Construction: Brick construction; Full basement with approx. 624 sq ft below grade unfinished area
- Exterior features: Partial fencing; Porch; Yard on a rectangular lot (approx. 50 x 137 x 50 x 133)
Interior
- Kitchen: Cooktop; Range; Refrigerator; Pantry
- Bedrooms: Three bedrooms on the second floor (approx. 11 x 10; 14 x 10; 15 x 13)
- Bathrooms: One full bathroom; One half bathroom (main level)
- Heating & cooling: Natural gas heating with radiant system; Window air conditioning units
- Interior features: Pantry; Bay windows with vinyl and wood frames; Full basement
- Laundry & utility: Washer; Dryer; Gas water heater; Utility room on main level (approx. 9 x 9)
Neighborhood map
What this means for you Summary
Snapshot
- This is a 3-bed/1.5-bath single-family listed at $139k.
Deal economics
- At list price, monthly cash flow is $52 ($627/yr) — positive.
- The deal already cash-flows at list — no discount required.
- To meet the 1% rule (rent ≥ 1% of price), the offer needs to be $122k (12.0% below list).
- Recommended offer: $122k (12.0% below list) — sets the bar for 1% rule.
Location & tenants
- Location reads 65/100 on livability (#716 in OH) — a middle-class / working-renter tenant base. Strengths: cost of living A+, housing A+, health & safety A; Watch: schools C-, amenities C-, crime F.
- Dayton City (urban): math 12% / reading 21% proficiency, ranked #641 of 656 in OH (top 98%) — low school quality limits family demand, transient renter base, plan for 1-2y turnover; 74% free/reduced lunch — lower-income household profile, screen leases tightly.
- Market conditions: Rents rising (+3.0%/yr); 156 active listings in the ZIP; 40 comparable units currently listed for rent nearby; rentals lingering (median 44d on market — plan ~5-8 weeks vacancy on turnover, expect pricing pressure); 58% of comp listings sitting > 30 days — soft ceiling on asking rent; lower-income renter base — watch delinquency; 907 units permitted in Montgomery County in 2024 (416 in 5+ unit buildings).
- This rent runs 35% of the median local income ($42k/yr) — at the standard rent-burdened threshold; future hikes will face affordability resistance.
Forward outlook
- Local home prices are declining (-3.0%/yr); year-one equity from $961 of loan paydown is wiped out by about $4k of value loss. Plan a longer hold.
- Montgomery County population projected at -10% by 2050 — secular population decline; favor cash flow + early exit over multi-decade hold.
Negotiation context
- Only 1 days on market — expect competitive offers; lowballing is unlikely to land.
- Current owner paid $75k; list at $139k implies a 86% gain — meaningful room to come down on a strong offer.
Risks & watch-outs
- Watch-outs: built in 1928 — expect roof / HVAC / electrical / plumbing capex.
Questions for the listing agent
- Built in 1928 — when were the roof, HVAC, electrical panel, plumbing, and water heater last replaced?
- Is there a deadline driving the sale (1031 exchange, divorce, estate, relocation)? That informs how much negotiation room exists.
- Crime grade is F in this area — have there been break-ins, vandalism, or insurance claims at this property in the last 3 years? What carrier currently insures it and at what premium?
- The area grade is low — what's the realistic commute time and amenity access for the typical tenant pool here? Any planned neighborhood developments (good or bad) we should know about?
- What's the average days-on-market for RENTAL listings here right now (not sales)? A rising rental-DOM trend means longer vacancies and softer asking-rent achievability than the comps imply.
- What's the recent tenant-quality profile in this submarket — average credit score on applications, eviction rate, late-payment / NSF rate, and stable-employment percentage? A property-management company in the area should have these aggregated.
- How much new for-sale + rental construction is in the pipeline within 1–3 miles? Heavy new supply typically softens prices + rents 12–24 months out; constrained supply supports both.
Investment metrics
- 1% rule
- 0.88% ✗
- Cap rate
- 6.74%
- Cash-on-cash
- 1.61%
- DSCR
- 1.07
- GRM
- 9.5
CMA / ARV
- ARV (on-the-fly)
- $156,426
- Comps found
- 12
Show comp detail 12 sales within ~0.75 mi
| Address | Dist | Beds/Ba | Sqft | Sold | Price | $/sf | Match |
|---|---|---|---|---|---|---|---|
| 1936 Burroughs Dr | 0.00mi | 3/1.5 | 1,682 (0%) | 0mo | $135,000 | $80 | 100 |
| 1984 Burroughs Dr | 0.07mi | 3/1.5 | 1,912 (+14%) | 7mo | $255,000 | $133 | 68 |
| 520 Alameda Pl | 0.22mi | 4/1.0 (+1) | 1,816 (+8%) | 3mo | $95,000 | $52 | 67 |
| 633 Ridgedale Rd | 0.59mi | 3/2.0 | 1,660 (-1%) | 5mo | $175,000 | $105 | 64 |
| 2006 Victoria Ave | 0.29mi | 4/2.5 (+1) | 1,516 (-10%) | 4mo | $177,500 | $117 | 58 |
| 1439 Kumler Ave | 0.71mi | 3/1.5 | 1,768 (+5%) | 5mo | $165,000 | $93 | 54 |
| 1516 Kumler Ave | 0.66mi | 3/1.5 | 1,516 (-10%) | 1mo | $100,000 | $66 | 52 |
| 1628 Philadelphia Dr | 0.38mi | 4/3.5 (+1) | 1,888 (+12%) | 0mo | $270,000 | $143 | 49 |
| 725 Sunnyview Ave | 0.73mi | 3/1.0 | 1,561 (-7%) | 7mo | $93,500 | $60 | 46 |
| 2239 Mayfair Rd | 0.67mi | 3/2.0 | 1,489 (-12%) | 4mo | $38,940 | $26 | 44 |
| 1549 Cory Dr | 0.65mi | 3/1.5 | 1,922 (+14%) | 2mo | $195,000 | $101 | 44 |
| 1104 Sunnyview Ave | 0.66mi | 4/2.0 (+1) | 1,836 (+9%) | 5mo | $155,000 | $84 | 43 |
Match score weights: distance 35% · size 25% · config 20% · recency 20%. Top-matched comps best support the ARV.
Projected returns pro-forma
-3.0% appreciation · 3.03% rent growth · sell at horizon
- IRR
- -13.7%
- Equity multiple
- 0.51×
- Total profit
- $-19,168
- Equity at exit
- $20,725
- IRR
- -4.8%
- Equity multiple
- 0.68×
- Total profit
- $-12,295
- Equity at exit
- $12,018
Cash invested: $38,920 (down + closing). Projections, not guarantees.
Landlord ↔ Tenant lean methodology
- Overall (STATE)
- 73 Landlord-Friendly
- State Ohio
- 73 Landlord-Friendly · R+6
- County
- — inherits STATE
- City
- — inherits STATE
ZIP-level market 45406
- Rents YoY
- 3.0%
- Active inventory
- 156
- Price-to-rent
- 9.5×
Monthly cashflow live
- Estimated rent
- $1,223 high interval (Pro) →
- Mortgage (P&I)
- −$729
- Tax from tax record
- −$127 /mo · $1,523/yr
- Insurance
- −$58
- HOA
- −$0
- Vacancy / Maint / Mgmt
- −$257
- Net cashflow
- $52
Break-even live
UW: 25.0% down · 7.5% · 30yr · 1.5% tax · 5.0% vac · 8.0% maint · 8.0% mgmt
Financing live
Cash to close
- Down payment
- $34,750
- Closing costs
- $4,170
- Reserves months
- —
- Total cash needed
- —
Loan-product check · same deal, 3 products live
Conventional
25% down · 7.5% · 30yr
- Down + closing
- —
- Monthly P&I
- —
- Monthly cashflow
- —
- DSCR
- —
- Eligible?
- —
Personal DTI + credit; lowest rate.
DSCR
20% down · 8.5% · 30yr
- Down + closing
- —
- Monthly P&I
- —
- Monthly cashflow
- —
- DSCR
- —
- Eligible?
- —
No personal income docs; deal must DSCR.
Hard money
10% down · 12.0% · 12mo
- Down + closing
- —
- Monthly P&I
- —
- Monthly cashflow
- —
- DSCR
- —
- Eligible?
- —
Short-term bridge; refi at stabilization.
Rent comps 40 comps
| Address | Beds | Baths | Sqft | Rent | $/sqft | DOM | Units | Dist |
|---|---|---|---|---|---|---|---|---|
| 1927 Burroughs Dr Dayton, OH | 3.0 | 2.0 | 1409 | $1,245 | $0.88 | 14d | 1 | 0.05mi |
| 2232 Salem Ave Dayton, OH | 3.0 | 1.0 | 1250 | $1,200 | $0.96 | 3d | 1 | 0.15mi |
| 2247 Salem Ave Unit 2249 Dayton, OH | 3.0 | 1.5 | 1300 | $1,400 | $1.08 | 43d | 1 | 0.17mi |
| 2247 Salem Ave Unit 2247 Dayton, OH | 3.0 | 1.5 | 1300 | $1,350 | $1.04 | 3d | 1 | 0.17mi |
| 2141 Philadelphia Dr Dayton, OH | 3.0 | 1.0 | 1736 | $1,395 | $0.80 | 43d | 1 | 0.32mi |
| 1004 W Fairview Ave Dayton, OH | 2.0 | 1.0 | 1053 | $950 | $0.90 | 23d | 1 | 0.35mi |
| 1743 Radcliffe Rd Dayton, OH | 3.0 | 1.5 | 1729 | $1,200 | $0.69 | 43d | 1 | 0.39mi |
| 1019 Cherry Dr Dayton, OH | 4.0 | 1.0 | 1057 | $1,125 | $1.06 | 43d | 1 | 0.47mi |
| 439 W Fairview Ave Dayton, OH | 3.0 | 1.0 | 1500 | $1,200 | $0.80 | 43d | 1 | 0.62mi |
| 3207 Cornell Dr Dayton, OH | 3.0 | 1.0 | 1168 | $1,000 | $0.86 | 3d | 1 | 0.69mi |
| 201 W Norman Ave Dayton, OH | 3.0 | 1.0 | 1424 | $1,200 | $0.84 | 43d | 1 | 0.77mi |
| 181 W Norman Ave Dayton, OH | 3.0 | 2.0 | 1228 | $1,150 | $0.94 | 43d | 1 | 0.80mi |
| 1378 Cory Dr Dayton, OH | 2.0 | 1.0 | 1300 | $975 | $0.75 | 43d | 1 | 0.82mi |
| 167 W Hudson Ave Dayton, OH | 3.0 | 1.5 | 1344 | $1,185 | $0.88 | 43d | 1 | 0.82mi |
| 265 Victor Ave Dayton, OH | 3.0 | 1.0 | 1204 | $900 | $0.75 | 43d | 1 | 0.87mi |
| 3668 Karwin Dr Unit 3672 Dayton, OH | 2.0 | 1.0 | 1500 | $995 | $0.66 | 23d | 1 | 0.88mi |
| 3672 Karwin Dr Unit 3672 Dayton, OH | 2.0 | 1.0 | 1500 | $995 | $0.66 | 43d | 1 | 0.89mi |
| 234 Santa Clara Ave Dayton, OH | 3.0 | 1.0 | 1368 | $1,125 | $0.82 | 43d | 1 | 0.90mi |
| 1225 Amherst Pl Dayton, OH | 3.0 | 1.0 | 1548 | $1,300 | $0.84 | 14d | 1 | 0.93mi |
| 518 Delaware Ave Dayton, OH | 2.0 | 1.0 | 1500 | $750 | $0.50 | 43d | 1 | 0.93mi |
| 101 W Norman Ave Unit 101 Dayton, OH | 3.0 | 1.0 | 1600 | $945 | $0.59 | 43d | 1 | 0.95mi |
| 1067 Salem Ave Dayton, OH | 2.0 | 1.0 | 1100 | $900 | $0.82 | 43d | 1 | 0.97mi |
| 1067 Salem Ave Unit 3 Dayton, OH | 2.0 | 1.5 | 1100 | $900 | $0.82 | 43d | 1 | 0.97mi |
| 1067 Salem Ave Unit 2 Dayton, OH | 2.0 | 1.5 | 1100 | $900 | $0.82 | 43d | 1 | 0.97mi |
| 26 W Beechwood Ave Dayton, OH | 3.0 | 1.5 | 1468 | $1,050 | $0.72 | 43d | 1 | 0.99mi |
| 41 W Fairview Ave Unit 2 Dayton, OH | 3.0 | 1.0 | 1452 | $1,200 | $0.83 | 14d | 1 | 1.02mi |
| 1045 Shakespeare Ave Dayton, OH | 3.0 | 1.0 | 1435 | $1,275 | $0.89 | 43d | 1 | 1.04mi |
| 1045 Philadelphia Dr Dayton, OH | 2.0 | 1.0 | 1290 | $1,150 | $0.89 | 2d | 1 | 1.04mi |
| 39 E Maplewood Ave Dayton, OH | 4.0 | 1.5 | 1560 | $1,050 | $0.67 | 3d | 1 | 1.14mi |
| 38 Pointview Ave Dayton, OH | 2.0 | 1.0 | 1140 | $900 | $0.79 | 14d | 1 | 1.14mi |
| 42 Pointview Ave Unit 42 Dayton, OH | 3.0 | 2.0 | 1240 | $1,200 | $0.97 | 3d | 1 | 1.15mi |
| 65 E Maplewood Ave Dayton, OH | 2.0 | 1.0 | 1064 | $723 | $0.68 | 43d | 1 | 1.18mi |
| 52 Fernwood Ave Dayton, OH | 2.0 | 1.0 | 1926 | $925 | $0.48 | 43d | 1 | 1.19mi |
| 31 E Norman Ave Dayton, OH | 3.0 | 1.0 | 1100 | $1,150 | $1.05 | 23d | 1 | 1.19mi |
| 424 Lexington Ave Dayton, OH | 3.0 | 2.0 | 1536 | $1,025 | $0.67 | 43d | 1 | 1.19mi |
| 942 Harvard Blvd Dayton, OH | 3.0 | 2.0 | 1596 | $1,200 | $0.75 | 3d | 1 | 1.20mi |
| 147 Laura Ave Dayton, OH | 2.0 | 1.0 | 1096 | $975 | $0.89 | 23d | 1 | 1.24mi |
| 101 E Bruce Ave Dayton, OH | 3.0 | 1.0 | 1455 | $1,150 | $0.79 | 2d | 1 | 1.26mi |
| 660 Gramont Ave Dayton, OH | 3.0 | 1.0 | 1142 | $1,050 | $0.92 | 3d | 1 | 1.26mi |
| 338 Kenwood Ave Dayton, OH | 3.0 | 1.5 | 1512 | $1,195 | $0.79 | 43d | 1 | 1.29mi |
Listing history 4 events
-
2026-05-11status Pending
-
2026-05-09$139,000 Active
-
1996-09-17soldstatus $74,900
-
1996-09-17soldstatus $74,900
ⓘ Source: listings_history table (triggers on properties + properties_extension) + one-shot
backfill from property_details.listing_events for pre-trigger history.
Tax reassessment forecast OH · Partial reset (capped growth)
- Current annual tax
- $1,523 · $127/mo
- Projected year-2 tax
- $1,846 · $154/mo
- Expected delta
- +$323/yr (+$27/mo · 21.2%)
ⓘ Screening estimate from a state-policy table — verify with the county assessor before closing.
Climate risk First Street
- Flood 1/10 Low FEMA zone X (unshaded) · 0% chance over 30 yrs
- Wildfire 1/10 Low
- Heat 3/10 Moderate 7 d/yr ≥103°F today · 18 d/yr by 30 yrs out
- Wind 2/10 Low
- Air quality 3/10 Moderate 2 unhealthy d/yr today · 4 by 30 yrs out
Nearby sold comps map
Loading sold comps map…
Walkable amenities ~0.75 mi
Loading nearby amenities…
Taxation est. · year 1
- Rental income
- $14,673
- − Mortgage interest
- −$7,786
- − Property taxes
- −$1,523
- − Insurance
- −$695
- − Repairs & maintenance
- −$1,174
- − Management
- −$1,174
- − Depreciation
- −$4,044
- Taxable loss
- −$1,722
- Est. tax savings @ 24.0%
- +$413
- After-tax cash flow
- $1,040/yr
For passive investors: Depreciation is non-cash, so a rental often shows a tax loss while cash-flowing — sheltering income. Rental losses are passive: they offset passive income freely, and up to $25,000/yr can offset ordinary (W-2) income if you actively participate and your MAGI is under $100k (phasing out to $0 by $150k); unused losses carry forward. On sale, claimed depreciation is recaptured at up to 25%, and gains may owe capital-gains tax (a 1031 exchange can defer both). Figures are a year-1 estimate at your 24.0% rate — not tax advice; consult a CPA.
Schools (NCES district)
- District
- Dayton City
- NCES district ID
- 3904384
- Math proficiency
- 12% ▼ -12.00%
- Reading proficiency
- 21% ▼ -11.00%
- Median HH income
- $28,688
- Composite
- 12.94/100
- National rank
- #9579
- State rank
- #641 of 656 in OH
Livability — Dayton
- Score
- 65/100
- State rank
- #716
- US rank
- #12895
Category grades
Schools grade is shown separately in the Schools card above.
Census & demographics
- Census place
- Dayton, OH
- County
- Montgomery County · 459,541 people
- City population
- 164,387
- Metro
- Dayton-Kettering, OH
- Population (ZIP)
- 19,991
- Household income
- $41,796
- Rent vs Own
- Severe rent burden
- 1504.0
Population outlook (Montgomery County) Hauer SSP2
- Today (2025)
- 523,241 people
- By 2030
- 514,948 · -1.6%
- By 2040
- 493,378 · -5.7%
- By 2050
- 469,639 · -10.2%
- By 2075
- 418,360 · -20.0%
- By 2100
- 353,315 · -32.5%
Race, ethnicity, and origin ACS 2023
- Neighborhood character
- Predominantly Black (75%)
- Race & ethnicity
- Black 75% White 16% Two or more races 7% Hispanic / Latino 3%
- Common ancestry
- Italian 2% Lithuanian 1% Slovak 1%
- Foreign-born
- 2% · Canada
- Languages at home
- 97% English-only · Spanish 1%
Political lean MEDSL · Montgomery
- 2024 margin
- Toss-up / Even · D 49.8% · R 49.3%
- 2008→2024 swing
- -5.8pp toward R · 2008: 6.2pp · 2024: 0.5pp
- All cycles
- 2024: D+0.5 2020: D+2.2 2016: R+1.2 2012: D+3.1 2008: D+6.2
Not yet ingested
- Civics
- —
Market trends
- HPI YoY
- ▼ -113.75%
- Current HPI
- 197.1302
- Rent YoY
- ▲ 3.03%
- Metro
- Dayton-Kettering, OH
- State GDP YoY
- ▲ 1.98%
- F500 in state
- 48
Industry mix (Fortune 500 HQ in OH)
| Industry | F500 HQs | Revenue |
|---|---|---|
| Insurance | 3 | $145B |
|
||
| Industrial Machinery | 3 | $49B |
|
||
| Financial Services | 3 | $24B |
|
||
| Consumer Goods | 2 | $93B |
|
||
| Aerospace / Defense | 2 | $47B |
|
||
| Utilities | 2 | $33B |
|
||
Price history
+85.6% since first listed4 events — show timeline
- 2026-05-11 Pending — Dayton MLS
- 2026-05-09 Listed $139,000 Dayton MLS
- 1996-09-17 Sold (Public Records) $74,900 Public Records
- 1996-09-17 Sold (Public Records) $74,900 Public Records
Property tax history
-1.7%/yrLatest (2025): $1,523 · -0.2% YoY. Source: county tax records.
Cash-flow waterfall
monthlySold comps — $/sqft
last 12 mo · ≤1 miLoading sold comps…