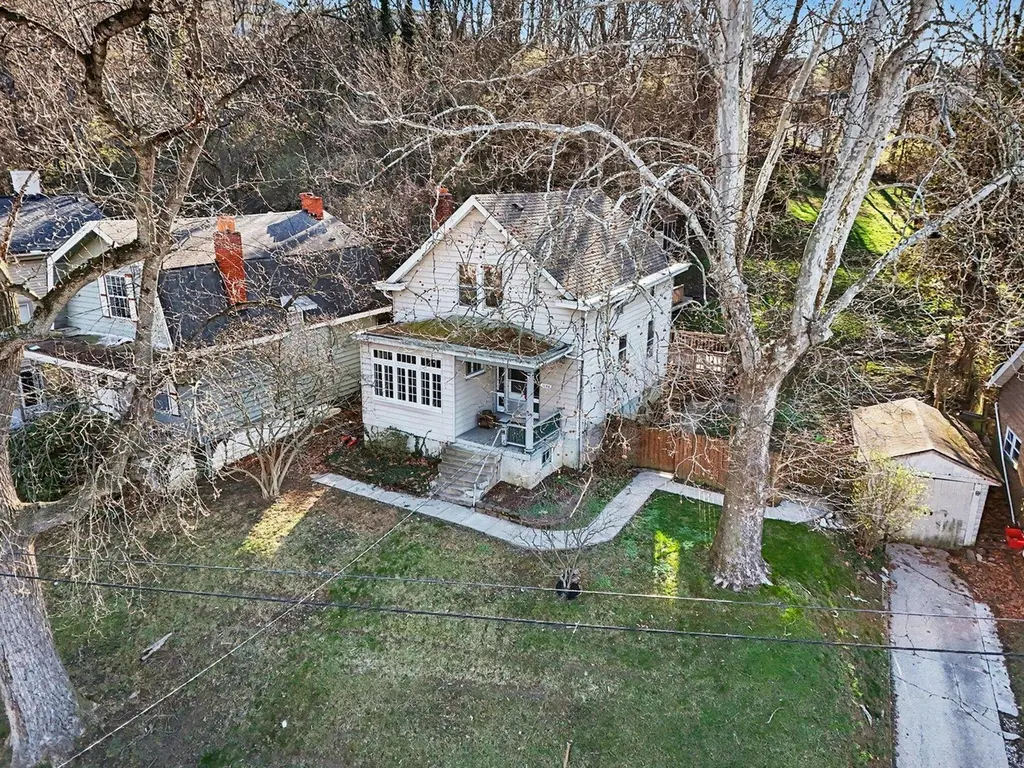
1146 Waterworks Rd · Woodlawn, KY
Flood risk 6/10 · Moderate
- FEMA flood zone
- X (unshaded)
- Chance of flooding over 30 yrs
- 0.49%
- Est. flood insurance / yr
- $507 – $1,088
Fire risk 1/10 · Minimal
- Est. fire insurance / yr
- $839 – $1,559
Heat risk 4/10 · Minor
- Hot days now (above 103°F)
- 7 days/yr
- Hot days in 30 yrs
- 19 days/yr
Wind risk 2/10 · Minimal
- Chance of severe wind over 30 yrs
- 1.0%
Air-quality risk 3/10 · Minor
- Unhealthy air days now
- 2 days/yr
- Unhealthy air days in 30 yrs
- 3 days/yr
Risk factors via First Street. Map © Google.
Why this score? — see what drove the C grade
The composite is a weighted blend of 9 inputs, each scored 0–100. Each bar is that input's sub-score; the figure is the points it added to the 100-point composite (weight × sub-score).
- Cash flow +19.6/30.0
- ARV discount +15.0/15.0
- DSCR +6.2/10.0
- Livability +4.4/5.0
- 1% rule +4.3/10.0
- Schools +4.0/10.0
- Rent growth +3.7/5.0
- Condition / age +2.5/5.0
- Appreciation +0.0/10.0
$199,900
🖨 Deal sheet (PDF) 📄 Offer letter ✓ Due diligence
Listing remarks MLS
Elegance and Charm-Hardwood floors throughout-Sunny Solarium adjoins Living Room w/wood burning fireplace & insert-Huge double lot with privacy-The 30 foot Deck can hold even the Largest Party.
Key facts
- Huge double lot
- Hardwood floors
- 0.4 acre lot
Tags
Property features AI
Exterior
- Parking: Detached garage; Driveway; Garage faces front; 1 garage space
- Utilities: Public water; Public sewer; Cable available; Water available; Sewer available
- Home design: Single family house; One and one-half stories
- Construction: Aluminum siding; Wood siding; Shingle roof; Poured concrete foundation; Built as existing structure
- Exterior features: Deck; Enclosed porch; Porch; Private yard; Cleared lot
Interior
- Kitchen: Electric cooktop; Gas cooktop; Electric oven; Refrigerator
- Bedrooms: Primary bedroom (15 x 14); Bedroom 2 (15 x 17)
- Bathrooms: 2 full bathrooms
- Heating & cooling: Forced air heating; Central air conditioning
- Interior features: Kitchen island; Pantry; Eat-in kitchen; Entrance foyer; Storage; Wood-burning fireplace with insert
- Laundry & utility: Washer hookup; Electric dryer hookup; Laundry in basement
Neighborhood map
What this means for you Summary
Snapshot
- This is a 2-bed/2.0-bath single-family listed at $200k.
Deal economics
- At list price, monthly cash flow is $232 ($3k/yr) — positive.
- The deal already cash-flows at list — no discount required.
- To meet the 1% rule (rent ≥ 1% of price), the offer needs to be $187k (6.7% below list).
- Recommended offer: $187k (6.7% below list) — sets the bar for 1% rule.
Location & tenants
- Location reads 88/100 on livability (#23 in KY, #178 nationally) — a professional / high-income tenant draw. Strengths: amenities A+, commute A+, cost of living A+; Watch: employment C-.
- Campbell County (suburban): math 43% / reading 47% proficiency, ranked #15 of 165 in KY (top 9%) — families likely to look elsewhere, expect single-tenant / working-renter base with shorter leases.
- Zoned schools: Crossroads Elementary School (math 39% / reading 37%, grade F, #242 of 676 statewide, top 37%, 613 students, 58% FRL); Campbell County Middle School (math 37% / reading 45%, grade F, #54 of 217 statewide, top 25%, 1,184 students, 45% FRL); Campbell County High School (math 35% / reading 43%, grade F, #51 of 254 statewide, top 21%, 1,551 students, 41% FRL).
- Market conditions: Rents rising fast (+4.6%/yr); 236 active listings in the ZIP; 14 comparable units currently listed for rent nearby; rentals at typical pace (median 22d on market — plan ~3-4 weeks tenant-placement turnaround); 247 units permitted in Campbell County in 2024 (77 in 5+ unit buildings).
- This rent runs 37% of the median local income ($60k/yr) — at the standard rent-burdened threshold; future hikes will face affordability resistance.
Forward outlook
- Local home prices are declining (-3.0%/yr); year-one equity from $1k of loan paydown is wiped out by about $6k of value loss. Plan a longer hold.
Negotiation context
- It's been on market 37 days — a 3% lower offer ($194k) is reasonable based on typical stale-listing flexibility.
- 5 sale attempts since 25y ago with the ask held roughly flat each time — persistent listings suggest the price (not the market) is what's stuck; bring a comps-based counter.
- Current owner paid $132k; list at $200k implies a 51% gain — meaningful room to come down on a strong offer.
Risks & watch-outs
- Watch-outs: built in 1912 — expect roof / HVAC / electrical / plumbing capex.
- Climate carrying-cost: major flood risk — expect insurance premiums to compound above CPI over the hold.
Questions for the listing agent
- It's been on market 37 days. Have you received any prior offers? Is the seller open to a 7% concession, seller financing, or rate buy-down credit?
- Built in 1912 — when were the roof, HVAC, electrical panel, plumbing, and water heater last replaced?
- Is there a deadline driving the sale (1031 exchange, divorce, estate, relocation)? That informs how much negotiation room exists.
- Schools are B-rated — typically a magnet for longer-tenancy family renters. What's the average tenant stay here, and is there a school-zone premium baked into asking?
- What's the average days-on-market for RENTAL listings here right now (not sales)? A rising rental-DOM trend means longer vacancies and softer asking-rent achievability than the comps imply.
- What's the recent tenant-quality profile in this submarket — average credit score on applications, eviction rate, late-payment / NSF rate, and stable-employment percentage? A property-management company in the area should have these aggregated.
- How much new for-sale + rental construction is in the pipeline within 1–3 miles? Heavy new supply typically softens prices + rents 12–24 months out; constrained supply supports both.
Investment metrics
- 1% rule
- 0.93% ✗
- Cap rate
- 7.68%
- Cash-on-cash
- 4.97%
- DSCR
- 1.22
- GRM
- 8.9
CMA / ARV
- ARV (median comp)
- $284,690
- List price
- $199,900
- Delta
- -29.78%
- Verdict
- UNDERPRICED
- Comps
- 20 within 1.0 mi
Show comp detail 12 sales within ~0.75 mi
| Address | Dist | Beds/Ba | Sqft | Sold | Price | $/sf | Match |
|---|---|---|---|---|---|---|---|
| 29 E Crescent Ave | 0.14mi | 2/1.0 | 1,620 (-1%) | 7mo | $226,000 | $140 | 82 |
| 104 Bonnie Leslie Ave | 0.23mi | 3/1.0 (+1) | 1,591 (-3%) | 6mo | $293,000 | $184 | 70 |
| 1157 Park Ave | 0.45mi | 2/2.0 | 1,564 (-5%) | 4mo | $290,000 | $185 | 68 |
| 506 Center St | 0.51mi | 2/1.0 | 1,611 (-2%) | 3mo | $315,000 | $196 | 67 |
| 5 S Sherry Ln | 0.39mi | 2/1.5 | 1,540 (-6%) | 6mo | $248,000 | $161 | 65 |
| 1200 Wilson Rd | 0.19mi | 3/1.0 (+1) | 1,440 (-12%) | 8mo | $319,000 | $222 | 54 |
| 927 Boone St | 0.69mi | 3/2.0 (+1) | 1,697 (+3%) | 7mo | $287,000 | $169 | 51 |
| 727 Linden Ave | 0.60mi | 2/1.5 | 1,460 (-11%) | 1mo | $302,000 | $207 | 50 |
| 611 E 9th St | 0.62mi | 3/2.0 (+1) | 1,533 (-7%) | 7mo | $385,000 | $251 | 49 |
| 918 Park Ave | 0.62mi | 2/2.0 | 1,854 (+13%) | 1mo | $280,000 | $151 | 49 |
| 820 E 7th St | 0.62mi | 2/1.5 | 1,474 (-10%) | 4mo | $425,000 | $288 | 49 |
| 505 Ward Ave | 0.72mi | 3/1.5 (+1) | 1,536 (-6%) | 8mo | $350,000 | $228 | 42 |
Match score weights: distance 35% · size 25% · config 20% · recency 20%. Top-matched comps best support the ARV.
Projected returns pro-forma
-3.0% appreciation · 4.64% rent growth · sell at horizon
- IRR
- -6.9%
- Equity multiple
- 0.74×
- Total profit
- $-14,559
- Equity at exit
- $29,806
- IRR
- 4.4%
- Equity multiple
- 1.35×
- Total profit
- $19,373
- Equity at exit
- $17,284
Cash invested: $55,972 (down + closing). Projections, not guarantees.
Landlord ↔ Tenant lean methodology
- Overall (STATE)
- 83 Strongly Landlord-Friendly
- State Kentucky
- 83 Strongly Landlord-Friendly · R+16
- County
- — inherits STATE
- City
- — inherits STATE
ZIP-level market 41071
- Rents YoY
- 4.6%
- Active inventory
- 236
- Price-to-rent
- 8.9×
Monthly cashflow live
- Estimated rent
- $1,866 high interval (Pro) →
- Mortgage (P&I)
- −$1,048
- Tax from tax record
- −$110 /mo · $1,325/yr
- Insurance
- −$83
- HOA
- −$0
- Vacancy / Maint / Mgmt
- −$392
- Net cashflow
- $232
Break-even live
Sensitivity live
| Price | -10% $345 | -5% $288 | +0% $232 | +5% $175 | +10% $119 |
|---|---|---|---|---|---|
| Rent | -10% $84 | -5% $158 | +0% $232 | +5% $305 | +10% $379 |
| Rate | -1.0pp $332 | -0.5pp $283 | base $232 | +0.5pp $180 | +1.0pp $127 |
UW: 25.0% down · 7.5% · 30yr · 1.5% tax · 5.0% vac · 8.0% maint · 8.0% mgmt
Financing live
Cash to close
- Down payment
- $49,975
- Closing costs
- $5,997
- Reserves months
- —
- Total cash needed
- —
Loan-product check · same deal, 3 products live
Conventional
25% down · 7.5% · 30yr
- Down + closing
- —
- Monthly P&I
- —
- Monthly cashflow
- —
- DSCR
- —
- Eligible?
- —
Personal DTI + credit; lowest rate.
DSCR
20% down · 8.5% · 30yr
- Down + closing
- —
- Monthly P&I
- —
- Monthly cashflow
- —
- DSCR
- —
- Eligible?
- —
No personal income docs; deal must DSCR.
Hard money
10% down · 12.0% · 12mo
- Down + closing
- —
- Monthly P&I
- —
- Monthly cashflow
- —
- DSCR
- —
- Eligible?
- —
Short-term bridge; refi at stabilization.
Rent comps 14 comps
| Address | Beds | Baths | Sqft | Rent | $/sqft | DOM | Units | Dist |
|---|---|---|---|---|---|---|---|---|
| 327 Covert Run Pike Unit 1 Bellevue, KY | 2.0 | 2.0 | 1580 | $1,850 | $1.17 | 24d | 1 | 0.58mi |
| 239 Grandview Ave Bellevue, KY | 2.0 | 2.0 | 1093 | $1,645 | $1.50 | 5d | 2 | 0.69mi |
| 929 Boone St Newport, KY | 2.0 | 2.0 | 1458 | $1,495 | $1.03 | 44d | 1 | 0.69mi |
| 1044 Washington Ave #2 Newport, KY | 2.0 | 2.0 | 1250 | $1,800 | $1.44 | 44d | 1 | 0.76mi |
| 814 Washington Ave Unit 2 Newport, KY | 2.0 | 2.0 | 1450 | $1,500 | $1.03 | 24d | 1 | 0.85mi |
| 118 Beech St Newport, KY | 3.0 | 2.0 | 1610 | $2,400 | $1.49 | 2d | 1 | 1.06mi |
| 236 Ward Ave Bellevue, KY | 3.0 | 2.0 | 1500 | $2,585 | $1.72 | 12d | 1 | 1.11mi |
| 324 Fairfield Ave Unit 4 Bellevue, KY | 2.0 | 1.0 | 1095 | $1,545 | $1.41 | 22d | 1 | 1.11mi |
| 324 Fairfield Ave Unit 1 Bellevue, KY | 2.0 | 1.0 | 1080 | $1,685 | $1.56 | 3d | 1 | 1.11mi |
| 100 Aqua Way Newport, KY | 1.0–3.0 | 1.0–2.0 | 1092 | $2,834 | $2.60 | 2d | 4 | 1.18mi |
| 203 W 8th St Newport, KY | 2.0 | 1.5 | 1456 | $2,300 | $1.58 | 22d | 1 | 1.28mi |
| 809 Isabella St Newport, KY | 2.0 | 2.0 | 1519 | $2,200 | $1.45 | 44d | 1 | 1.33mi |
| 3949 Vision CIR Southgate, KY | 1.0–2.0 | 1.0–2.0 | 1132 | $2,515 | $2.22 | 2d | 10 | 1.38mi |
| 210 W 5th St Newport, KY | 1.0–2.0 | 1.0–2.0 | 845 | $1,800 | $2.13 | 3d | 15 | 1.38mi |
Listing history 28 events
-
2026-06-18days on market $199,900 Active 37 DOM
-
2026-06-17days on market $199,900 Active 36 DOM
-
2026-06-16days on market $199,900 Active 35 DOM
-
2026-06-15days on market $199,900 Active 34 DOM
-
2026-06-13days on market $199,900 Active 32 DOM
-
2026-06-09days on market $199,900 Active 28 DOM
-
2026-06-08days on market $199,900 Active 27 DOM
-
2026-06-07days on market $199,900 Active 26 DOM
-
2026-06-05days on market $199,900 Active 23 DOM
-
2026-06-03days on market $199,900 Active 22 DOM
-
2026-06-02days on market $199,900 Active 21 DOM
-
2026-06-01days on market $199,900 Active 20 DOM
-
2026-05-31days on market $199,900 Active 19 DOM
-
2026-05-12$199,900 Active 718-char remark
-
2026-05-04price $199,900
-
2026-04-15status Active
-
2026-04-15price $207,000
-
2026-04-09status Pending
-
2026-04-09historical
-
2026-03-27price $214,900
-
2026-03-13$220,000 Active
-
2006-07-26soldstatus $132,000
-
2006-07-21soldstatus $132,000
Show marketing remark (197 chars)
Elegance and Charm-Hardwood floors throughout-Sunny Solarium adjoins Living Room w/wood burning fireplace & insert-Huge double lot with privacy-The 30 foot Deck can hold even the Largest Party.
-
2006-04-03$137,500
Show marketing remark (197 chars)
Elegance and Charm-Hardwood floors throughout-Sunny Solarium adjoins Living Room w/wood burning fireplace & insert-Huge double lot with privacy-The 30 foot Deck can hold even the Largest Party.
-
2001-09-04soldstatus $95,500
-
2001-08-31soldstatus $95,500
-
2001-06-25$92,900
-
1994-05-04soldstatus $67,900
ⓘ Source: listings_history table (triggers on properties + properties_extension) + one-shot
backfill from property_details.listing_events for pre-trigger history.
Tax reassessment forecast KY · Resets to sale price
- Current annual tax
- $1,325 · $110/mo
- Projected year-2 tax
- $1,719 · $143/mo
- Expected delta
- +$395/yr (+$33/mo · 29.8%)
ⓘ Screening estimate from a state-policy table — verify with the county assessor before closing.
Climate risk First Street
- Flood 6/10 Major FEMA zone X (unshaded) · 49% chance over 30 yrs
- Wildfire 1/10 Low
- Heat 4/10 Moderate 7 d/yr ≥103°F today · 19 d/yr by 30 yrs out
- Wind 2/10 Low 100% chance of damaging wind over 30 yrs
- Air quality 3/10 Moderate 2 unhealthy d/yr today · 3 by 30 yrs out
Nearby sold comps map
Loading sold comps map…
Walkable amenities ~0.75 mi
Loading nearby amenities…
Taxation est. · year 1
- Rental income
- $22,386
- − Mortgage interest
- −$11,198
- − Property taxes
- −$1,325
- − Insurance
- −$1,000
- − Repairs & maintenance
- −$1,791
- − Management
- −$1,791
- − Depreciation
- −$5,815
- Taxable loss
- −$532
- Est. tax savings @ 24.0%
- +$128
- After-tax cash flow
- $2,909/yr
For passive investors: Depreciation is non-cash, so a rental often shows a tax loss while cash-flowing — sheltering income. Rental losses are passive: they offset passive income freely, and up to $25,000/yr can offset ordinary (W-2) income if you actively participate and your MAGI is under $100k (phasing out to $0 by $150k); unused losses carry forward. On sale, claimed depreciation is recaptured at up to 25%, and gains may owe capital-gains tax (a 1031 exchange can defer both). Figures are a year-1 estimate at your 24.0% rate — not tax advice; consult a CPA.
Schools (NCES district)
- District
- Campbell County
- NCES district ID
- 2100900
- Math proficiency
- 43% ▼ -11.00%
- Reading proficiency
- 47% ▼ -14.00%
- Median HH income
- $62,891
- Composite
- 39.86/100
- National rank
- #3864
- State rank
- #15 of 165 in KY
Livability — Woodlawn
- Score
- 88/100
- State rank
- #23
- US rank
- #178
Category grades
Schools grade is shown separately in the Schools card above.
Census & demographics
- Census place
- Woodlawn, KY
- County
- Campbell County · 84,793 people
- Metro
- Cincinnati, OH-KY-IN
- Population (ZIP)
- 19,680
- Household income
- $59,976
- Rent vs Own
- Severe rent burden
- 1136.0
Population outlook (Campbell County) Hauer SSP2
- Today (2025)
- 95,668 people
- By 2030
- 96,886 · +1.3%
- By 2040
- 97,734 · +2.2%
- By 2050
- 96,413 · +0.8%
- By 2075
- 90,211 · -5.7%
- By 2100
- 79,434 · -17.0%
Race, ethnicity, and origin ACS 2023
- Neighborhood character
- Predominantly White (84%)
- Race & ethnicity
- White 84% Black 7% Two or more races 6% Hispanic / Latino 5%
- Common ancestry
- Slovak 3% Lithuanian 2% Italian 2%
- Foreign-born
- 4% · Canada
- Languages at home
- 95% English-only · Spanish 3% Other Indo-European 1%
Political lean MEDSL · Campbell
- 2024 margin
- R (+19.7) · D 39.2% · R 58.9% · Other 1.9%
- 2008→2024 swing
- +1.2pp toward D · 2008: -20.9pp · 2024: -19.7pp
- All cycles
- 2024: R+19.7 2020: R+18.6 2016: R+24.5 2012: R+22.8 2008: R+20.9
Not yet ingested
- Civics
- —
Market trends
- HPI YoY
- ▼ -193.38%
- Current HPI
- 244.9069
- Rent YoY
- ▲ 4.64%
- Metro
- Cincinnati, OH-KY-IN
- State GDP YoY
- ▲ 1.81%
- F500 in state
- 4
Industry mix (Fortune 500 HQ in KY)
| Industry | F500 HQs | Revenue |
|---|---|---|
| Healthcare | 1 | $118B |
|
||
| Food / Beverage | 1 | $7B |
|
||
Price history
+194.4% since first listed15 events — show timeline
- 2026-05-12 Listed $199,900 NKMLS
- 2026-05-04 Price Changed $199,900 NKMLS
- 2026-04-15 Relisted — NKMLS
- 2026-04-15 Price Changed $207,000 NKMLS
- 2026-04-09 Pending — NKMLS
- 2026-04-09 Listing Removed — NKMLS
- 2026-03-27 Price Changed $214,900 NKMLS
- 2026-03-13 Listed $220,000 NKMLS
- 2006-07-26 Sold (Public Records) $132,000 Public Records
- 2006-07-21 Sold (MLS) $132,000 NKMLS
- 2006-04-03 Listed $137,500 NKMLS
- 2001-09-04 Sold (Public Records) $95,500 Public Records
- 2001-08-31 Sold (MLS) $95,500 NKMLS
- 2001-06-25 Listed $92,900 NKMLS
- 1994-05-04 Sold (Public Records) $67,900 Public Records
Property tax history
+3.7%/yrLatest (2025): $1,325 · -1.5% YoY. Source: county tax records.
Cash-flow waterfall
monthlySold comps — $/sqft
last 12 mo · ≤1 miLoading sold comps…