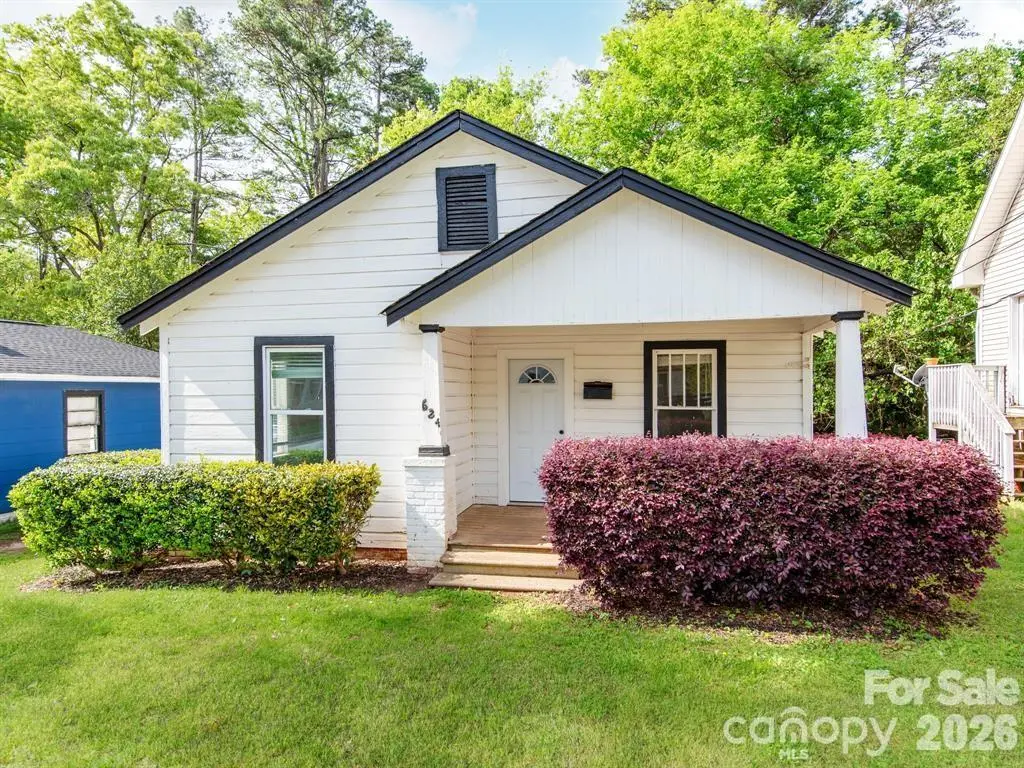
624 Morris St · Rock Hill, SC
Flood risk 1/10 · Minimal
- FEMA flood zone
- X (unshaded)
- Chance of flooding over 30 yrs
- 0.0%
- Est. flood insurance / yr
- $507 – $1,088
Fire risk 1/10 · Minimal
- Est. fire insurance / yr
- $783 – $1,453
Heat risk 6/10 · Moderate
- Hot days now (above 106°F)
- 7 days/yr
- Hot days in 30 yrs
- 16 days/yr
Wind risk 6/10 · Moderate
- Chance of severe wind over 30 yrs
- 27.0%
Air-quality risk 3/10 · Minor
- Unhealthy air days now
- 2 days/yr
- Unhealthy air days in 30 yrs
- 3 days/yr
Risk factors via First Street. Map © Google.
Why this score? — see what drove the B- grade
The composite is a weighted blend of 9 inputs, each scored 0–100. Each bar is that input's sub-score; the figure is the points it added to the 100-point composite (weight × sub-score).
- Cash flow +26.1/30.0
- ARV discount +15.0/15.0
- DSCR +8.8/10.0
- 1% rule +6.7/10.0
- Rent growth +3.9/5.0
- Schools +3.5/10.0
- Livability +3.5/5.0
- Condition / age +2.5/5.0
- Appreciation +0.0/10.0
$135,000
🖨 Deal sheet 📄 Offer letter ✓ Due diligence
Listing remarks
Investor Cashing Out, Really Good Deal in the heart of downtown Rock Hill! Roof replaced in 2025 and updated functionality of kitchen and updated bathroom.
Key facts
- Updated bathroom
- 7,405 sq ft lot
- Built 1942
Tags
Property features AI
Finance
- HOA & community: No HOA
Exterior
- Parking: Driveway
- Utilities: City water; Public sewer
- Home design: Single family residence; Residential property; One story; Entry level: main; Zoning: SF-5
- Construction: Site-built construction; Wood construction; Other construction materials (see remarks); Crawl space foundation; Lot on a 0.17-acre parcel; Road surface: dirt, gravel, and paved; Publicly maintained road
- Exterior features: Front porch; Other exterior features (see remarks)
Interior
- Kitchen: Electric cooktop; Electric range; Refrigerator; Other kitchen features (see remarks)
- Bedrooms: 2 bedrooms on the main level
- Flooring: Laminate flooring
- Bathrooms: 1 full bathroom on the main level
- Heating & cooling: Heating: other (see remarks); Cooling: ceiling fan(s); Cooling: window unit(s); Cooling: other (see remarks)
- Interior features: 4 total rooms; Family room fireplace
- Laundry & utility: Electric dryer hookup
Neighborhood map
What this means for you Summary
Snapshot
- This is a 2-bed/1.0-bath single-family listed at $135k.
Deal economics
- At list price, monthly cash flow is $339 ($4k/yr) — positive.
- The deal already cash-flows at list — no discount required.
- Meets the 1% rule at list price ($2k rent vs $135k).
- Recommended offer: $131k (3.0% below list) — sets the bar for market timing.
- Cap rate 9.3% vs local median 3.4% in Rock Hill — top-decile yield for the area; either an underpriced asset or a hidden risk that comps aren't pricing in. Stress-test before assuming the spread holds.
Location & tenants
- Location reads 70/100 on livability (#62 in SC) — a middle-class / working-renter tenant base. Strengths: cost of living A+, housing A+, health & safety A+; Watch: schools D+, employment D+, crime D-.
- York 03 (urban): math 36% / reading 47% proficiency, ranked #32 of 80 in SC (top 40%) — families likely to look elsewhere, expect single-tenant / working-renter base with shorter leases.
- Market conditions: Rents rising fast (+5.5%/yr); 348 active listings in the ZIP; 29 comparable units currently listed for rent nearby; rentals leasing fast (median 13d on market — plan ~1-2 weeks tenant-placement turnaround); 2,550 units permitted in York County in 2024 (350 in 5+ unit buildings).
Forward outlook
- Local home prices are declining (-3.0%/yr); year-one equity from $933 of loan paydown is wiped out by about $4k of value loss. Plan a longer hold.
- York County population projected at +44% by 2050 — long-run rental-demand tailwind backs the buy-and-hold thesis.
- At projected returns (-3.0% appreciation + 5.5% rent growth), your $38k cash investment doubles in ~9 years — after that, you're playing with house money.
Negotiation context
- It's been on market 49 days — a 3% lower offer ($131k) is reasonable based on typical stale-listing flexibility.
- 4 sale attempts with the ask held roughly flat each time — persistent listings suggest the price (not the market) is what's stuck; bring a comps-based counter.
Risks & watch-outs
- Watch-outs: built in 1942 — expect roof / HVAC / electrical / plumbing capex.
- Climate carrying-cost: major wind risk, 27% chance of damaging wind over 30y; extreme-heat days projected 7→16/yr by 2055 (HVAC capex compounding) — expect insurance premiums to compound above CPI over the hold.
Questions for the listing agent
- It's been on market 49 days. Have you received any prior offers? Is the seller open to a 3% concession, seller financing, or rate buy-down credit?
- Built in 1942 — when were the roof, HVAC, electrical panel, plumbing, and water heater last replaced?
- Is there a deadline driving the sale (1031 exchange, divorce, estate, relocation)? That informs how much negotiation room exists.
- Schools are D-rated, which usually means shorter tenancies and higher turnover. Who's the typical renter profile here, and what's been the actual vacancy rate?
- Crime grade is D in this area — have there been break-ins, vandalism, or insurance claims at this property in the last 3 years? What carrier currently insures it and at what premium?
- What's the average days-on-market for RENTAL listings here right now (not sales)? A rising rental-DOM trend means longer vacancies and softer asking-rent achievability than the comps imply.
- What's the recent tenant-quality profile in this submarket — average credit score on applications, eviction rate, late-payment / NSF rate, and stable-employment percentage? A property-management company in the area should have these aggregated.
- How much new for-sale + rental construction is in the pipeline within 1–3 miles? Heavy new supply typically softens prices + rents 12–24 months out; constrained supply supports both.
Investment metrics
- 1% rule
- 1.17% ✓
- Cap rate
- 9.31%
- Cash-on-cash
- 10.77%
- DSCR
- 1.48
- GRM
- 7.1
CMA / ARV
- ARV (on-the-fly)
- $211,896
- Comps found
- 12
Show comp detail 12 sales within ~0.75 mi
| Address | Dist | Beds/Ba | Sqft | Sold | Price | $/sf | Match |
|---|---|---|---|---|---|---|---|
| 744 Cauthen St | 0.18mi | 2/1.0 | 913 (+5%) | 3mo | $212,000 | $232 | 81 |
| 612 Cauthen St | 0.23mi | 2/1.0 | 877 (+1%) | 10mo | $180,000 | $205 | 80 |
| 621 Cauthen St | 0.19mi | 2/1.0 | 806 (-8%) | 5mo | $215,000 | $267 | 74 |
| 315 Rivers St | 0.46mi | 2/1.0 | 872 (0%) | 11mo | $212,050 | $243 | 70 |
| 736 Cauthen St | 0.17mi | 2/1.0 | 771 (-12%) | 16mo | $99,500 | $129 | 60 |
| 502 Liberty St | 0.28mi | 2/1.0 | 970 (+11%) | 16mo | $192,300 | $198 | 55 |
| 862 Eastwood Dr | 0.37mi | 2/1.0 | 967 (+11%) | 12mo | $200,000 | $207 | 54 |
| 1032 Barrow Ct | 0.55mi | 3/1.0 (+1) | 947 (+9%) | 6mo | $230,000 | $243 | 50 |
| 455 Cummings St | 0.55mi | 2/1.0 | 750 (-14%) | 1mo | $199,900 | $267 | 50 |
| 930 Beverly Dr | 0.68mi | 2/1.0 | 928 (+6%) | 14mo | $299,000 | $322 | 46 |
| 1010 Beverly Dr | 0.68mi | 2/1.0 | 989 (+13%) | 3mo | $320,000 | $324 | 43 |
| 407 Cummings St | 0.65mi | 2/1.0 | 775 (-11%) | 11mo | $207,000 | $267 | 42 |
Match score weights: distance 35% · size 25% · config 20% · recency 20%. Top-matched comps best support the ARV.
Projected returns pro-forma
-3.0% appreciation · 5.53% rent growth · sell at horizon
- IRR
- 2.6%
- Equity multiple
- 1.10×
- Total profit
- $3,854
- Equity at exit
- $20,129
- IRR
- 14.4%
- Equity multiple
- 2.30×
- Total profit
- $49,018
- Equity at exit
- $11,672
Cash invested: $37,800 (down + closing). Projections, not guarantees.
Landlord ↔ Tenant lean methodology
- Overall (STATE)
- 90 Strongly Landlord-Friendly
- State South Carolina
- 90 Strongly Landlord-Friendly · R+6
- County
- — inherits STATE
- City
- — inherits STATE
ZIP-level market 29730
- Rents YoY
- 5.5%
- Active inventory
- 348
- Price-to-rent
- 7.1×
Monthly cashflow live
- Estimated rent
- $1,579 high interval (Pro) →
- Mortgage (P&I)
- −$708
- Tax from tax record
- −$144 /mo · $1,731/yr
- Insurance
- −$56
- HOA
- −$0
- Vacancy / Maint / Mgmt
- −$332
- Net cashflow
- $339
Break-even live
UW: 25.0% down · 7.5% · 30yr · 1.5% tax · 5.0% vac · 8.0% maint · 8.0% mgmt
Financing live
Cash to close
- Down payment
- $33,750
- Closing costs
- $4,050
- Reserves months
- —
- Total cash needed
- —
Loan-product check · same deal, 3 products live
Conventional
25% down · 7.5% · 30yr
- Down + closing
- —
- Monthly P&I
- —
- Monthly cashflow
- —
- DSCR
- —
- Eligible?
- —
Personal DTI + credit; lowest rate.
DSCR
20% down · 8.5% · 30yr
- Down + closing
- —
- Monthly P&I
- —
- Monthly cashflow
- —
- DSCR
- —
- Eligible?
- —
No personal income docs; deal must DSCR.
Hard money
10% down · 12.0% · 12mo
- Down + closing
- —
- Monthly P&I
- —
- Monthly cashflow
- —
- DSCR
- —
- Eligible?
- —
Short-term bridge; refi at stabilization.
Rent comps 29 comps
| Address | Beds | Baths | Sqft | Rent | $/sqft | DOM | Units | Dist |
|---|---|---|---|---|---|---|---|---|
| 522 N Jones Ave Rock Hill, SC | 2.0 | 1.0 | 1038 | $1,650 | $1.59 | 22d | 1 | 0.34mi |
| 418 Pickens Ct Rock Hill, SC | 2.0 | 2.0 | 1060 | $1,800 | $1.70 | 24d | 1 | 0.52mi |
| 316 Piedmont St Rock Hill, SC | 2.0 | 1.5 | 1014 | $1,595 | $1.57 | 24d | 1 | 0.55mi |
| 316 Piedmont St Rock Hill, SC | 2.0 | 1.5 | 1014 | $1,450 | $1.43 | 4d | 1 | 0.55mi |
| 923 Standard St Rock Hill, SC | 1.0–2.0 | 1.0 | 1025 | $1,590 | $1.55 | 1d | 4 | 0.66mi |
| 1000 Beverly Dr Rock Hill, SC | 2.0 | 1.0 | 1116 | $2,150 | $1.93 | 12d | 1 | 0.68mi |
| 1058 Eastwood Dr Rock Hill, SC | 2.0 | 1.0 | 1018 | $1,595 | $1.57 | 22d | 1 | 0.69mi |
| 130 Reid St Rock Hill, SC | 1.0 | 1.0 | 600 | $1,075 | $1.79 | 24d | 1 | 0.77mi |
| 130 Reid St Rock Hill, SC | 1.0 | 1.0 | 600 | $1,075 | $1.79 | 11d | 1 | 0.77mi |
| 226 Cummings St Rock Hill, SC | 2.0 | 1.0 | 914 | $1,599 | $1.75 | 2d | 1 | 0.78mi |
| 618 Union Ave Rock Hill, SC | 2.0 | 2.0 | 1050 | $1,475 | $1.40 | 16d | 1 | 0.84mi |
| 116 S Spruce St Unit A Rock Hill, SC | 2.0 | 2.0 | 850 | $1,200 | $1.41 | 20d | 1 | 0.86mi |
| 116 S Spruce St Apt B Rock Hill, SC | 2.0 | 2.0 | 850 | $1,235 | $1.45 | 24d | 1 | 0.86mi |
| 542 E Black St Rock Hill, SC | 2.0 | 1.0 | 850 | $1,595 | $1.88 | 4d | 1 | 0.87mi |
| 542 E Black St Rock Hill, SC | 2.0 | 1.0 | 850 | $1,595 | $1.88 | 22d | 1 | 0.87mi |
| 117 E White St Rock Hill, SC | 2.0 | 1.0–2.0 | 797 | $2,065 | $2.59 | 3d | 33 | 0.90mi |
| 565 Cedarvilla Dr Rock Hill, SC | 2.0 | 1.0 | 891 | $1,395 | $1.57 | 24d | 1 | 1.02mi |
| 589 Cedar Villa Dr Unit 589 Rock Hill, SC | 2.0 | 1.0 | 891 | $1,395 | $1.57 | 4d | 1 | 1.02mi |
| 108 E Main St Rock Hill, SC | 1.0–2.0 | 1.0–2.0 | 779 | $1,893 | $2.43 | 2d | 7 | 1.03mi |
| 819 Chestnut St Rock Hill, SC | 3.0 | 1.0 | 1014 | $1,800 | $1.78 | 4d | 1 | 1.06mi |
| 234 Saluda St Rock Hill, SC | 1.0 | 1.0 | 528 | $950 | $1.80 | 15d | 1 | 1.06mi |
| 37 Cedarvilla Dr Rock Hill, SC | 3.0 | 2.0 | 1016 | $1,700 | $1.67 | 4d | 1 | 1.09mi |
| 378 Technology Center Way Rock Hill, SC | 1.0 | 1.0 | 622 | $1,720 | $2.77 | 3d | 7 | 1.16mi |
| 371 Technology Center Way Rock Hill, SC | 1.0–2.0 | 1.0–2.0 | 832 | $2,155 | $2.59 | 3d | 37 | 1.20mi |
| 175 W Black St Rock Hill, SC | 1.0–2.0 | 1.0–2.0 | 1021 | $1,685 | $1.65 | 20d | 11 | 1.20mi |
| 175 W Black St Unit 211 Rock Hill, SC | 1.0 | 1.0 | 824 | $1,440 | $1.75 | 24d | 1 | 1.20mi |
| 658 Arch Dr Rock Hill, SC | 3.0 | 1.0 | 985 | $1,700 | $1.73 | 4d | 1 | 1.22mi |
| 1624 Pineburr Ln Rock Hill, SC | 2.0 | 1.0 | 830 | $1,600 | $1.93 | 11d | 1 | 1.43mi |
| 1624 Pineburr Ln Rock Hill, SC | 2.0 | 1.0 | 830 | $1,600 | $1.93 | 12d | 1 | 1.43mi |
Listing history 21 events
-
2026-06-18days on market $135,000 Active 49 DOM
-
2026-06-17days on market $135,000 Active 48 DOM
-
2026-06-16days on market $135,000 Active 47 DOM
-
2026-06-15days on market $135,000 Active 46 DOM
-
2026-06-13days on market $135,000 Active 44 DOM
-
2026-06-09days on market $135,000 Active 40 DOM
-
2026-06-08days on market $135,000 Active 39 DOM
-
2026-06-07days on market $135,000 Active 38 DOM
-
2026-06-04days on market $135,000 Active 35 DOM
-
2026-06-03days on market $135,000 Active 34 DOM
-
2026-06-02days on market $135,000 Active 33 DOM
-
2026-06-01days on market $135,000 Active 32 DOM
-
2026-05-31days on market $135,000 Active 31 DOM
-
2026-04-30$135,000 Active
-
2025-04-01status Active
-
2025-02-20price $269,900
-
2025-02-01status Active
-
2025-01-01$275,000 Active
-
2024-12-12historical
-
2022-07-18soldstatus $167,500
-
2022-07-18soldstatus $167,500
ⓘ Source: listings_history table (triggers on properties + properties_extension) + one-shot
backfill from property_details.listing_events for pre-trigger history.
Tax reassessment forecast SC · Resets to sale price
- Current annual tax
- $1,731 · $144/mo
- Projected year-2 tax
- $1,731 · $144/mo
- Expected delta
- $0/yr ($0/mo · 0.0%)
ⓘ Screening estimate from a state-policy table — verify with the county assessor before closing.
Climate risk First Street
- Flood 1/10 Low FEMA zone X (unshaded) · 0% chance over 30 yrs
- Wildfire 1/10 Low
- Heat 6/10 Major 7 d/yr ≥106°F today · 16 d/yr by 30 yrs out
- Wind 6/10 Major 27% chance of damaging wind over 30 yrs
- Air quality 3/10 Moderate 2 unhealthy d/yr today · 3 by 30 yrs out
Nearby sold comps map
Loading sold comps map…
Walkable amenities ~0.75 mi
Loading nearby amenities…
Taxation est. · year 1
- Rental income
- $18,951
- − Mortgage interest
- −$7,562
- − Property taxes
- −$1,731
- − Insurance
- −$675
- − Repairs & maintenance
- −$1,516
- − Management
- −$1,516
- − Depreciation
- −$3,927
- Taxable income
- $2,023
- Est. tax owed @ 24.0%
- −$486
- After-tax cash flow
- $3,584/yr
For passive investors: Depreciation is non-cash, so a rental often shows a tax loss while cash-flowing — sheltering income. Rental losses are passive: they offset passive income freely, and up to $25,000/yr can offset ordinary (W-2) income if you actively participate and your MAGI is under $100k (phasing out to $0 by $150k); unused losses carry forward. On sale, claimed depreciation is recaptured at up to 25%, and gains may owe capital-gains tax (a 1031 exchange can defer both). Figures are a year-1 estimate at your 24.0% rate — not tax advice; consult a CPA.
Schools (NCES district)
- District
- York 03
- NCES district ID
- 4503870
- Math proficiency
- 36% ▼ -8.00%
- Reading proficiency
- 47% ▲ 3.00%
- Median HH income
- $47,570
- Composite
- 35.46/100
- National rank
- #4928
- State rank
- #32 of 80 in SC
Livability — Rock Hill
- Score
- 70/100
- State rank
- #62
- US rank
- #7573
Category grades
Schools grade is shown separately in the Schools card above.
Census & demographics
- Census place
- Rock Hill, SC
- County
- York County · 281,758 people
- City population
- 115,874
- Metro
- Charlotte-Concord-Gastonia, NC-SC
- Population (ZIP)
- 58,199
- Household income
- $68,543
- Rent vs Own
- Severe rent burden
- 1869.0
Population outlook (York County) Hauer SSP2
- Today (2025)
- 307,757 people
- By 2030
- 335,979 · +9.2%
- By 2040
- 391,378 · +27.2%
- By 2050
- 443,234 · +44.0%
- By 2075
- 557,102 · +81.0%
- By 2100
- 625,837 · +103.4%
Race, ethnicity, and origin ACS 2023
- Neighborhood character
- Diverse neighborhood (Simpson 0.59)
- Race & ethnicity
- White 51% Black 39% Hispanic / Latino 4% Two or more races 4% Native American 2% Asian 1%
- Common ancestry
- Serbian 2% Slovak 2% Lithuanian 1%
- Foreign-born
- 4% · Canada, Vietnam, China
- Languages at home
- 95% English-only · Spanish 3%
Political lean MEDSL · York
- 2024 margin
- R (+19.1) · D 39.7% · R 58.8% · Other 1.5%
- 2008→2024 swing
- -1.4pp toward R · 2008: -17.7pp · 2024: -19.1pp
- All cycles
- 2024: R+19.1 2020: R+16.5 2016: R+22.1 2012: R+20.5 2008: R+17.7
Not yet ingested
- Civics
- —
Market trends
- HPI YoY
- ▼ -285.91%
- Current HPI
- 268.2609
- Rent YoY
- ▲ 5.53%
- Metro
- Charlotte-Concord-Gastonia, NC-SC
- State GDP YoY
- ▲ 4.51%
- F500 in state
- 2
Industry mix (Fortune 500 HQ in SC)
| Industry | F500 HQs | Revenue |
|---|---|---|
| Packaging | 1 | $7B |
|
||
Price history
-19.4% since first listed8 events — show timeline
- 2026-04-30 Listed $135,000 CANOPYMLS as Distributed by MLS Grid
- 2025-04-01 Relisted — CANOPYMLS as Distributed by MLS Grid
- 2025-02-20 Price Changed $269,900 CANOPYMLS as Distributed by MLS Grid
- 2025-02-01 Relisted — CANOPYMLS as Distributed by MLS Grid
- 2025-01-01 Listed $275,000 CANOPYMLS as Distributed by MLS Grid
- 2024-12-12 Coming Soon — CANOPYMLS as Distributed by MLS Grid
- 2022-07-18 Sold (Public Records) $167,500 Public Records
- 2022-07-18 Sold (Public Records) $167,500 Public Records
Property tax history
+13.7%/yrLatest (2025): $1,731 · +11.7% YoY. Source: county tax records.
Cash-flow waterfall
monthlySold comps — $/sqft
last 12 mo · ≤1 miLoading sold comps…