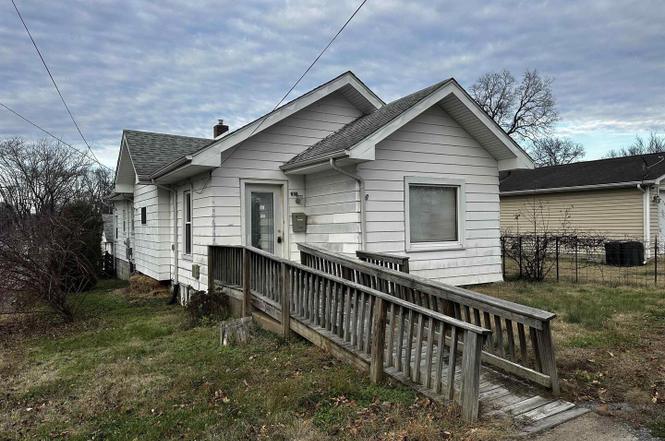
800 E Mckinley St · Marion, IL
Flood risk 6/10 · Moderate
- FEMA flood zone
- X (unshaded)
- Chance of flooding over 30 yrs
- 0.74%
- Est. flood insurance / yr
- $473 – $860
Fire risk 1/10 · Minimal
- Est. fire insurance / yr
- $804 – $1,492
Heat risk 5/10 · Moderate
- Hot days now (above 107°F)
- 7 days/yr
- Hot days in 30 yrs
- 20 days/yr
Wind risk 2/10 · Minimal
- Chance of severe wind over 30 yrs
- 3.0%
Air-quality risk 2/10 · Minimal
- Unhealthy air days now
- 1 days/yr
- Unhealthy air days in 30 yrs
- 3 days/yr
Risk factors via First Street. Map © Google.
Why this score? — see what drove the B- grade
The composite is a weighted blend of 9 inputs, each scored 0–100. Each bar is that input's sub-score; the figure is the points it added to the 100-point composite (weight × sub-score).
- Cash flow +30.0/30.0
- 1% rule +10.0/10.0
- DSCR +10.0/10.0
- ARV discount +7.5/15.0
- Rent growth +4.6/5.0
- Livability +3.1/5.0
- Condition / age +2.5/5.0
- Schools +2.2/10.0
- Appreciation +0.0/10.0
$44,900
🖨 Deal sheet 📄 Offer letter ✓ Due diligence
Listing remarks
2 bedroom 2 bath home on a corner lot with a 1 car attached garage
Key facts
- 5,000 sq ft lot
- Garage
- Built 1930
Neighborhood map
What this means for you Summary
Snapshot
- This is a 2-bed/2.0-bath other listed at $45k.
Deal economics
- At list price, monthly cash flow is $384 ($5k/yr) — positive.
- The deal already cash-flows at list — no discount required.
- Meets the 1% rule at list price ($994 rent vs $45k).
- Cap rate 16.6% vs local median 4.0% in Marion — top-decile yield for the area; either an underpriced asset or a hidden risk that comps aren't pricing in. Stress-test before assuming the spread holds.
Location & tenants
- Location reads 61/100 on livability (#896 in IL) — a middle-class / working-renter tenant base. Strengths: cost of living A+, housing A+; Watch: employment D, schools F, crime F.
- Marion CUSD 2 (urban): math 20% / reading 31% proficiency, ranked #317 of 620 in IL (top 51%) — low school quality limits family demand, transient renter base, plan for 1-2y turnover.
- Market conditions: Rents rising fast (+8.4%/yr); 226 active listings in the ZIP; 3 comparable units currently listed for rent nearby; rentals lingering (median 44d on market — plan ~5-8 weeks vacancy on turnover, expect pricing pressure); 100% of comp listings sitting > 30 days — soft ceiling on asking rent; 130 units permitted in Williamson County in 2024 (5 in 5+ unit buildings).
- This rent is only 17% of the median local income ($71k/yr) — well below the 30% rent-burden line; pricing power to push rent on renewal without tenant pushback.
Forward outlook
- Local home prices are declining (-3.0%/yr); year-one equity from $310 of loan paydown is wiped out by about $1k of value loss. Plan a longer hold.
- At projected returns (-3.0% appreciation + 8.0% rent growth), your $13k cash investment doubles in ~3 years — after that, you're playing with house money.
Negotiation context
- Only 0 days on market — expect competitive offers; lowballing is unlikely to land.
- 5 sale attempts since 22y ago with the ask held roughly flat each time — persistent listings suggest the price (not the market) is what's stuck; bring a comps-based counter.
Risks & watch-outs
- Watch-outs: property tax is 3.9% of price; built in 1930 — expect roof / HVAC / electrical / plumbing capex.
- Climate carrying-cost: major flood risk; extreme-heat days projected 7→20/yr by 2055 (HVAC capex compounding) — expect insurance premiums to compound above CPI over the hold.
Questions for the listing agent
- Built in 1930 — when were the roof, HVAC, electrical panel, plumbing, and water heater last replaced?
- Property tax is high relative to price — has the assessment been appealed recently, and will the sale trigger a re-assessment?
- Is there a deadline driving the sale (1031 exchange, divorce, estate, relocation)? That informs how much negotiation room exists.
- Schools are F-rated, which usually means shorter tenancies and higher turnover. Who's the typical renter profile here, and what's been the actual vacancy rate?
- Crime grade is F in this area — have there been break-ins, vandalism, or insurance claims at this property in the last 3 years? What carrier currently insures it and at what premium?
- What's the average days-on-market for RENTAL listings here right now (not sales)? A rising rental-DOM trend means longer vacancies and softer asking-rent achievability than the comps imply.
- What's the recent tenant-quality profile in this submarket — average credit score on applications, eviction rate, late-payment / NSF rate, and stable-employment percentage? A property-management company in the area should have these aggregated.
- How much new for-sale + rental construction is in the pipeline within 1–3 miles? Heavy new supply typically softens prices + rents 12–24 months out; constrained supply supports both.
Investment metrics
- 1% rule
- 2.21% ✓
- Cap rate
- 16.57%
- Cash-on-cash
- 36.70%
- DSCR
- 2.63
- GRM
- 3.8
CMA / ARV
No comps found within radius.
Projected returns pro-forma
-3.0% appreciation · 8.0% rent growth · sell at horizon
- IRR
- 38.9%
- Equity multiple
- 2.79×
- Total profit
- $22,536
- Equity at exit
- $6,695
- IRR
- 48.0%
- Equity multiple
- 6.99×
- Total profit
- $75,354
- Equity at exit
- $3,882
Cash invested: $12,572 (down + closing). Projections, not guarantees.
Landlord ↔ Tenant lean methodology
- Overall (STATE)
- 43 Moderately Tenant-Leaning
- State Illinois
- 43 Moderately Tenant-Leaning · D+7
- County
- — inherits STATE
- City
- — inherits STATE
ZIP-level market 62959
- Rents YoY
- 8.4%
- Active inventory
- 226
- Price-to-rent
- 3.8×
Monthly cashflow live
- Estimated rent
- $994 medium interval (Pro) →
- Mortgage (P&I)
- −$235
- Tax from tax record
- −$147 /mo · $1,761/yr
- Insurance
- −$19
- HOA
- −$0
- Vacancy / Maint / Mgmt
- −$209
- Net cashflow
- $384
Break-even live
UW: 25.0% down · 7.5% · 30yr · 1.5% tax · 5.0% vac · 8.0% maint · 8.0% mgmt
Financing live
Cash to close
- Down payment
- $11,225
- Closing costs
- $1,347
- Reserves months
- —
- Total cash needed
- —
Loan-product check · same deal, 3 products live
Conventional
25% down · 7.5% · 30yr
- Down + closing
- —
- Monthly P&I
- —
- Monthly cashflow
- —
- DSCR
- —
- Eligible?
- —
Personal DTI + credit; lowest rate.
DSCR
20% down · 8.5% · 30yr
- Down + closing
- —
- Monthly P&I
- —
- Monthly cashflow
- —
- DSCR
- —
- Eligible?
- —
No personal income docs; deal must DSCR.
Hard money
10% down · 12.0% · 12mo
- Down + closing
- —
- Monthly P&I
- —
- Monthly cashflow
- —
- DSCR
- —
- Eligible?
- —
Short-term bridge; refi at stabilization.
Rent comps 3 comps
| Address | Beds | Baths | Sqft | Rent | $/sqft | DOM | Units | Dist |
|---|---|---|---|---|---|---|---|---|
| 1700 E Boyton St Apt C Marion, IL | 2.0 | 2.0 | 1100 | $975 | $0.89 | 43d | 1 | 0.99mi |
| 908 N Bentley St Unit 908-F Marion, IL | 2.0 | 1.0 | 850 | $850 | $1.00 | 43d | 1 | 1.11mi |
| 1501 W Central St Marion, IL | 2.0 | 2.0 | 1175 | $1,175 | $1.00 | 43d | 1 | 1.27mi |
Listing history 23 events
-
2026-05-24status Pending
-
2026-05-24status Pending
-
2026-05-22status Pending
-
2026-01-16soldstatus $44,000 Closed
-
2026-01-16soldstatus $44,000 Closed
-
2026-01-16soldstatus $44,000 Closed
-
2026-01-16soldstatus $44,000 Closed
-
2025-12-13status Pending
-
2025-12-13historical
-
2025-12-13historical
-
2025-11-29$44,900
-
2025-11-29Active
-
2021-08-06historical
-
2018-10-10soldstatus $30,000
-
2009-04-14soldstatus $25,200
-
2009-04-14soldstatus $25,200
-
2009-02-18$29,900
-
2009-02-18$29,900
-
2006-09-08soldstatus $45,000
-
2006-07-31historical
-
2005-01-11soldstatus $27,500
-
2004-12-30soldstatus $27,500
-
2004-09-28$37,500
ⓘ Source: listings_history table (triggers on properties + properties_extension) + one-shot
backfill from property_details.listing_events for pre-trigger history.
Tax reassessment forecast IL · Partial reset (capped growth)
- Current annual tax
- $1,761 · $147/mo
- Projected year-2 tax
- $1,761 · $147/mo
- Expected delta
- $0/yr ($0/mo · 0.0%)
ⓘ Screening estimate from a state-policy table — verify with the county assessor before closing.
Climate risk First Street
- Flood 6/10 Major FEMA zone X (unshaded) · 74% chance over 30 yrs
- Wildfire 1/10 Low
- Heat 5/10 Major 7 d/yr ≥107°F today · 20 d/yr by 30 yrs out
- Wind 2/10 Low 3% chance of damaging wind over 30 yrs
- Air quality 2/10 Low 1 unhealthy d/yr today · 3 by 30 yrs out
Nearby sold comps map
Loading sold comps map…
Walkable amenities ~0.75 mi
Loading nearby amenities…
Taxation est. · year 1
- Rental income
- $11,929
- − Mortgage interest
- −$2,515
- − Property taxes
- −$1,761
- − Insurance
- −$224
- − Repairs & maintenance
- −$954
- − Management
- −$954
- − Depreciation
- −$1,306
- Taxable income
- $4,214
- Est. tax owed @ 24.0%
- −$1,011
- After-tax cash flow
- $3,602/yr
For passive investors: Depreciation is non-cash, so a rental often shows a tax loss while cash-flowing — sheltering income. Rental losses are passive: they offset passive income freely, and up to $25,000/yr can offset ordinary (W-2) income if you actively participate and your MAGI is under $100k (phasing out to $0 by $150k); unused losses carry forward. On sale, claimed depreciation is recaptured at up to 25%, and gains may owe capital-gains tax (a 1031 exchange can defer both). Figures are a year-1 estimate at your 24.0% rate — not tax advice; consult a CPA.
Schools (NCES district)
- District
- Marion CUSD 2
- NCES district ID
- 1724600
- Math proficiency
- 20% ▼ -11.00%
- Reading proficiency
- 31% ▼ -11.00%
- Median HH income
- $46,221
- Composite
- 22.07/100
- National rank
- #8189
- State rank
- #317 of 620 in IL
Livability — Marion
- Score
- 61/100
- State rank
- #896
- US rank
- #17434
Category grades
Schools grade is shown separately in the Schools card above.
Census & demographics
- Census place
- Marion, IL
- County
- Williamson County · 38,451 people
- City population
- 27,793
- Metro
- Carbondale-Marion, IL
- Population (ZIP)
- 27,793
- Household income
- $71,063
- Rent vs Own
- Severe rent burden
- 763.0
Population outlook (Williamson County) Hauer SSP2
- Today (2025)
- 69,553 people
- By 2030
- 70,090 · +0.8%
- By 2040
- 70,345 · +1.1%
- By 2050
- 69,394 · -0.2%
- By 2075
- 63,590 · -8.6%
- By 2100
- 51,154 · -26.5%
Race, ethnicity, and origin ACS 2023
- Neighborhood character
- Predominantly White (87%)
- Race & ethnicity
- White 87% Black 5% Two or more races 4% Hispanic / Latino 3% Asian 2%
- Common ancestry
- Lithuanian 2% Italian 2% Slovak 1%
- Foreign-born
- 2% · Canada
- Languages at home
- 97% English-only · Spanish 1% Other Asian/Pacific 1% Other Indo-European 1%
Political lean MEDSL · Williamson
- 2024 margin
- Solid R (+38.8) · D 30.0% · R 68.8% · Other 1.3%
- 2008→2024 swing
- -24.0pp toward R · 2008: -14.8pp · 2024: -38.8pp
- All cycles
- 2024: R+38.8 2020: R+37.3 2016: R+41.2 2012: R+25.0 2008: R+14.8
Not yet ingested
- Civics
- —
Market trends
- HPI YoY
- ▼ -76.41%
- Current HPI
- 137.5955
- Rent YoY
- ▲ 8.40%
- Metro
- Carbondale-Marion, IL
- State GDP YoY
- ▲ 1.59%
- F500 in state
- 60
Industry mix (Fortune 500 HQ in IL)
| Industry | F500 HQs | Revenue |
|---|---|---|
| Insurance | 4 | $201B |
|
||
| Consumer Goods | 4 | $87B |
|
||
| Industrial Machinery | 3 | $64B |
|
||
| Healthcare | 2 | $55B |
|
||
| Retail / Pharmacy | 1 | $148B |
|
||
| Agriculture / Food | 1 | $86B |
|
||
Price history
+17.3% since first listed23 events — show timeline
- 2026-05-24 Pending — MRED as Distributed by MLS Grid
- 2026-05-24 Pending — MRED as Distributed by MLS Grid
- 2026-05-22 Pending — MRED as Distributed by MLS Grid
- 2026-01-16 Sold (MLS) $44,000 MRED as Distributed by MLS Grid
- 2026-01-16 Sold (MLS) $44,000 MRED as Distributed by MLS Grid
- 2026-01-16 Sold (MLS) $44,000 MRED as Distributed by MLS Grid
- 2026-01-16 Sold (MLS) $44,000 MRED as Distributed by MLS Grid
- 2025-12-13 Pending — RMLSA as Distributed by MLS Grid
- 2025-12-13 Listing Removed — RMLSA as Distributed by MLS Grid
- 2025-12-13 Listing Removed — MRED as Distributed by MLS Grid
- 2025-11-29 Listed — RMLSA as Distributed by MLS Grid
- 2025-11-29 Listed $44,900 MRED as Distributed by MLS Grid
- 2021-08-06 Listing Removed — RMLSA as Distributed by MLS Grid
- 2018-10-10 Sold (Public Records) $30,000 Public Records
- 2009-04-14 Sold (MLS) $25,200 RMLSA as Distributed by MLS Grid
- 2009-04-14 Sold (MLS) $25,200 MRED as Distributed by MLS Grid
- 2009-02-18 Listed $29,900 RMLSA as Distributed by MLS Grid
- 2009-02-18 Listed $29,900 MRED as Distributed by MLS Grid
- 2006-09-08 Sold (Public Records) $45,000 Public Records
- 2006-07-31 Listing Removed — MRED as Distributed by MLS Grid
- 2005-01-11 Sold (Public Records) $27,500 Public Records
- 2004-12-30 Sold (MLS) $27,500 RMLSA as Distributed by MLS Grid
- 2004-09-28 Listed $37,500 RMLSA as Distributed by MLS Grid
Property tax history
+2.9%/yrLatest (2025): $1,761 · -0.2% YoY. Source: county tax records.
Cash-flow waterfall
monthlySold comps — $/sqft
last 12 mo · ≤1 miLoading sold comps…