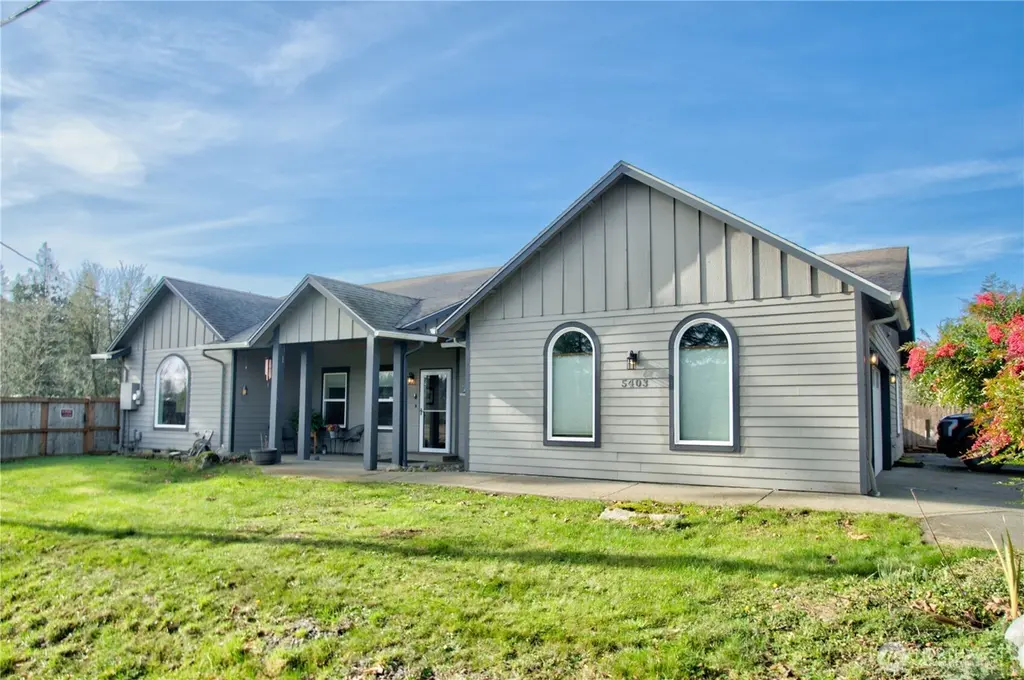
5403 Lemon Rd NE · Olympia, WA
Flood risk 1/10 · Minimal
- FEMA flood zone
- X (unshaded)
- Chance of flooding over 30 yrs
- 0.0%
- Est. flood insurance / yr
- $507 – $1,088
Fire risk 3/10 · Minor
- Est. fire insurance / yr
- $604 – $1,122
Heat risk 3/10 · Minor
- Hot days now (above 89°F)
- 7 days/yr
- Hot days in 30 yrs
- 14 days/yr
Wind risk 1/10 · Minimal
- Chance of severe wind over 30 yrs
- —
Air-quality risk 6/10 · Moderate
- Unhealthy air days now
- 6 days/yr
- Unhealthy air days in 30 yrs
- 7 days/yr
Risk factors via First Street. Map © Google.
Why this score? — see what drove the D- grade
The composite is a weighted blend of 9 inputs, each scored 0–100. Each bar is that input's sub-score; the figure is the points it added to the 100-point composite (weight × sub-score).
- ARV discount +15.0/15.0
- Cash flow +7.1/30.0
- Schools +5.1/10.0
- Livability +4.2/5.0
- Rent growth +3.4/5.0
- Condition / age +2.5/5.0
- DSCR +1.3/10.0
- 1% rule +0.6/10.0
- Appreciation +0.0/10.0
$595,000
🖨 Deal sheet (PDF) 📄 Offer letter ✓ Due diligence
Listing remarks
Welcome to this beautifully maintained Contemporary Ranch with Modern Craftsman influences, offering 2,314 sq ft of bright and airy living space on a . 36-acre lot with no HOA. Built in 2006, this 3 bed, 2 bath home blends timeless style with everyday comfort. Large windows and sliding glass doors allow natural light to pour throughout the home, highlighting the real hardwood floors, elegant crown molding, tray ceilings, and premium carpeting. The thoughtfully arranged kitchen features granite countertops, stainless appliances, abundant cabinetry, and a raised breakfast bar that’s perfect for entertaining. Retreat to the oversized primary suite featuring serene backyard views and a lu
Key facts
- Raised breakfast bar
- Soaking tub
- Stainless appliances
Tags
Neighborhood map
What this means for you Summary
Snapshot
- This is a 3-bed/2.0-bath single-family listed at $595k.
Deal economics
- At list price, monthly cash flow is $-837 ($-10k/yr) — negative.
- To cash-flow at today's rent, offer at most $447k (24.9% below list).
- To meet the 1% rule (rent ≥ 1% of price), the offer needs to be $333k (44.0% below list).
- Recommended offer: $333k (44.0% below list) — sets the bar for 1% rule.
- Cap rate 4.6% vs local median 2.4% in Olympia — top-decile yield for the area; either an underpriced asset or a hidden risk that comps aren't pricing in. Stress-test before assuming the spread holds.
Location & tenants
- Location reads 83/100 on livability (#58 in WA, #1,036 nationally) — a professional / high-income tenant draw. Strengths: amenities A+, commute A+, health & safety A+; Watch: crime F, cost of living D-.
- North Thurston Public Schools (suburban): math 51% / reading 62% proficiency, ranked #80 of 291 in WA (top 28%) — acceptable for families but not a draw, mixed tenant base, ~2y average lease.
- Market conditions: Rents rising (+3.7%/yr); 150 active listings in the ZIP; 3 comparable units currently listed for rent nearby; rentals at typical pace (median 15d on market — plan ~3-4 weeks tenant-placement turnaround); solid renter incomes; 1,222 units permitted in Thurston County in 2024 (508 in 5+ unit buildings).
- This rent runs 44% of the median local income ($92k/yr) — at the standard rent-burdened threshold; future hikes will face affordability resistance.
Forward outlook
- Local home prices are declining (-3.0%/yr); year-one equity from $4k of loan paydown is wiped out by about $18k of value loss. Plan a longer hold.
- Thurston County population projected at +27% by 2050 — long-run rental-demand tailwind backs the buy-and-hold thesis.
Negotiation context
- It's been on market 90 days — a 6% lower offer ($559k) is reasonable based on typical stale-listing flexibility.
- 6 sale attempts since 18y ago; this cycle's ask has dropped $34k (5%) from the opening price — seller is motivated, your offer sets the floor, not the list.
- Current owner paid $295k; list at $595k implies a 102% gain — meaningful room to come down on a strong offer.
Questions for the listing agent
- What do current leases actually rent for vs. the listed asking? Can we see a recent rent roll and the last 12 months of T-12 income?
- It's been on market 90 days. Have you received any prior offers? Is the seller open to a 44% concession, seller financing, or rate buy-down credit?
- Why hasn't it sold? Are there any deal-killer items the seller is aware of (foundation, flood, title, zoning, code violations)?
- Is there a deadline driving the sale (1031 exchange, divorce, estate, relocation)? That informs how much negotiation room exists.
- Schools are A-rated — typically a magnet for longer-tenancy family renters. What's the average tenant stay here, and is there a school-zone premium baked into asking?
- Crime grade is F in this area — have there been break-ins, vandalism, or insurance claims at this property in the last 3 years? What carrier currently insures it and at what premium?
- The area grade is low — what's the realistic commute time and amenity access for the typical tenant pool here? Any planned neighborhood developments (good or bad) we should know about?
- What's the average days-on-market for RENTAL listings here right now (not sales)? A rising rental-DOM trend means longer vacancies and softer asking-rent achievability than the comps imply.
- What's the recent tenant-quality profile in this submarket — average credit score on applications, eviction rate, late-payment / NSF rate, and stable-employment percentage? A property-management company in the area should have these aggregated.
- How much new for-sale + rental construction is in the pipeline within 1–3 miles? Heavy new supply typically softens prices + rents 12–24 months out; constrained supply supports both.
Investment metrics
- 1% rule
- 0.56% ✗
- Cap rate
- 4.60%
- Cash-on-cash
- -6.03%
- DSCR
- 0.73
- GRM
- 14.9
CMA / ARV
- ARV (median comp)
- $805,822
- List price
- $595,000
- Delta
- -26.16%
- Verdict
- UNDERPRICED
- Comps
- 8 within 1.0 mi
Show comp detail 2 sales within ~0.75 mi
| Address | Dist | Beds/Ba | Sqft | Sold | Price | $/sf | Match |
|---|---|---|---|---|---|---|---|
| 5549 Meadowood Ln NE | 0.64mi | 3/2.0 | 2,454 (+6%) | 14mo | $910,000 | $371 | 48 |
| 4924 Lemon Rd NE | 0.45mi | 3/2.0 | 1,988 (-14%) | 14mo | $700,000 | $352 | 44 |
Match score weights: distance 35% · size 25% · config 20% · recency 20%. Top-matched comps best support the ARV.
Projected returns pro-forma
-3.0% appreciation · 3.66% rent growth · sell at horizon
- IRR
- -26.2%
- Equity multiple
- 0.11×
- Total profit
- $-147,852
- Equity at exit
- $88,716
- IRR
- -21.7%
- Equity multiple
- -0.14×
- Total profit
- $-189,539
- Equity at exit
- $51,445
Cash invested: $166,600 (down + closing). Projections, not guarantees.
Landlord ↔ Tenant lean methodology
- Overall (STATE)
- 28 Tenant-Leaning
- State Washington
- 28 Tenant-Leaning · D+8
- County
- — inherits STATE
- City
- — inherits STATE
ZIP-level market 98506
- Rents YoY
- 3.7%
- Active inventory
- 150
- Price-to-rent
- 14.9×
Monthly cashflow live
- Estimated rent
- $3,333 medium interval (Pro) →
- Mortgage (P&I)
- −$3,120
- Tax from tax record
- −$102 /mo · $1,222/yr
- Insurance
- −$248
- HOA
- −$0
- Vacancy / Maint / Mgmt
- −$700
- Net cashflow
- $-837
Break-even live
Sensitivity live
| Price | -10% $-500 | -5% $-669 | +0% $-837 | +5% $-1,685 | +10% $-1,890 |
|---|---|---|---|---|---|
| Rent | -10% $-1,100 | -5% $-969 | +0% $-837 | +5% $-706 | +10% $-574 |
| Rate | -1.0pp $-538 | -0.5pp $-686 | base $-837 | +0.5pp $-991 | +1.0pp $-1,148 |
UW: 25.0% down · 7.5% · 30yr · 1.5% tax · 5.0% vac · 8.0% maint · 8.0% mgmt
Financing live
Cash to close
- Down payment
- $148,750
- Closing costs
- $17,850
- Reserves months
- —
- Total cash needed
- —
Loan-product check · same deal, 3 products live
Conventional
25% down · 7.5% · 30yr
- Down + closing
- —
- Monthly P&I
- —
- Monthly cashflow
- —
- DSCR
- —
- Eligible?
- —
Personal DTI + credit; lowest rate.
DSCR
20% down · 8.5% · 30yr
- Down + closing
- —
- Monthly P&I
- —
- Monthly cashflow
- —
- DSCR
- —
- Eligible?
- —
No personal income docs; deal must DSCR.
Hard money
10% down · 12.0% · 12mo
- Down + closing
- —
- Monthly P&I
- —
- Monthly cashflow
- —
- DSCR
- —
- Eligible?
- —
Short-term bridge; refi at stabilization.
Rent comps 3 comps
| Address | Beds | Baths | Sqft | Rent | $/sqft | DOM | Units | Dist |
|---|---|---|---|---|---|---|---|---|
| 4937 Sleater Kinney Rd NE Olympia, WA | 4.0 | 4.0 | 2900 | $3,995 | $1.38 | 14d | 1 | 1.02mi |
| 4937 Sleater Kinney Rd NE Olympia, WA | 4.0 | 4.0 | 2900 | $3,995 | $1.38 | 44d | 1 | 1.02mi |
| 5110 Boston Harbor Rd NE Olympia, WA | 3.0 | 2.0 | 1828 | $3,395 | $1.86 | 14d | 1 | 1.27mi |
Listing history 26 events
-
2026-05-13status Pending
-
2026-05-11price $595,000
-
2026-04-17price $600,000
-
2026-04-02price $619,000
-
2026-03-09price $624,000
-
2026-02-12$629,000 Active
-
2016-11-23soldstatus $295,000 Sold
-
2016-11-16soldstatus $295,000
-
2016-10-24status Pending
-
2016-10-14status Pending Inspection
-
2016-10-04$299,900 Active
-
2015-02-11soldstatus $240,000 Sold
-
2015-01-02status Pending Inspection
-
2014-12-03price $259,500
-
2014-10-29$272,900 Active
-
2009-06-04soldstatus $315,000 Sold
-
2009-06-04soldstatus $315,000
-
2009-04-29historical
-
2009-04-24status
-
2009-04-23historical
-
2009-01-31status
-
2009-01-30historical
-
2009-01-07price $325,000
-
2009-01-06price $299,900
-
2008-12-22$335,000
-
2006-10-19soldstatus $119,310
ⓘ Source: listings_history table (triggers on properties + properties_extension) + one-shot
backfill from property_details.listing_events for pre-trigger history.
Tax reassessment forecast WA · Resets to sale price
- Current annual tax
- $1,222 · $102/mo
- Projected year-2 tax
- $5,831 · $486/mo
- Expected delta
- +$4,609/yr (+$384/mo · 377.3%)
ⓘ Screening estimate from a state-policy table — verify with the county assessor before closing.
Climate risk First Street
- Flood 1/10 Low FEMA zone X (unshaded) · 0% chance over 30 yrs
- Wildfire 3/10 Moderate
- Heat 3/10 Moderate 7 d/yr ≥89°F today · 14 d/yr by 30 yrs out
- Wind 1/10 Low
- Air quality 6/10 Major 6 unhealthy d/yr today · 7 by 30 yrs out
Nearby sold comps map
Loading sold comps map…
Walkable amenities ~0.75 mi
Loading nearby amenities…
Taxation est. · year 1
- Rental income
- $39,992
- − Mortgage interest
- −$33,329
- − Property taxes
- −$1,222
- − Insurance
- −$2,975
- − Repairs & maintenance
- −$3,199
- − Management
- −$3,199
- − Depreciation
- −$17,309
- Taxable loss
- −$21,242
- Est. tax savings @ 24.0%
- +$5,098
- After-tax cash flow
- $-4,948/yr
For passive investors: Depreciation is non-cash, so a rental often shows a tax loss while cash-flowing — sheltering income. Rental losses are passive: they offset passive income freely, and up to $25,000/yr can offset ordinary (W-2) income if you actively participate and your MAGI is under $100k (phasing out to $0 by $150k); unused losses carry forward. On sale, claimed depreciation is recaptured at up to 25%, and gains may owe capital-gains tax (a 1031 exchange can defer both). Figures are a year-1 estimate at your 24.0% rate — not tax advice; consult a CPA.
Schools (NCES district)
- District
- North Thurston Public Schools
- NCES district ID
- 5305850
- Math proficiency
- 51% ▬ 0.00%
- Reading proficiency
- 62% ▬ 0.00%
- Median HH income
- $62,338
- Composite
- 51.09/100
- National rank
- #3798
- State rank
- #80 of 291 in WA
Livability — Olympia
- Score
- 83/100
- State rank
- #58
- US rank
- #1036
Category grades
Schools grade is shown separately in the Schools card above.
Census & demographics
- County
- Thurston County · 269,345 people
- City population
- 98,428
- Metro
- Olympia-Lacey-Tumwater, WA
- Population (ZIP)
- 18,497
- Household income
- $91,596
- Rent vs Own
- Severe rent burden
- 924.0
Population outlook (Thurston County) Hauer SSP2
- Today (2025)
- 308,239 people
- By 2030
- 326,483 · +5.9%
- By 2040
- 359,890 · +16.8%
- By 2050
- 391,800 · +27.1%
- By 2075
- 468,024 · +51.8%
- By 2100
- 519,890 · +68.7%
Race, ethnicity, and origin ACS 2023
- Neighborhood character
- Predominantly White (81%)
- Race & ethnicity
- White 81% Two or more races 9% Hispanic / Latino 5% Asian 5% Black 1%
- Hispanic origin (detail)
- Mexican 3%
- Common ancestry
- Portuguese 5% Italian 4% Romanian 4%
- Foreign-born
- 8% · Canada, Vietnam, China
- Languages at home
- 89% English-only · Spanish 2% German/W. Germanic 1% Vietnamese 1%
Political lean MEDSL · Thurston
- 2024 margin
- Strong D (+20.4) · D 58.5% · R 38.1% · Other 3.5%
- 2008→2024 swing
- -1.3pp toward R · 2008: 21.7pp · 2024: 20.4pp
- All cycles
- 2024: D+20.4 2020: D+18.6 2016: D+15.4 2012: D+19.0 2008: D+21.7
Not yet ingested
- Civics
- —
Market trends
- HPI YoY
- ▼ -437.08%
- Current HPI
- 363.2295
- Rent YoY
- ▲ 3.66%
- Metro
- Olympia-Lacey-Tumwater, WA
- State GDP YoY
- ▲ 4.65%
- F500 in state
- 22
Industry mix (Fortune 500 HQ in WA)
| Industry | F500 HQs | Revenue |
|---|---|---|
| Retail | 2 | $269B |
|
||
| Technology / Retail | 1 | $638B |
|
||
| Technology | 1 | $245B |
|
||
| Telecommunications | 1 | $38B |
|
||
| Food / Beverage | 1 | $36B |
|
||
| Automotive / Trucks | 1 | $34B |
|
||
Price history
+398.7% since first listed26 events — show timeline
- 2026-05-13 Pending — NWMLS as Distributed by MLS Grid
- 2026-05-11 Price Changed $595,000 NWMLS as Distributed by MLS Grid
- 2026-04-17 Price Changed $600,000 NWMLS as Distributed by MLS Grid
- 2026-04-02 Price Changed $619,000 NWMLS as Distributed by MLS Grid
- 2026-03-09 Price Changed $624,000 NWMLS as Distributed by MLS Grid
- 2026-02-12 Listed $629,000 NWMLS as Distributed by MLS Grid
- 2016-11-23 Sold (MLS) $295,000 NWMLS as Distributed by MLS Grid
- 2016-11-16 Sold (Public Records) $295,000 Public Records
- 2016-10-24 Pending — NWMLS as Distributed by MLS Grid
- 2016-10-14 Pending — NWMLS as Distributed by MLS Grid
- 2016-10-04 Listed $299,900 NWMLS as Distributed by MLS Grid
- 2015-02-11 Sold (MLS) $240,000 NWMLS as Distributed by MLS Grid
- 2015-01-02 Pending — NWMLS as Distributed by MLS Grid
- 2014-12-03 Price Changed $259,500 NWMLS as Distributed by MLS Grid
- 2014-10-29 Listed $272,900 NWMLS as Distributed by MLS Grid
- 2009-06-04 Sold (Public Records) $315,000 Public Records
- 2009-06-04 Sold (MLS) $315,000 NWMLS as Distributed by MLS Grid
- 2009-04-29 Delisted — NWMLS as Distributed by MLS Grid
- 2009-04-24 Relisted — NWMLS as Distributed by MLS Grid
- 2009-04-23 Delisted — NWMLS as Distributed by MLS Grid
- 2009-01-31 Relisted — NWMLS as Distributed by MLS Grid
- 2009-01-30 Delisted — NWMLS as Distributed by MLS Grid
- 2009-01-07 Price Changed $325,000 NWMLS as Distributed by MLS Grid
- 2009-01-06 Price Changed $299,900 NWMLS as Distributed by MLS Grid
- 2008-12-22 Listed $335,000 NWMLS as Distributed by MLS Grid
- 2006-10-19 Sold (Public Records) $119,310 Public Records
Property tax history
-6.5%/yrLatest (2026): $1,222 · -2.2% YoY. Source: county tax records.
Cash-flow waterfall
monthlySold comps — $/sqft
last 12 mo · ≤1 miLoading sold comps…