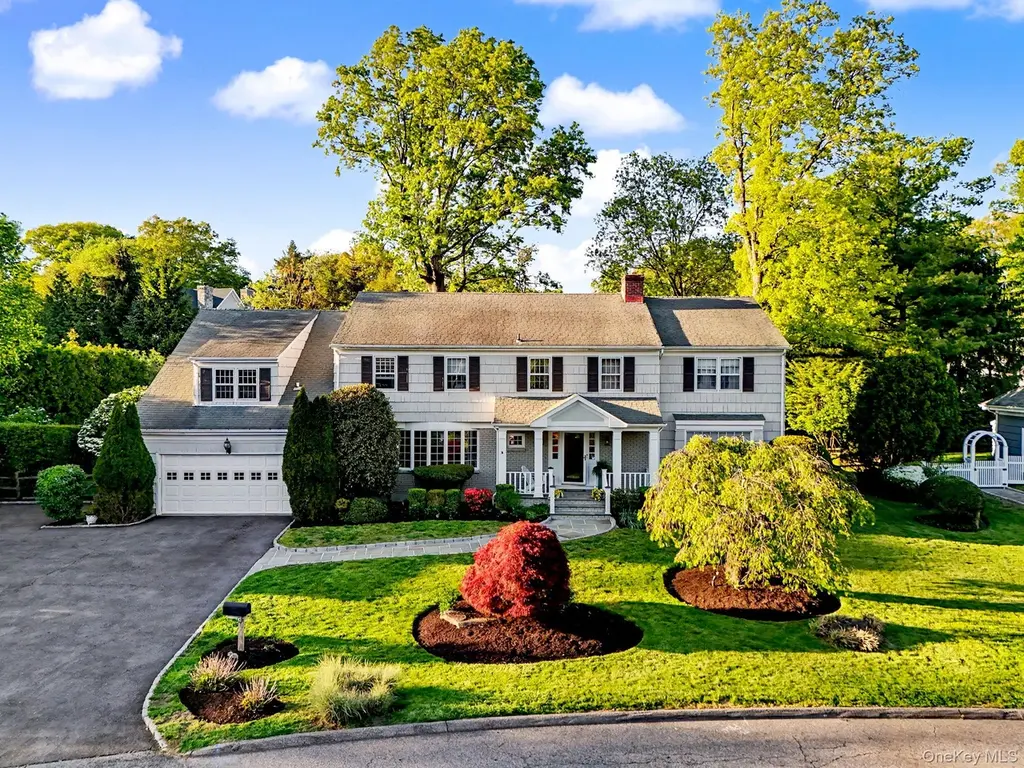
4 Clark Ln · Rye, NY
Flood risk 1/10 · Minimal
- FEMA flood zone
- X (unshaded)
- Chance of flooding over 30 yrs
- 0.0%
- Est. flood insurance / yr
- $507 – $1,088
Fire risk 1/10 · Minimal
- Est. fire insurance / yr
- $691 – $1,283
Heat risk 6/10 · Moderate
- Hot days now (above 98°F)
- 7 days/yr
- Hot days in 30 yrs
- 16 days/yr
Wind risk 6/10 · Moderate
- Chance of severe wind over 30 yrs
- 27.0%
Air-quality risk 4/10 · Minor
- Unhealthy air days now
- 5 days/yr
- Unhealthy air days in 30 yrs
- 7 days/yr
Risk factors via First Street. Map © Google.
Why this score? — see what drove the D grade
The composite is a weighted blend of 9 inputs, each scored 0–100. Each bar is that input's sub-score; the figure is the points it added to the 100-point composite (weight × sub-score).
- ARV discount +15.0/15.0
- Schools +8.6/10.0
- Appreciation +8.3/10.0
- Livability +3.5/5.0
- Rent growth +2.5/5.0
- Condition / age +2.5/5.0
- Cash flow +0.0/30.0
- 1% rule +0.0/10.0
- DSCR +0.0/10.0
$3,360,000
🖨 Deal sheet 📄 Offer letter ✓ Due diligence
Listing remarks
Welcome to 4 Clark Lane - a rare opportunity to own a home in one of Rye’s most sought-after neighborhoods, perfectly situated on a coveted cul-de-sac off Forest Avenue. Set on . 36 acres in the heart of Rye, this 5-bedroom, 3.5-bath Colonial home offers expansive open living spaces and a prime location. Enjoy cul-de-sac living just moments from town, schools, parks, beaches, and the train. Perfect for both everyday living and entertaining, the home offers oversized rooms, a spacious layout, and an effortless flow throughout. The large kitchen opens seamlessly to the family room and breakfast area, with French doors leading out to the custom terrace with sitting walls and the generou
Key facts
- 0.36 acre lot
- 2 garage spots
- Built 1975
Property features AI
Exterior
- Parking: Driveway; 2-car garage; Garage present
- Utilities: Electricity connected (Con-Edison); Natural gas connected; Public sewer; Public water connected; Trash collection (public); Underground utilities
- Home design: Single family residence; Two stories
- Construction: Wood siding
- Exterior features: Level lot; Not waterfront
Interior
- Kitchen: Cooktop; Oven; Dishwasher; Refrigerator; Kitchen island; Granite counters
- Bedrooms: Two levels (total rooms: 10); Attic walk-up; Basement with crawl space, partial finish, and walk-out access
- Flooring: Hardwood
- Bathrooms: 3 full bathrooms; 1 half bathroom
- Heating & cooling: Forced air heating; Central air conditioning; Wood-burning fireplaces (2 total)
- Interior features: Built-in features; Entrance foyer; Formal dining room; Granite counters; Kitchen island; Open floor plan; Terrace
- Laundry & utility: Dryer; Gas water heater
Neighborhood map
What this means for you Summary
Snapshot
- This is a 5-bed/3.0-bath single-family listed at $3.36M.
Deal economics
- At list price, monthly cash flow is $-17k ($-206k/yr) — negative.
- To cash-flow at today's rent, offer at most $864k (74.3% below list).
- To meet the 1% rule (rent ≥ 1% of price), the offer needs to be $756k (77.5% below list).
- Recommended offer: $756k (77.5% below list) — sets the bar for 1% rule.
- Cap rate 0.2% vs local median 1.5% in Rye — below-typical yield; the buyer is paying a premium for something (appreciation thesis, condition, location) that the cap rate doesn't capture.
Location & tenants
- Location reads 70/100 on livability (#431 in NY) — a middle-class / working-renter tenant base. Strengths: crime A+, employment A+; Watch: amenities F, cost of living F, health & safety F.
- Rye City School District (suburban): math 89% / reading 93% proficiency, ranked #4 of 590 in NY (top 1%) — strong family-tenant draw, lease renewals of 3-5y typical; only 2% free/reduced lunch — higher-income household profile.
- Zoned schools: Midland School (math 82% / reading 98%, grade A+, #37 of 2,108 statewide, top 2%, 460 students, 0% FRL); Rye Middle School (math 77% / reading 92%, grade A+, #13 of 729 statewide, top 2%, 685 students, 0% FRL); Rye High School (math 100% / reading 87%, grade A+, #141 of 1,100 statewide, top 13%, 903 students, 0% FRL) — zoned schools at 0% FRL track the district average.
- Market conditions: 121 active listings in the ZIP; 1 comparable units currently listed for rent nearby; high-income renter base; 954 units permitted in Westchester County in 2024 (649 in 5+ unit buildings).
- This rent runs 36% of the median local income ($250k/yr) — at the standard rent-burdened threshold; future hikes will face affordability resistance.
Forward outlook
- In year one you build about $246k of equity ($23k loan paydown + $223k appreciation (6.6% local appreciation)).
- Westchester County population projected at +10% by 2050 — modest demand growth; plan on rents tracking national, not racing it.
- By year 2, paydown + projected appreciation supports a ~$394k cash-out refi (75% LTV) — recoverable capital for the next deal without selling this one.
Negotiation context
- Only 9 days on market — expect competitive offers; lowballing is unlikely to land.
- Current owner paid $1.20M; list at $3.36M implies a 180% gain — meaningful room to come down on a strong offer.
Risks & watch-outs
- Climate carrying-cost: major wind risk, 27% chance of damaging wind over 30y; extreme-heat days projected 7→16/yr by 2055 (HVAC capex compounding) — expect insurance premiums to compound above CPI over the hold.
Questions for the listing agent
- What do current leases actually rent for vs. the listed asking? Can we see a recent rent roll and the last 12 months of T-12 income?
- Built in 1975 — when were the roof, HVAC, electrical panel, plumbing, and water heater last replaced?
- Is there a deadline driving the sale (1031 exchange, divorce, estate, relocation)? That informs how much negotiation room exists.
- Schools are A-rated — typically a magnet for longer-tenancy family renters. What's the average tenant stay here, and is there a school-zone premium baked into asking?
- The area grade is low — what's the realistic commute time and amenity access for the typical tenant pool here? Any planned neighborhood developments (good or bad) we should know about?
- What's the average days-on-market for RENTAL listings here right now (not sales)? A rising rental-DOM trend means longer vacancies and softer asking-rent achievability than the comps imply.
- What's the recent tenant-quality profile in this submarket — average credit score on applications, eviction rate, late-payment / NSF rate, and stable-employment percentage? A property-management company in the area should have these aggregated.
- How much new for-sale + rental construction is in the pipeline within 1–3 miles? Heavy new supply typically softens prices + rents 12–24 months out; constrained supply supports both.
Investment metrics
- 1% rule
- 0.22% ✗
- Cap rate
- 0.17%
- Cash-on-cash
- -21.86%
- DSCR
- 0.03
- GRM
- 37.1
CMA / ARV
- ARV (median comp)
- $4,098,481
- List price
- $3,360,000
- Delta
- -18.02%
- Verdict
- UNDERPRICED
- Comps
- 20 within 1.0 mi
Show comp detail 12 sales within ~0.75 mi
| Address | Dist | Beds/Ba | Sqft | Sold | Price | $/sf | Match |
|---|---|---|---|---|---|---|---|
| 2 Rockridge Rd | 0.22mi | 5/5.0 | 4,394 (+1%) | 15mo | $1,960,000 | $446 | 67 |
| 10 Stonycrest | 0.20mi | 5/4.5 | 4,081 (-6%) | 12mo | $3,605,000 | $883 | 64 |
| 17 Hook Rd | 0.25mi | 6/5.5 (+1) | 4,208 (-3%) | 13mo | $3,850,000 | $915 | 58 |
| 2 Lavender Ln | 0.72mi | 5/4.5 | 4,335 (-0%) | 8mo | $2,850,000 | $657 | 54 |
| 20 Manursing Ave | 0.51mi | 5/3.5 | 3,858 (-11%) | 12mo | $2,200,000 | $570 | 46 |
| 11 Billington Ct | 0.33mi | 6/4.5 (+1) | 4,973 (+15%) | 6mo | $4,450,000 | $895 | 44 |
| 54 Wetmore Pl | 0.45mi | 5/4.5 | 4,004 (-8%) | 21mo | $2,795,000 | $698 | 43 |
| 13 Fieldstone Rd | 0.19mi | 6/5.5 (+1) | 3,958 (-9%) | 24mo | $3,180,000 | $803 | 42 |
| 25A Howard Pl | 0.66mi | 5/4.5 | 4,441 (+2%) | 21mo | $3,295,000 | $742 | 41 |
| 26 Chestnut St | 0.73mi | 5/5.0 | 4,578 (+6%) | 12mo | $2,695,000 | $589 | 39 |
| 270 Milton Rd | 0.50mi | 4/4.5 (-1) | 4,828 (+11%) | 11mo | $3,900,000 | $808 | 38 |
| 78 Grapal St | 0.53mi | 6/5.5 (+1) | 3,770 (-13%) | 21mo | $2,825,000 | $749 | 21 |
Match score weights: distance 35% · size 25% · config 20% · recency 20%. Top-matched comps best support the ARV.
Projected returns pro-forma
6.64% appreciation · 3.0% rent growth · sell at horizon
- IRR
- 0.1%
- Equity multiple
- 1.01×
- Total profit
- $8,170
- Equity at exit
- $2,250,208
- IRR
- 4.0%
- Equity multiple
- 1.90×
- Total profit
- $849,778
- Equity at exit
- $4,205,390
Cash invested: $940,800 (down + closing). Projections, not guarantees.
Landlord ↔ Tenant lean methodology
- Overall (STATE)
- 15 Strongly Tenant-Friendly
- State New York
- 15 Strongly Tenant-Friendly · D+10
- County
- — inherits STATE
- City
- — inherits STATE
ZIP-level market 10580
- Home prices YoY
- 2.1%
- Active inventory
- 121
- Price-to-rent
- 37.1×
Monthly cashflow live
- Estimated rent
- $7,557 medium interval (Pro) →
- Mortgage (P&I)
- −$17,620
- Tax from tax record
- −$4,090 /mo · $49,079/yr
- Insurance
- −$1,400
- HOA
- −$0
- Vacancy / Maint / Mgmt
- −$1,587
- Net cashflow
- $-17,140
Break-even live
UW: 25.0% down · 7.5% · 30yr · 1.5% tax · 5.0% vac · 8.0% maint · 8.0% mgmt
Financing live
Cash to close
- Down payment
- $840,000
- Closing costs
- $100,800
- Reserves months
- —
- Total cash needed
- —
Loan-product check · same deal, 3 products live
Conventional
25% down · 7.5% · 30yr
- Down + closing
- —
- Monthly P&I
- —
- Monthly cashflow
- —
- DSCR
- —
- Eligible?
- —
Personal DTI + credit; lowest rate.
DSCR
20% down · 8.5% · 30yr
- Down + closing
- —
- Monthly P&I
- —
- Monthly cashflow
- —
- DSCR
- —
- Eligible?
- —
No personal income docs; deal must DSCR.
Hard money
10% down · 12.0% · 12mo
- Down + closing
- —
- Monthly P&I
- —
- Monthly cashflow
- —
- DSCR
- —
- Eligible?
- —
Short-term bridge; refi at stabilization.
Rent comps 1 comps
| Address | Beds | Baths | Sqft | Rent | $/sqft | DOM | Units | Dist |
|---|---|---|---|---|---|---|---|---|
| 6 Club Rd Rye, NY | 4.0 | 3.5 | 3502 | $18,000 | $5.14 | 43d | 1 | 1.12mi |
Listing history 5 events
-
2026-05-15$3,360,000 Active 1572-char remark
-
2026-05-14historical $3,360,000 1572-char remark
-
1997-08-26soldstatus $1,200,000
-
1991-06-28soldstatus $825,000
-
1989-08-18soldstatus $855,000
ⓘ Source: listings_history table (triggers on properties + properties_extension) + one-shot
backfill from property_details.listing_events for pre-trigger history.
Tax reassessment forecast NY · Partial reset (capped growth)
- Current annual tax
- $49,079 · $4,090/mo
- Projected year-2 tax
- $52,931 · $4,411/mo
- Expected delta
- +$3,853/yr (+$321/mo · 7.8%)
ⓘ Screening estimate from a state-policy table — verify with the county assessor before closing.
Climate risk First Street
- Flood 1/10 Low FEMA zone X (unshaded) · 0% chance over 30 yrs
- Wildfire 1/10 Low
- Heat 6/10 Major 7 d/yr ≥98°F today · 16 d/yr by 30 yrs out
- Wind 6/10 Major 27% chance of damaging wind over 30 yrs
- Air quality 4/10 Moderate 5 unhealthy d/yr today · 7 by 30 yrs out
Nearby sold comps map
Loading sold comps map…
Walkable amenities ~0.75 mi
Loading nearby amenities…
Taxation est. · year 1
- Rental income
- $90,679
- − Mortgage interest
- −$188,212
- − Property taxes
- −$49,079
- − Insurance
- −$16,800
- − Repairs & maintenance
- −$7,254
- − Management
- −$7,254
- − Depreciation
- −$97,745
- Taxable loss
- −$275,666
- Est. tax savings @ 24.0%
- +$66,160
- After-tax cash flow
- $-139,525/yr
For passive investors: Depreciation is non-cash, so a rental often shows a tax loss while cash-flowing — sheltering income. Rental losses are passive: they offset passive income freely, and up to $25,000/yr can offset ordinary (W-2) income if you actively participate and your MAGI is under $100k (phasing out to $0 by $150k); unused losses carry forward. On sale, claimed depreciation is recaptured at up to 25%, and gains may owe capital-gains tax (a 1031 exchange can defer both). Figures are a year-1 estimate at your 24.0% rate — not tax advice; consult a CPA.
Schools (NCES district)
- District
- Rye City School District
- NCES district ID
- 3625260
- Math proficiency
- 89% ▲ 11.00%
- Reading proficiency
- 93% ▲ 12.00%
- Median HH income
- $144,848
- Composite
- 85.84/100
- National rank
- #6
- State rank
- #4 of 590 in NY
Livability — Rye
- Score
- 70/100
- State rank
- #431
- US rank
- #7470
Category grades
Schools grade is shown separately in the Schools card above.
Census & demographics
- Census place
- Rye, NY
- County
- Westchester County · 709,332 people
- City population
- 18,391
- Metro
- New York-Newark-Jersey City, NY-NJ-PA
- Population (ZIP)
- 18,391
- Household income
- $250,001
- Rent vs Own
- Severe rent burden
- 580.0
Population outlook (Westchester County) Hauer SSP2
- Today (2025)
- 1,028,035 people
- By 2030
- 1,051,636 · +2.3%
- By 2040
- 1,098,520 · +6.9%
- By 2050
- 1,136,044 · +10.5%
- By 2075
- 1,196,925 · +16.4%
- By 2100
- 1,175,147 · +14.3%
Race, ethnicity, and origin ACS 2023
- Neighborhood character
- Predominantly White (77%)
- Race & ethnicity
- White 77% Two or more races 10% Asian 7% Hispanic / Latino 7% Black 2%
- Hispanic origin (detail)
- Puerto Rican 1%
- Common ancestry
- Romanian 5% Italian 3% German 3%
- Foreign-born
- 20% · Canada, China, South Korea
- Languages at home
- 80% English-only · Spanish 6% Other Indo-European 3% Chinese 2%
Political lean MEDSL · Westchester
- 2024 margin
- Strong D (+26.3) · D 63.1% · R 36.9%
- 2008→2024 swing
- -1.3pp toward R · 2008: 27.6pp · 2024: 26.3pp
- All cycles
- 2024: D+26.3 2020: D+36.3 2016: D+32.8 2012: D+22.2 2008: D+27.6
Not yet ingested
- Civics
- —
Market trends
- HPI YoY
- ▲ 6.64%
- Current HPI
- 321.5777
- Rent YoY
- —
- Metro
- New York-Newark-Jersey City, NY-NJ-PA
- State GDP YoY
- ▲ 2.60%
- F500 in state
- 92
Industry mix (Fortune 500 HQ in NY)
| Industry | F500 HQs | Revenue |
|---|---|---|
| Financial Services | 10 | $950B |
|
||
| Consumer Goods | 9 | $162B |
|
||
| Insurance | 4 | $225B |
|
||
| Telecommunications | 2 | $144B |
|
||
| Pharmaceuticals | 2 | $112B |
|
||
| Media / Entertainment | 2 | $69B |
|
||
Price history
+293.0% since first listed6 events — show timeline
- 2026-05-23 Pending — OneKey® MLS as Distributed by MLS Grid
- 2026-05-15 Listed $3,360,000 OneKey® MLS as Distributed by MLS Grid
- 2026-05-14 Coming Soon $3,360,000 OneKey® MLS as Distributed by MLS Grid
- 1997-08-26 Sold (Public Records) $1,200,000 Public Records
- 1991-06-28 Sold (Public Records) $825,000 Public Records
- 1989-08-18 Sold (Public Records) $855,000 Public Records
Property tax history
+17.6%/yrLatest (2025): $49,079 · -2.9% YoY. Source: county tax records.
Cash-flow waterfall
monthlySold comps — $/sqft
last 12 mo · ≤1 miLoading sold comps…