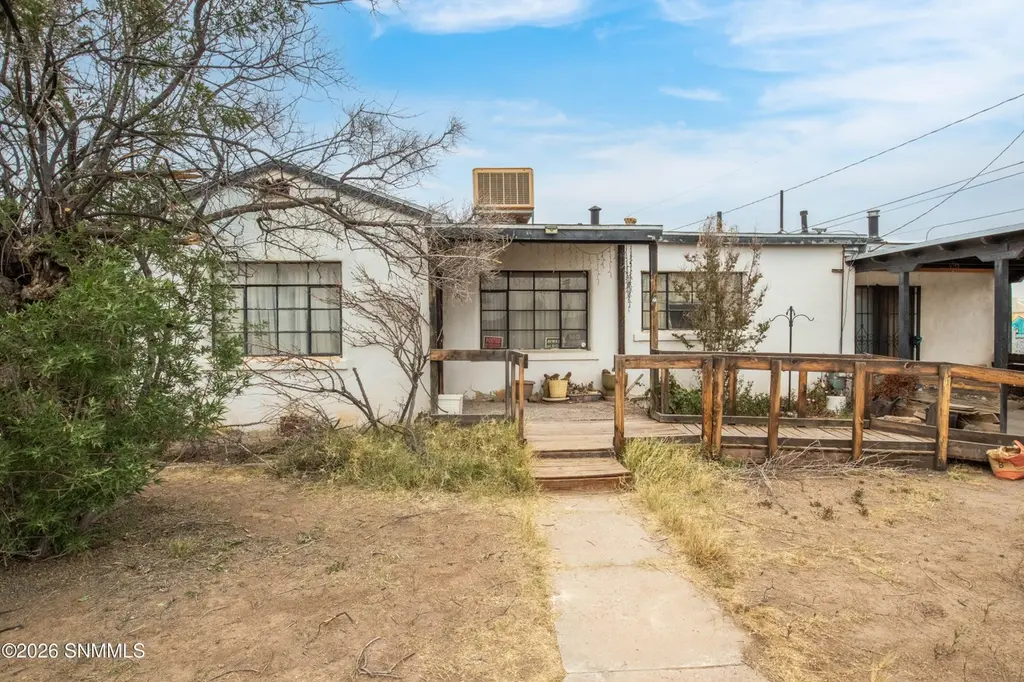
700 Newcomb St · Las Cruces, NM
Flood risk 1/10 · Minimal
- FEMA flood zone
- X (unshaded)
- Chance of flooding over 30 yrs
- 0.0%
- Est. flood insurance / yr
- $507 – $1,088
Fire risk 3/10 · Minor
- Est. fire insurance / yr
- $706 – $1,312
Heat risk 6/10 · Moderate
- Hot days now (above 100°F)
- 7 days/yr
- Hot days in 30 yrs
- 25 days/yr
Wind risk 1/10 · Minimal
- Chance of severe wind over 30 yrs
- —
Air-quality risk 1/10 · Minimal
- Unhealthy air days now
- 0 days/yr
- Unhealthy air days in 30 yrs
- 0 days/yr
Risk factors via First Street. Map © Google.
Why this score? — see what drove the C+ grade
The composite is a weighted blend of 9 inputs, each scored 0–100. Each bar is that input's sub-score; the figure is the points it added to the 100-point composite (weight × sub-score).
- Cash flow +30.0/30.0
- DSCR +10.0/10.0
- 1% rule +8.2/10.0
- Schools +4.6/10.0
- Livability +3.0/5.0
- Condition / age +2.5/5.0
- Rent growth +2.3/5.0
- ARV discount +0.0/15.0
- Appreciation +0.0/10.0
$110,000
🖨 Deal sheet 📄 Offer letter ✓ Due diligence
Listing remarks
Great investment opportunity at 700 Newcomb street. This property offers strong potential for rental income or future appreciation, making it an ideal addition to any investor's portfolio. 1,564 SqFt. Home with 3 Bedrooms and 1.5 Bathrooms with a flex room and split living rooms
Key facts
- 5,227 sq ft lot
- Parking
- Built 1950
Property features AI
Exterior
- Parking: Covered carport (1 space)
- Utilities: Public water; Public sewer; Natural gas available
- Home design: Single family residence; One story; Slab foundation
- Construction: Slab foundation
- Exterior features: Block, wood, and chain link fencing
Interior
- Kitchen: Gas range
- Flooring: Wood
- Bathrooms: 1 full bathroom; 1 half bathroom
- Heating & cooling: Forced air heating; Wood stove; Evaporative cooling
- Interior features: Wood flooring; Gas range
Neighborhood map
What this means for you Summary
Snapshot
- This is a 2-bed/1.0-bath single-family listed at $110k.
Deal economics
- At list price, monthly cash flow is $474 ($6k/yr) — positive.
- The deal already cash-flows at list — no discount required.
- Meets the 1% rule at list price ($1k rent vs $110k).
- Recommended offer: $107k (3.0% below list) — sets the bar for market timing.
Location & tenants
- Location reads 59/100 on livability (#120 in NM) — a working-class tenant base; expect higher turnover. Strengths: cost of living A+, housing A; Watch: amenities D+, schools D-, crime F.
- Las Cruces Public Schools (urban): math 42% / reading 68% proficiency, ranked #5 of 29 in NM (top 17%) — acceptable for families but not a draw, mixed tenant base, ~2y average lease; 62% free/reduced lunch — lower-income household profile, screen leases tightly.
- Market conditions: Rents soft (-0.9%/yr); 178 active listings in the ZIP; 9 comparable units currently listed for rent nearby; rentals at typical pace (median 22d on market — plan ~3-4 weeks tenant-placement turnaround); 964 units permitted in Doña Ana County in 2024 (0 in 5+ unit buildings).
- This rent runs 32% of the median local income ($54k/yr) — at the standard rent-burdened threshold; future hikes will face affordability resistance.
Forward outlook
- Local home prices are declining (-3.0%/yr); year-one equity from $761 of loan paydown is wiped out by about $3k of value loss. Plan a longer hold.
- At projected returns (-3.0% appreciation + 0.0% rent growth), your $31k cash investment doubles in ~9 years — after that, you're playing with house money.
Negotiation context
- It's been on market 41 days — a 3% lower offer ($107k) is reasonable based on typical stale-listing flexibility.
Risks & watch-outs
- Watch-outs: built in 1950 — expect roof / HVAC / electrical / plumbing capex.
- Climate carrying-cost: extreme-heat days projected 7→25/yr by 2055 (HVAC capex compounding) — expect insurance premiums to compound above CPI over the hold.
Questions for the listing agent
- It's been on market 41 days. Have you received any prior offers? Is the seller open to a 3% concession, seller financing, or rate buy-down credit?
- Built in 1950 — when were the roof, HVAC, electrical panel, plumbing, and water heater last replaced?
- Is there a deadline driving the sale (1031 exchange, divorce, estate, relocation)? That informs how much negotiation room exists.
- Schools are D-rated, which usually means shorter tenancies and higher turnover. Who's the typical renter profile here, and what's been the actual vacancy rate?
- Crime grade is F in this area — have there been break-ins, vandalism, or insurance claims at this property in the last 3 years? What carrier currently insures it and at what premium?
- What's the average days-on-market for RENTAL listings here right now (not sales)? A rising rental-DOM trend means longer vacancies and softer asking-rent achievability than the comps imply.
- What's the recent tenant-quality profile in this submarket — average credit score on applications, eviction rate, late-payment / NSF rate, and stable-employment percentage? A property-management company in the area should have these aggregated.
- How much new for-sale + rental construction is in the pipeline within 1–3 miles? Heavy new supply typically softens prices + rents 12–24 months out; constrained supply supports both.
Investment metrics
- 1% rule
- 1.32% ✓
- Cap rate
- 11.46%
- Cash-on-cash
- 18.45%
- DSCR
- 1.82
- GRM
- 6.3
CMA / ARV
- ARV (median comp)
- $76,015
- List price
- $110,000
- Delta
- 44.71%
- Verdict
- OVERPRICED
- Comps
- 2 within 1.0 mi
Projected returns pro-forma
-3.0% appreciation · 0.0% rent growth · sell at horizon
- IRR
- 6.9%
- Equity multiple
- 1.26×
- Total profit
- $8,047
- Equity at exit
- $16,401
- IRR
- 13.6%
- Equity multiple
- 1.95×
- Total profit
- $29,261
- Equity at exit
- $9,511
Cash invested: $30,800 (down + closing). Projections, not guarantees.
Landlord ↔ Tenant lean methodology
- Overall (STATE)
- 55 Moderately Landlord-Leaning
- State New Mexico
- 55 Moderately Landlord-Leaning · D+3
- County
- — inherits STATE
- City
- — inherits STATE
ZIP-level market 88005
- Rents YoY
- -0.9%
- Active inventory
- 178
- Price-to-rent
- 6.3×
Monthly cashflow live
- Estimated rent
- $1,453 high interval (Pro) →
- Mortgage (P&I)
- −$577
- Tax from tax record
- −$52 /mo · $622/yr
- Insurance
- −$46
- HOA
- −$0
- Vacancy / Maint / Mgmt
- −$305
- Net cashflow
- $474
Break-even live
UW: 25.0% down · 7.5% · 30yr · 1.5% tax · 5.0% vac · 8.0% maint · 8.0% mgmt
Financing live
Cash to close
- Down payment
- $27,500
- Closing costs
- $3,300
- Reserves months
- —
- Total cash needed
- —
Loan-product check · same deal, 3 products live
Conventional
25% down · 7.5% · 30yr
- Down + closing
- —
- Monthly P&I
- —
- Monthly cashflow
- —
- DSCR
- —
- Eligible?
- —
Personal DTI + credit; lowest rate.
DSCR
20% down · 8.5% · 30yr
- Down + closing
- —
- Monthly P&I
- —
- Monthly cashflow
- —
- DSCR
- —
- Eligible?
- —
No personal income docs; deal must DSCR.
Hard money
10% down · 12.0% · 12mo
- Down + closing
- —
- Monthly P&I
- —
- Monthly cashflow
- —
- DSCR
- —
- Eligible?
- —
Short-term bridge; refi at stabilization.
Rent comps 9 comps
| Address | Beds | Baths | Sqft | Rent | $/sqft | DOM | Units | Dist |
|---|---|---|---|---|---|---|---|---|
| 1048 McFie Ave Las Cruces, NM | 3.0 | 2.0 | 1200 | $1,550 | $1.29 | 21d | 1 | 0.37mi |
| 2035 Rosedale Dr Las Cruces, NM | 3.0 | 2.0 | 1425 | $1,550 | $1.09 | 13d | 1 | 0.87mi |
| 2040 Carlyle Dr Las Cruces, NM | 3.0 | 2.0 | 1852 | $1,595 | $0.86 | 44d | 1 | 0.89mi |
| 169 Oban Ct Las Cruces, NM | 3.0 | 2.0 | 1289 | $1,350 | $1.05 | 13d | 1 | 0.89mi |
| 1595 Carrillo Ct Unit A Las Cruces, NM | 3.0 | 2.0 | 1405 | $1,295 | $0.92 | 44d | 1 | 0.92mi |
| 560 El Molino Blvd Las Cruces, NM | 3.0 | 2.0 | 1487 | $1,500 | $1.01 | 13d | 1 | 0.95mi |
| 999 Gilmer Way Las Cruces, NM | 3.0 | 2.5 | 2169 | $2,250 | $1.04 | 21d | 1 | 1.05mi |
| 2081 Nehemiah Ct Las Cruces, NM | 3.0 | 1.5 | 1380 | $1,700 | $1.23 | 21d | 1 | 1.22mi |
| 1000 Coyote Trl Las Cruces, NM | 3.0 | 2.0 | 1280 | $1,524 | $1.19 | 13d | 1 | 1.36mi |
Listing history 15 events
-
2026-06-18days on market $110,000 Active 41 DOM
-
2026-06-17days on market $110,000 Active 40 DOM
-
2026-06-16days on market $110,000 Active 39 DOM
-
2026-06-15days on market $110,000 Active 38 DOM
-
2026-06-14pricedays on market $110,000 Active 36 DOM
-
2026-06-13days on market $115,000 Active 35 DOM
-
2026-06-10days on market $115,000 Active 33 DOM
-
2026-06-09days on market $115,000 Active 32 DOM
-
2026-06-08days on market $115,000 Active 31 DOM
-
2026-06-07days on market $115,000 Active 30 DOM
-
2026-06-02days on market $115,000 Active 25 DOM
-
2026-06-01days on market $115,000 Active 24 DOM
-
2026-05-31days on market $115,000 Active 23 DOM
-
2026-05-30days on market $115,000 Active 22 DOM
-
2026-05-05$115,000 Active 279-char remark
ⓘ Source: listings_history table (triggers on properties + properties_extension) + one-shot
backfill from property_details.listing_events for pre-trigger history.
Tax reassessment forecast NM · Resets to sale price
- Current annual tax
- $622 · $52/mo
- Projected year-2 tax
- $880 · $73/mo
- Expected delta
- +$258/yr (+$22/mo · 41.5%)
ⓘ Screening estimate from a state-policy table — verify with the county assessor before closing.
Climate risk First Street
- Flood 1/10 Low FEMA zone X (unshaded) · 0% chance over 30 yrs
- Wildfire 3/10 Moderate
- Heat 6/10 Major 7 d/yr ≥100°F today · 25 d/yr by 30 yrs out
- Wind 1/10 Low
- Air quality 1/10 Low 0 unhealthy d/yr today · 0 by 30 yrs out
Nearby sold comps map
Loading sold comps map…
Walkable amenities ~0.75 mi
Loading nearby amenities…
Taxation est. · year 1
- Rental income
- $17,439
- − Mortgage interest
- −$6,162
- − Property taxes
- −$622
- − Insurance
- −$550
- − Repairs & maintenance
- −$1,395
- − Management
- −$1,395
- − Depreciation
- −$3,200
- Taxable income
- $4,115
- Est. tax owed @ 24.0%
- −$988
- After-tax cash flow
- $4,695/yr
For passive investors: Depreciation is non-cash, so a rental often shows a tax loss while cash-flowing — sheltering income. Rental losses are passive: they offset passive income freely, and up to $25,000/yr can offset ordinary (W-2) income if you actively participate and your MAGI is under $100k (phasing out to $0 by $150k); unused losses carry forward. On sale, claimed depreciation is recaptured at up to 25%, and gains may owe capital-gains tax (a 1031 exchange can defer both). Figures are a year-1 estimate at your 24.0% rate — not tax advice; consult a CPA.
Schools (NCES district)
- District
- Las Cruces Public Schools
- NCES district ID
- 3501500
- Math proficiency
- 42% ▲ 24.00%
- Reading proficiency
- 68% ▲ 35.00%
- Median HH income
- $41,157
- Composite
- 45.98/100
- National rank
- #2535
- State rank
- #5 of 29 in NM
Livability — Las Cruces
- Score
- 59/100
- State rank
- #120
- US rank
- #19687
Category grades
Schools grade is shown separately in the Schools card above.
Census & demographics
- Census place
- Las Cruces, NM
- County
- Dona Ana County · 144,044 people
- City population
- 131,421
- Metro
- Las Cruces, NM
- Population (ZIP)
- 27,509
- Household income
- $54,452
- Rent vs Own
- Severe rent burden
- 1248.0
Population outlook (Doña Ana County) Hauer SSP2
- Today (2025)
- 219,177 people
- By 2030
- 220,967 · +0.8%
- By 2040
- 222,775 · +1.6%
- By 2050
- 223,576 · +2.0%
- By 2075
- 228,461 · +4.2%
- By 2100
- 214,536 · -2.1%
Race, ethnicity, and origin ACS 2023
- Neighborhood character
- Majority Hispanic (58%)
- Race & ethnicity
- Hispanic / Latino 58% White 35% Two or more races 28% Black 2% Native American 1%
- Hispanic origin (detail)
- Mexican 48%
- Common ancestry
- Italian 2% Lithuanian 1% Slovak 1%
- Foreign-born
- 9% · Canada
- Languages at home
- 68% English-only · Spanish 30%
Political lean MEDSL · Doña Ana
- 2024 margin
- Lean D (+9.8) · D 53.8% · R 44.0% · Other 2.2%
- 2008→2024 swing
- -7.9pp toward R · 2008: 17.6pp · 2024: 9.8pp
- All cycles
- 2024: D+9.8 2020: D+18.3 2016: D+18.0 2012: D+14.9 2008: D+17.6
Not yet ingested
- Civics
- —
Market trends
- HPI YoY
- ▼ -186.66%
- Current HPI
- 188.4624
- Rent YoY
- ▼ -0.88%
- Metro
- Las Cruces, NM
- State GDP YoY
- —
- F500 in state
- 0
Price history
-4.3% since first listed2 events — show timeline
- 2026-06-13 Price Changed $110,000 SNMMLS as distributed by MLS GRID
- 2026-05-05 Listed $115,000 SNMMLS as distributed by MLS GRID
Property tax history
+0.3%/yrLatest (2025): $622 · -0.6% YoY. Source: county tax records.
Cash-flow waterfall
monthlySold comps — $/sqft
last 12 mo · ≤1 miLoading sold comps…