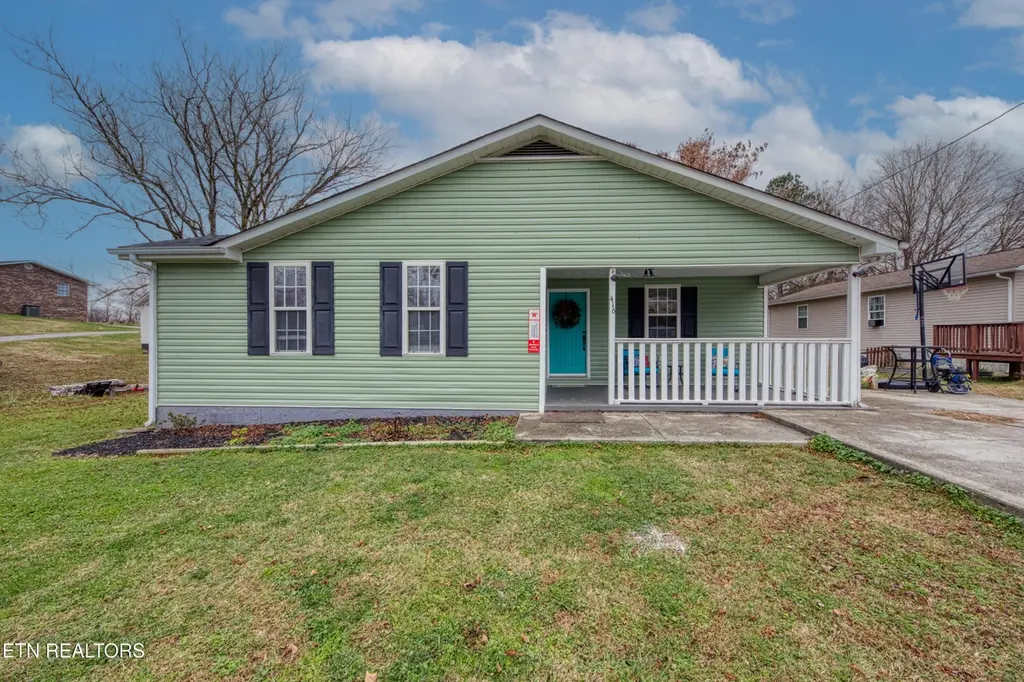
416 Mill St · Madisonville, TN
Flood risk 6/10 · Moderate
- FEMA flood zone
- X (unshaded)
- Chance of flooding over 30 yrs
- 0.74%
- Est. flood insurance / yr
- $507 – $1,088
Fire risk 3/10 · Minor
- Est. fire insurance / yr
- $949 – $1,763
Heat risk 6/10 · Moderate
- Hot days now (above 103°F)
- 7 days/yr
- Hot days in 30 yrs
- 20 days/yr
Wind risk 2/10 · Minimal
- Chance of severe wind over 30 yrs
- 0.0%
Air-quality risk 3/10 · Minor
- Unhealthy air days now
- 2 days/yr
- Unhealthy air days in 30 yrs
- 2 days/yr
Risk factors via First Street. Map © Google.
Why this score? — see what drove the C+ grade
The composite is a weighted blend of 9 inputs, each scored 0–100. Each bar is that input's sub-score; the figure is the points it added to the 100-point composite (weight × sub-score).
- Cash flow +25.9/30.0
- ARV discount +13.4/15.0
- DSCR +8.7/10.0
- 1% rule +5.7/10.0
- Livability +3.2/5.0
- Rent growth +2.5/5.0
- Condition / age +2.5/5.0
- Schools +1.8/10.0
- Appreciation +0.0/10.0
$215,000
🖨 Deal sheet 📄 Offer letter ✓ Due diligence
Listing remarks
Welcome to this beautifully maintained 3-bedroom, 2-bath home in the heart of Madisonville, TN. Perfectly situated in a quiet, convenient neighborhood, this property offers comfortable living with easy access to local shops, schools, and parks. Charming gazebo—perfect for weekend hangouts, entertaining friends, or relaxing in the shade. Whether you're a first-time buyer, downsizing, or simply looking for a well-kept home in a friendly community, this property checks all the boxes. Move-in ready and easy to love!
Key facts
- Charming gazebo
- Quiet neighborhood
- Easy access to parks
Tags
Property features AI
Exterior
- Parking: Designated parking
- Utilities: Public sewer
- Home design: Detached property
- Construction: Vinyl siding, block, and frame construction
- Exterior features: Gazebo; Level lot; City view
Interior
- Flooring: Carpet flooring
- Bathrooms: 2 full bathrooms; 1 half bathroom (3 total bathrooms)
- Heating & cooling: Central heating; Natural gas heating; Electric heating; Central cooling
- Interior features: Five total rooms; Crawl space basement
Neighborhood map
What this means for you Summary
Snapshot
- This is a 3-bed/2.0-bath single-family listed at $215k.
Deal economics
- At list price, monthly cash flow is $529 ($6k/yr) — positive.
- The deal already cash-flows at list — no discount required.
- Meets the 1% rule at list price ($2k rent vs $215k).
- Recommended offer: $209k (3.0% below list) — sets the bar for market timing.
- Cap rate 9.2% vs local median 3.0% in Madisonville — top-decile yield for the area; either an underpriced asset or a hidden risk that comps aren't pricing in. Stress-test before assuming the spread holds.
Location & tenants
- Location reads 63/100 on livability (#188 in TN) — a middle-class / working-renter tenant base. Strengths: cost of living A+, housing A+; Watch: health & safety C-, crime D+, amenities F.
- Monroe County (rural): math 20% / reading 24% proficiency, ranked #106 of 139 in TN (top 76%) — low school quality limits family demand, transient renter base, plan for 1-2y turnover.
- Zoned schools: Madisonville Intermediate School (math 26% / reading 24%, grade F, #541 of 952 statewide, top 57%, 474 students, 0% FRL); Madisonville Middle School (math 15% / reading 20%, grade F, #215 of 333 statewide, top 65%, 428 students, 0% FRL); Sequoyah High School (math 20% / reading 32%, grade F, #117 of 332 statewide, top 37%, 806 students, 0% FRL) — zoned schools average 0% FRL vs 57% district-wide (57 pts lower); this property's tenant base skews higher-income than the district average.
- Market conditions: 166 active listings in the ZIP; 1 comparable units currently listed for rent nearby; 157 units permitted in Monroe County in 2024 (0 in 5+ unit buildings).
Forward outlook
- Local home prices are declining (-3.0%/yr); year-one equity from $1k of loan paydown is wiped out by about $6k of value loss. Plan a longer hold.
Negotiation context
- It's been on market 49 days — a 3% lower offer ($209k) is reasonable based on typical stale-listing flexibility.
- 10 sale attempts since 21y ago with the ask held roughly flat each time — persistent listings suggest the price (not the market) is what's stuck; bring a comps-based counter.
- Current owner paid $122k; list at $215k implies a 76% gain — meaningful room to come down on a strong offer.
Risks & watch-outs
- Watch-outs: built in 1953 — expect roof / HVAC / electrical / plumbing capex.
- Climate carrying-cost: major flood risk; extreme-heat days projected 7→20/yr by 2055 (HVAC capex compounding) — expect insurance premiums to compound above CPI over the hold.
Questions for the listing agent
- It's been on market 49 days. Have you received any prior offers? Is the seller open to a 3% concession, seller financing, or rate buy-down credit?
- Built in 1953 — when were the roof, HVAC, electrical panel, plumbing, and water heater last replaced?
- Is there a deadline driving the sale (1031 exchange, divorce, estate, relocation)? That informs how much negotiation room exists.
- Schools are F-rated, which usually means shorter tenancies and higher turnover. Who's the typical renter profile here, and what's been the actual vacancy rate?
- Crime grade is D in this area — have there been break-ins, vandalism, or insurance claims at this property in the last 3 years? What carrier currently insures it and at what premium?
- What's the average days-on-market for RENTAL listings here right now (not sales)? A rising rental-DOM trend means longer vacancies and softer asking-rent achievability than the comps imply.
- What's the recent tenant-quality profile in this submarket — average credit score on applications, eviction rate, late-payment / NSF rate, and stable-employment percentage? A property-management company in the area should have these aggregated.
- How much new for-sale + rental construction is in the pipeline within 1–3 miles? Heavy new supply typically softens prices + rents 12–24 months out; constrained supply supports both.
Investment metrics
- 1% rule
- 1.07% ✓
- Cap rate
- 9.24%
- Cash-on-cash
- 10.54%
- DSCR
- 1.47
- GRM
- 7.8
CMA / ARV
- ARV (on-the-fly)
- $247,572
- Comps found
- 12
Show comp detail 12 sales within ~0.75 mi
| Address | Dist | Beds/Ba | Sqft | Sold | Price | $/sf | Match |
|---|---|---|---|---|---|---|---|
| 296 Greenwood Cir | 0.25mi | 3/2.0 | 1,173 (-2%) | 5mo | $208,000 | $177 | 81 |
| 500 Englewood Rd | 0.19mi | 2/2.0 (-1) | 1,200 (+0%) | 13mo | $215,000 | $179 | 75 |
| 525 Monroe St | 0.49mi | 3/2.0 | 1,185 (-1%) | 3mo | $260,000 | $219 | 73 |
| 206 Marietta St | 0.24mi | 2/1.0 (-1) | 1,150 (-4%) | 2mo | $200,000 | $174 | 71 |
| 503 Englewood Rd | 0.25mi | 3/1.0 | 1,288 (+8%) | 2mo | $275,000 | $214 | 70 |
| 412 Oklahoma St | 0.27mi | 3/2.0 | 1,275 (+7%) | 9mo | $270,000 | $212 | 69 |
| 430 Englewood Rd | 0.19mi | 2/2.0 (-1) | 1,088 (-9%) | 4mo | $225,000 | $207 | 68 |
| 428 Englewood Rd | 0.19mi | 2/2.0 (-1) | 1,080 (-10%) | 4mo | $230,000 | $213 | 67 |
| 156 Vine St | 0.13mi | 3/1.0 | 1,040 (-13%) | 5mo | $199,999 | $192 | 64 |
| 432 Englewood Rd | 0.19mi | 2/2.0 (-1) | 1,040 (-13%) | 4mo | $233,600 | $225 | 62 |
| 241 Marietta St | 0.20mi | 2/1.0 (-1) | 1,068 (-11%) | 12mo | $175,000 | $164 | 54 |
| 812 Maple Ln | 0.72mi | 3/2.0 | 1,328 (+11%) | 2mo | $265,000 | $200 | 46 |
Match score weights: distance 35% · size 25% · config 20% · recency 20%. Top-matched comps best support the ARV.
Projected returns pro-forma
-3.0% appreciation · 3.0% rent growth · sell at horizon
- IRR
- -0.5%
- Equity multiple
- 0.98×
- Total profit
- $-1,243
- Equity at exit
- $32,057
- IRR
- 9.1%
- Equity multiple
- 1.70×
- Total profit
- $41,937
- Equity at exit
- $18,589
Cash invested: $60,200 (down + closing). Projections, not guarantees.
Landlord ↔ Tenant lean methodology
- Overall (STATE)
- 87 Strongly Landlord-Friendly
- State Tennessee
- 87 Strongly Landlord-Friendly · R+13
- County
- — inherits STATE
- City
- — inherits STATE
ZIP-level market 37354
- Home prices YoY
- -20.5%
- Active inventory
- 166
- Price-to-rent
- 7.8×
Monthly cashflow live
- Estimated rent
- $2,300 medium interval (Pro) →
- Mortgage (P&I)
- −$1,127
- Tax from tax record
- −$71 /mo · $853/yr
- Insurance
- −$90
- HOA
- −$0
- Vacancy / Maint / Mgmt
- −$483
- Net cashflow
- $529
Break-even live
UW: 25.0% down · 7.5% · 30yr · 1.5% tax · 5.0% vac · 8.0% maint · 8.0% mgmt
Financing live
Cash to close
- Down payment
- $53,750
- Closing costs
- $6,450
- Reserves months
- —
- Total cash needed
- —
Loan-product check · same deal, 3 products live
Conventional
25% down · 7.5% · 30yr
- Down + closing
- —
- Monthly P&I
- —
- Monthly cashflow
- —
- DSCR
- —
- Eligible?
- —
Personal DTI + credit; lowest rate.
DSCR
20% down · 8.5% · 30yr
- Down + closing
- —
- Monthly P&I
- —
- Monthly cashflow
- —
- DSCR
- —
- Eligible?
- —
No personal income docs; deal must DSCR.
Hard money
10% down · 12.0% · 12mo
- Down + closing
- —
- Monthly P&I
- —
- Monthly cashflow
- —
- DSCR
- —
- Eligible?
- —
Short-term bridge; refi at stabilization.
Rent comps 1 comps
| Address | Beds | Baths | Sqft | Rent | $/sqft | DOM | Units | Dist |
|---|---|---|---|---|---|---|---|---|
| 188 Park Ave Madisonville, TN | 3.0 | 2.0 | 1428 | $2,300 | $1.61 | 14d | 1 | 1.47mi |
Listing history 44 events
-
2026-06-18days on market $215,000 Active 49 DOM
-
2026-06-17days on market $215,000 Active 48 DOM
-
2026-06-16days on market $215,000 Active 47 DOM
-
2026-06-16status $215,000 Active 46 DOM
-
2026-06-15days on market $215,000 Pending - Continue to Show 46 DOM
-
2026-06-14days on market $215,000 Pending - Continue to Show 44 DOM
-
2026-06-13days on market $215,000 Pending - Continue to Show 43 DOM
-
2026-06-10days on market $215,000 Pending - Continue to Show 41 DOM
-
2026-06-09days on market $215,000 Pending - Continue to Show 40 DOM
-
2026-06-08days on market $215,000 Pending - Continue to Show 39 DOM
-
2026-06-07days on market $215,000 Pending - Continue to Show 38 DOM
-
2026-06-05days on market $215,000 Pending - Continue to Show 35 DOM
-
2026-06-03days on market $215,000 Pending - Continue to Show 34 DOM
-
2026-06-02days on market $215,000 Pending - Continue to Show 33 DOM
-
2026-06-01days on market $215,000 Pending - Continue to Show 32 DOM
-
2026-05-31days on market $215,000 Pending - Continue to Show 31 DOM
-
2026-05-31days on market $215,000 Pending - Continue to Show 30 DOM
-
2026-05-17historical Pending - Continue to Show
-
2026-04-30$215,000 Active
-
2026-04-16historical Pending - Continue to Show
-
2026-04-16historical
-
2026-03-27price $215,000
-
2026-02-24$220,000 Active
-
2026-02-15historical
-
2026-02-02price $227,500
-
2026-01-09price $229,000
-
2025-12-18price $231,000
-
2025-12-05$235,000 Active
-
2019-01-16soldstatus $122,000
-
2019-01-15soldstatus $122,000 Closed
-
2018-11-13historical Pending - Continue to Show
-
2018-11-10$119,900 Active
-
2018-11-09historical
-
2018-09-14status Active
-
2018-07-26historical Pending - Continue to Show
-
2018-07-14status Active
-
2018-07-11historical Pending - Continue to Show
-
2018-07-02status Active
-
2018-06-25historical Pending - Continue to Show
-
2018-06-23$119,900 Active
-
2005-11-18soldstatus $84,900
-
2005-11-05$84,900
-
2005-08-12soldstatus $16,000
-
2005-07-27$15,900
ⓘ Source: listings_history table (triggers on properties + properties_extension) + one-shot
backfill from property_details.listing_events for pre-trigger history.
Tax reassessment forecast TN · Resets to sale price
- Current annual tax
- $853 · $71/mo
- Projected year-2 tax
- $1,526 · $127/mo
- Expected delta
- +$674/yr (+$56/mo · 79.0%)
ⓘ Screening estimate from a state-policy table — verify with the county assessor before closing.
Climate risk First Street
- Flood 6/10 Major FEMA zone X (unshaded) · 74% chance over 30 yrs
- Wildfire 3/10 Moderate
- Heat 6/10 Major 7 d/yr ≥103°F today · 20 d/yr by 30 yrs out
- Wind 2/10 Low 0% chance of damaging wind over 30 yrs
- Air quality 3/10 Moderate 2 unhealthy d/yr today · 2 by 30 yrs out
Nearby sold comps map
Loading sold comps map…
Walkable amenities ~0.75 mi
Loading nearby amenities…
Taxation est. · year 1
- Rental income
- $27,600
- − Mortgage interest
- −$12,043
- − Property taxes
- −$853
- − Insurance
- −$1,075
- − Repairs & maintenance
- −$2,208
- − Management
- −$2,208
- − Depreciation
- −$6,255
- Taxable income
- $2,958
- Est. tax owed @ 24.0%
- −$710
- After-tax cash flow
- $5,636/yr
For passive investors: Depreciation is non-cash, so a rental often shows a tax loss while cash-flowing — sheltering income. Rental losses are passive: they offset passive income freely, and up to $25,000/yr can offset ordinary (W-2) income if you actively participate and your MAGI is under $100k (phasing out to $0 by $150k); unused losses carry forward. On sale, claimed depreciation is recaptured at up to 25%, and gains may owe capital-gains tax (a 1031 exchange can defer both). Figures are a year-1 estimate at your 24.0% rate — not tax advice; consult a CPA.
Schools (NCES district)
- District
- Monroe County
- NCES district ID
- 4703000
- Math proficiency
- 20% ▼ -8.00%
- Reading proficiency
- 24% ▼ -6.00%
- Median HH income
- $36,701
- Composite
- 18.29/100
- National rank
- #8956
- State rank
- #106 of 139 in TN
Livability — Madisonville
- Score
- 63/100
- State rank
- #188
- US rank
- #15127
Category grades
Schools grade is shown separately in the Schools card above.
Census & demographics
- Census place
- Madisonville, TN
- Population (ZIP)
- 17,421
Population outlook (Monroe County) Hauer SSP2
- Today (2025)
- 47,571 people
- By 2030
- 48,155 · +1.2%
- By 2040
- 48,772 · +2.5%
- By 2050
- 48,698 · +2.4%
- By 2075
- 48,558 · +2.1%
- By 2100
- 47,543 · -0.1%
Race, ethnicity, and origin ACS 2023
- Neighborhood character
- Predominantly White (90%)
- Race & ethnicity
- White 90% Two or more races 7% Hispanic / Latino 3% Black 1%
- Common ancestry
- Serbian 3% Slovak 2% Lithuanian 2%
- Foreign-born
- 1% · Canada
- Languages at home
- 99% English-only · Spanish 1%
Political lean MEDSL · Monroe
- 2024 margin
- Solid R (+66.8) · D 16.2% · R 83.0%
- 2008→2024 swing
- -28.5pp toward R · 2008: -38.3pp · 2024: -66.8pp
- All cycles
- 2024: R+66.8 2020: R+62.6 2016: R+59.7 2012: R+45.0 2008: R+38.3
Not yet ingested
- Civics
- —
Market trends
- HPI YoY
- ▼ -69.48%
- Current HPI
- 268.822
- Rent YoY
- —
- Metro
- —
- State GDP YoY
- ▲ 2.78%
- F500 in state
- 22
Industry mix (Fortune 500 HQ in TN)
| Industry | F500 HQs | Revenue |
|---|---|---|
| Healthcare | 3 | $91B |
|
||
| Retail | 3 | $72B |
|
||
| Transportation / Logistics | 1 | $88B |
|
||
| Paper / Packaging | 1 | $19B |
|
||
| Insurance | 1 | $13B |
|
||
| Energy | 1 | $12B |
|
||
Price history
+1252.2% since first listed27 events — show timeline
- 2026-05-17 Contingent — Knoxville MLS
- 2026-04-30 Listed $215,000 Knoxville MLS
- 2026-04-16 Contingent — Knoxville MLS
- 2026-04-16 Listing Removed — Knoxville MLS
- 2026-03-27 Price Changed $215,000 Knoxville MLS
- 2026-02-24 Listed $220,000 Knoxville MLS
- 2026-02-15 Listing Removed — Knoxville MLS
- 2026-02-02 Price Changed $227,500 Knoxville MLS
- 2026-01-09 Price Changed $229,000 Knoxville MLS
- 2025-12-18 Price Changed $231,000 Knoxville MLS
- 2025-12-05 Listed $235,000 Knoxville MLS
- 2019-01-16 Sold (Public Records) $122,000 Public Records
- 2019-01-15 Sold (MLS) $122,000 Knoxville MLS
- 2018-11-13 Contingent — Knoxville MLS
- 2018-11-10 Listed $119,900 Knoxville MLS
- 2018-11-09 Listing Removed — Knoxville MLS
- 2018-09-14 Relisted — Knoxville MLS
- 2018-07-26 Contingent — Knoxville MLS
- 2018-07-14 Relisted — Knoxville MLS
- 2018-07-11 Contingent — Knoxville MLS
- 2018-07-02 Relisted — Knoxville MLS
- 2018-06-25 Contingent — Knoxville MLS
- 2018-06-23 Listed $119,900 Knoxville MLS
- 2005-11-18 Sold (MLS) $84,900 Knoxville MLS
- 2005-11-05 Listed $84,900 Knoxville MLS
- 2005-08-12 Sold (MLS) $16,000 Knoxville MLS
- 2005-07-27 Listed $15,900 Knoxville MLS
Property tax history
+4.0%/yrLatest (2025): $853 · +0.0% YoY. Source: county tax records.
Cash-flow waterfall
monthlySold comps — $/sqft
last 12 mo · ≤1 miLoading sold comps…