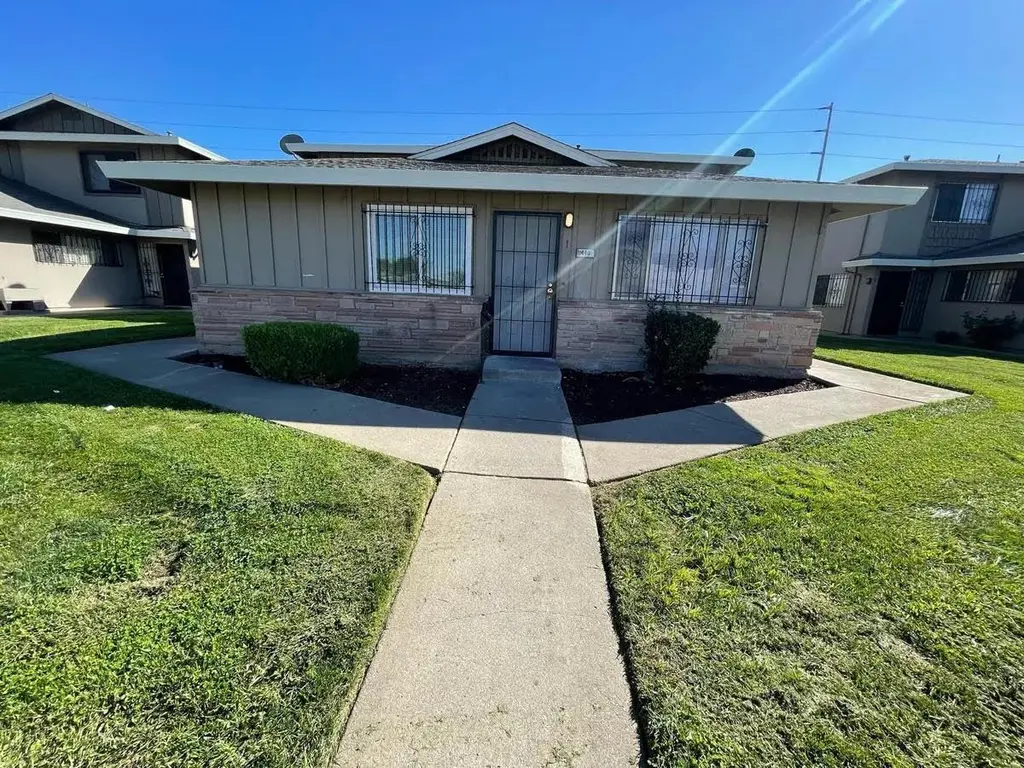
440 Caribrook Way #1 · Stockton, CA
Flood risk 1/10 · Minimal
- FEMA flood zone
- X
- Chance of flooding over 30 yrs
- 0.0%
- Est. flood insurance / yr
- $507 – $1,088
Fire risk 6/10 · Moderate
- Est. fire insurance / yr
- $659 – $1,223
Heat risk 7/10 · Major
- Hot days now (above 102°F)
- 7 days/yr
- Hot days in 30 yrs
- 15 days/yr
Wind risk 1/10 · Minimal
- Chance of severe wind over 30 yrs
- —
Air-quality risk 10/10 · Severe
- Unhealthy air days now
- 30 days/yr
- Unhealthy air days in 30 yrs
- 30 days/yr
Risk factors via First Street. Map © Google.
Why this score? — see what drove the C- grade
The composite is a weighted blend of 9 inputs, each scored 0–100. Each bar is that input's sub-score; the figure is the points it added to the 100-point composite (weight × sub-score).
- Cash flow +20.2/30.0
- 1% rule +7.4/10.0
- ARV discount +6.5/15.0
- DSCR +6.4/10.0
- Rent growth +3.2/5.0
- Schools +2.9/10.0
- Livability +2.9/5.0
- Condition / age +2.5/5.0
- Appreciation +0.0/10.0
$139,999
🖨 Deal sheet 📄 Offer letter ✓ Due diligence
Listing remarks
Lower-level unit condo. Features 2bd 1 bath, laminate flooring and central heat and air. Currently tenant occupied on month-to-month lease at $1550.00 per month.
Key facts
- $295 HOA
- Garage
- Built 1972
Neighborhood map
What this means for you Summary
Snapshot
- This is a 2-bed/1.0-bath condo listed at $140k.
Deal economics
- At list price, monthly cash flow is $176 ($2k/yr) — positive.
- The deal already cash-flows at list — no discount required.
- Meets the 1% rule at list price ($2k rent vs $140k).
- Recommended offer: $123k (12.0% below list) — sets the bar for market timing.
- Cap rate 7.8% vs local median 3.6% in Stockton — top-decile yield for the area; either an underpriced asset or a hidden risk that comps aren't pricing in. Stress-test before assuming the spread holds.
Location & tenants
- Location reads 57/100 on livability (#734 in CA) — a working-class tenant base; expect higher turnover. Strengths: housing A+, health & safety A, amenities A-; Watch: employment C-, schools D-, crime F.
- Stockton Unified (urban): math 23% / reading 46% proficiency, ranked #295 of 517 in CA (top 57%) — families likely to look elsewhere, expect single-tenant / working-renter base with shorter leases; 78% free/reduced lunch — lower-income household profile, screen leases tightly.
- Market conditions: Rents rising (+2.7%/yr); 171 active listings in the ZIP; 38 comparable units currently listed for rent nearby; rentals at typical pace (median 21d on market — plan ~3-4 weeks tenant-placement turnaround); 3,779 units permitted in San Joaquin County in 2024 (0 in 5+ unit buildings).
- This rent runs 30% of the median local income ($69k/yr) — at the standard rent-burdened threshold; future hikes will face affordability resistance.
Forward outlook
- Local home prices are declining (-3.0%/yr); year-one equity from $968 of loan paydown is wiped out by about $4k of value loss. Plan a longer hold.
- San Joaquin County population projected at +17% by 2050 — long-run rental-demand tailwind backs the buy-and-hold thesis.
Negotiation context
- It's been on market 171 days — a 12% lower offer ($123k) is reasonable based on typical stale-listing flexibility.
- Current owner paid $95k; 47% above their basis — modest negotiation headroom, anchor on the comps not their cost.
Risks & watch-outs
- Climate carrying-cost: major wildfire risk; extreme-heat days projected 7→15/yr by 2055 (HVAC capex compounding) — expect insurance premiums to compound above CPI over the hold.
Questions for the listing agent
- It's been on market 171 days. Have you received any prior offers? Is the seller open to a 12% concession, seller financing, or rate buy-down credit?
- Built in 1972 — when were the roof, HVAC, electrical panel, plumbing, and water heater last replaced?
- What does the HOA fee cover, when was the last increase, and are there any pending special assessments or reserve-fund shortfalls?
- Any open or pending special assessments — roof, HVAC, plumbing, elevator, façade? What's the per-unit balance and payoff schedule, and is the seller paying it off at close or rolling it to the buyer?
- Why hasn't it sold? Are there any deal-killer items the seller is aware of (foundation, flood, title, zoning, code violations)?
- Is there a deadline driving the sale (1031 exchange, divorce, estate, relocation)? That informs how much negotiation room exists.
- Schools are D-rated, which usually means shorter tenancies and higher turnover. Who's the typical renter profile here, and what's been the actual vacancy rate?
- Crime grade is F in this area — have there been break-ins, vandalism, or insurance claims at this property in the last 3 years? What carrier currently insures it and at what premium?
- What's the average days-on-market for RENTAL listings here right now (not sales)? A rising rental-DOM trend means longer vacancies and softer asking-rent achievability than the comps imply.
- What's the recent tenant-quality profile in this submarket — average credit score on applications, eviction rate, late-payment / NSF rate, and stable-employment percentage? A property-management company in the area should have these aggregated.
- How much new apartment / multifamily construction is in the pipeline within 1–3 miles? Heavy new supply (>2% of stock underway) typically softens rents 12–24 months out; light construction supports rent growth.
Investment metrics
- 1% rule
- 1.24% ✓
- Cap rate
- 7.81%
- Cash-on-cash
- 5.40%
- DSCR
- 1.24
- GRM
- 6.7
CMA / ARV
- ARV (median comp)
- $136,900
- List price
- $139,999
- Delta
- 2.26%
- Verdict
- FAIR
- Comps
- 20 within 1.0 mi
Projected returns pro-forma
-3.0% appreciation · 2.69% rent growth · sell at horizon
- IRR
- -8.2%
- Equity multiple
- 0.70×
- Total profit
- $-11,821
- Equity at exit
- $20,874
- IRR
- 1.0%
- Equity multiple
- 1.07×
- Total profit
- $2,651
- Equity at exit
- $12,105
Cash invested: $39,200 (down + closing). Projections, not guarantees.
Landlord ↔ Tenant lean methodology
- Overall (STATE)
- 18 Strongly Tenant-Friendly
- State California
- 18 Strongly Tenant-Friendly · D+13
- County
- — inherits STATE
- City
- — inherits STATE
ZIP-level market 95207
- Rents YoY
- 2.7%
- Active inventory
- 171
- Price-to-rent
- 6.7×
Monthly cashflow live
- Estimated rent
- $1,737 high interval (Pro) →
- Mortgage (P&I)
- −$734
- Tax from tax record
- −$108 /mo · $1,296/yr
- Insurance
- −$58
- HOA
- −$295
- Vacancy / Maint / Mgmt
- −$365
- Net cashflow
- $176
Break-even live
UW: 25.0% down · 7.5% · 30yr · 1.5% tax · 5.0% vac · 8.0% maint · 8.0% mgmt
Financing live
Cash to close
- Down payment
- $35,000
- Closing costs
- $4,200
- Reserves months
- —
- Total cash needed
- —
Loan-product check · same deal, 3 products live
Conventional
25% down · 7.5% · 30yr
- Down + closing
- —
- Monthly P&I
- —
- Monthly cashflow
- —
- DSCR
- —
- Eligible?
- —
Personal DTI + credit; lowest rate.
DSCR
20% down · 8.5% · 30yr
- Down + closing
- —
- Monthly P&I
- —
- Monthly cashflow
- —
- DSCR
- —
- Eligible?
- —
No personal income docs; deal must DSCR.
Hard money
10% down · 12.0% · 12mo
- Down + closing
- —
- Monthly P&I
- —
- Monthly cashflow
- —
- DSCR
- —
- Eligible?
- —
Short-term bridge; refi at stabilization.
Rent comps 38 comps
| Address | Beds | Baths | Sqft | Rent | $/sqft | DOM | Units | Dist |
|---|---|---|---|---|---|---|---|---|
| 4433 Continental Way Stockton, CA | 1.0–2.0 | 1.0 | 786 | $2,662 | $3.38 | 2d | 23 | 0.13mi |
| 4475 La Cresta Way #2 Stockton, CA | 2.0 | 1.0 | 840 | $1,950 | $2.32 | 43d | 1 | 0.14mi |
| 126 E Jamestown St Stockton, CA | 2.0 | 1.0 | 750 | $1,195 | $1.59 | 43d | 1 | 0.39mi |
| 126 E Jamestown St Apt 221 Stockton, CA | 2.0 | 1.0 | 750 | $1,195 | $1.59 | 23d | 1 | 0.48mi |
| 126 E Jamestown St Unit 230 Stockton, CA | 2.0 | 1.0 | 700 | $1,095 | $1.56 | 43d | 1 | 0.48mi |
| 4770 West Ln Stockton, CA | 1.0 | 1.0 | 657 | $1,795 | $2.73 | 43d | 1 | 0.49mi |
| 4770 West Ln Stockton, CA | 1.0 | 1.0 | 657 | $1,795 | $2.73 | 21d | 1 | 0.49mi |
| 4770 West Ln Stockton, CA | 1.0 | 1.0 | 657 | $1,795 | $2.73 | 14d | 1 | 0.49mi |
| 4770 West Ln Stockton, CA | 1.0 | 1.0 | 657 | $1,795 | $2.73 | 10d | 1 | 0.49mi |
| 150 Gateway Ct Stockton, CA | 2.0 | 1.0 | 645 | $1,375 | $2.13 | 43d | 1 | 0.49mi |
| 3814 N California St Unit 6 Stockton, CA | 2.0 | 1.0 | 600 | $1,000 | $1.67 | 10d | 1 | 0.51mi |
| 3814 N California St Unit 3 Stockton, CA | 2.0 | 1.0 | 600 | $1,000 | $1.67 | 3d | 1 | 0.52mi |
| 705 Camanche Ln Unit CAM-07 Stockton, CA | 2.0 | 1.0 | 940 | $1,695 | $1.80 | 18d | 1 | 0.63mi |
| 705 Camanche Ln Stockton, CA | 2.0 | 1.0 | 940 | $1,495 | $1.59 | 2d | 1 | 0.63mi |
| 705 Camanche Ln Unit CAM-12 Stockton, CA | 2.0 | 1.0 | 940 | $1,495 | $1.59 | 18d | 1 | 0.63mi |
| 613 Camanche Ln Stockton, CA | 1.0–2.0 | 1.0 | 815 | $1,695 | $2.08 | 2d | 3 | 0.63mi |
| 5324 Holiday Dr Stockton, CA | 1.0–2.0 | 1.0 | 750 | $1,495 | $1.99 | 2d | 3 | 0.65mi |
| 110 E Grove St Apt 19 Stockton, CA | 1.0 | 1.0 | 595 | $1,050 | $1.76 | 43d | 1 | 0.76mi |
| 328 Northbank Ct #41 Stockton, CA | 2.0 | 1.5 | 885 | $1,600 | $1.81 | 18d | 1 | 0.80mi |
| 4332 Pacific Ave Stockton, CA | 1.0–2.0 | 1.0 | 645 | $1,545 | $2.39 | 2d | 3 | 0.94mi |
| 4332 Pacific Ave #37 Stockton, CA | 1.0 | 1.0 | 596 | $1,500 | $2.52 | 23d | 1 | 0.94mi |
| 4332 Pacific Ave #11 Stockton, CA | 2.0 | 1.0 | 695 | $1,545 | $2.22 | 23d | 1 | 0.94mi |
| 440 E Arcade St Stockton, CA | 3.0 | 2.0 | 962 | $2,350 | $2.44 | 43d | 1 | 1.05mi |
| 2704 N Hunter St Stockton, CA | 2.0 | 1.0 | 825 | $1,795 | $2.18 | 23d | 1 | 1.14mi |
| 764 E Swain Rd Unit SW-05 Stockton, CA | 2.0 | 1.0 | 915 | $1,675 | $1.83 | 2d | 1 | 1.14mi |
| 764 E Swain Rd Unit SW-12 Stockton, CA | 2.0 | 1.0 | 915 | $1,655 | $1.81 | 18d | 1 | 1.14mi |
| 764 E Swain Rd Stockton, CA | 2.0 | 1.0 | 915 | $1,675 | $1.83 | 10d | 1 | 1.14mi |
| 3301 Pacific Ave Stockton, CA | 1.0 | 1.0 | 685 | $1,375 | $2.01 | 23d | 1 | 1.16mi |
| 220 E Ellis St Stockton, CA | 2.0 | 1.0 | 940 | $1,495 | $1.59 | 43d | 1 | 1.20mi |
| 650 Dave Brubeck Way Unit 4B Stockton, CA | 1.0 | 1.0 | 600 | $850 | $1.42 | 14d | 1 | 1.20mi |
| 650 Dave Brubeck Way Unit 5A Stockton, CA | 2.0 | 1.0 | 600 | $1,650 | $2.75 | 43d | 1 | 1.20mi |
| 6032 Cresenda Ave Stockton, CA | 3.0 | 1.0 | 968 | $2,500 | $2.58 | 21d | 1 | 1.31mi |
| 4401 Manchester Ave Stockton, CA | 2.0 | 1.0–1.5 | 925 | $1,474 | $1.59 | 21d | 1 | 1.34mi |
| 4401 Manchester Ave Stockton, CA | 2.0 | 1.0–1.5 | 925 | $1,474 | $1.59 | 43d | 2 | 1.34mi |
| 6465 West Ln Stockton, CA | 1.0 | 1.0 | 539 | $1,270 | $2.36 | 11d | 1 | 1.38mi |
| 6465 West Ln Stockton, CA | 1.0 | 1.0 | 539 | $1,270 | $2.36 | 23d | 1 | 1.38mi |
| 6465 West Ln Stockton, CA | 1.0 | 1.0 | 539 | $1,320 | $2.45 | 43d | 1 | 1.38mi |
| 32 E Wyandotte St Apt D Stockton, CA | 2.0 | 1.0 | 900 | $1,500 | $1.67 | 43d | 1 | 1.50mi |
HOA detail condo
- Monthly dues
- $295 · $3,540/yr
- Assessments
- None detected in remarks — confirm with the listing agent.
Listing history 20 events
-
2026-06-18days on market $139,999 Active 171 DOM
-
2026-06-17days on market $139,999 Active 170 DOM
-
2026-06-16days on market $139,999 Active 169 DOM
-
2026-06-15days on market $139,999 Active 168 DOM
-
2026-06-14days on market $139,999 Active 166 DOM
-
2026-06-10days on market $139,999 Active 163 DOM
-
2026-06-09days on market $139,999 Active 162 DOM
-
2026-06-08days on market $139,999 Active 161 DOM
-
2026-06-07days on market $139,999 Active 160 DOM
-
2026-06-05days on market $139,999 Active 157 DOM
-
2026-06-03days on market $139,999 Active 156 DOM
-
2026-06-03days on market $139,999 Active 155 DOM
-
2026-06-01days on market $139,999 Active 154 DOM
-
2026-05-31days on market $139,999 Active 153 DOM
-
2024-01-11historical $1,395
-
2023-11-28$1,395
-
2020-11-04soldstatus $95,000
-
2009-08-19soldstatus $22,000
-
1999-07-27soldstatus $18,000
-
1997-11-26soldstatus $8,000
ⓘ Source: listings_history table (triggers on properties + properties_extension) + one-shot
backfill from property_details.listing_events for pre-trigger history.
Tax reassessment forecast CA · Resets to sale price
- Current annual tax
- $1,296 · $108/mo
- Projected year-2 tax
- $1,296 · $108/mo
- Expected delta
- $0/yr ($0/mo · 0.0%)
ⓘ Screening estimate from a state-policy table — verify with the county assessor before closing.
Climate risk First Street
- Flood 1/10 Low FEMA zone X · 0% chance over 30 yrs
- Wildfire 6/10 Major
- Heat 7/10 Severe 7 d/yr ≥102°F today · 15 d/yr by 30 yrs out
- Wind 1/10 Low
- Air quality 10/10 Extreme 30 unhealthy d/yr today · 30 by 30 yrs out
Nearby sold comps map
Loading sold comps map…
Walkable amenities ~0.75 mi
Loading nearby amenities…
Taxation est. · year 1
- Rental income
- $20,839
- − Mortgage interest
- −$7,842
- − Property taxes
- −$1,296
- − Insurance
- −$700
- − Repairs & maintenance
- −$1,667
- − Management
- −$1,667
- − HOA
- −$3,540
- − Depreciation
- −$4,073
- Taxable income
- $55
- Est. tax owed @ 24.0%
- −$13
- After-tax cash flow
- $2,104/yr
For passive investors: Depreciation is non-cash, so a rental often shows a tax loss while cash-flowing — sheltering income. Rental losses are passive: they offset passive income freely, and up to $25,000/yr can offset ordinary (W-2) income if you actively participate and your MAGI is under $100k (phasing out to $0 by $150k); unused losses carry forward. On sale, claimed depreciation is recaptured at up to 25%, and gains may owe capital-gains tax (a 1031 exchange can defer both). Figures are a year-1 estimate at your 24.0% rate — not tax advice; consult a CPA.
Schools (NCES district)
- District
- Stockton Unified
- NCES district ID
- 0638010
- Math proficiency
- 23% ▲ 2.00%
- Reading proficiency
- 46% ▲ 16.00%
- Median HH income
- $37,563
- Composite
- 28.65/100
- National rank
- #6701
- State rank
- #295 of 517 in CA
Livability — Stockton
- Score
- 57/100
- State rank
- #734
- US rank
- #21638
Category grades
Schools grade is shown separately in the Schools card above.
Census & demographics
- Census place
- Stockton, CA
- County
- San Joaquin County · 729,570 people
- City population
- 332,006
- Metro
- Stockton, CA
- Population (ZIP)
- 52,414
- Household income
- $69,455
- Rent vs Own
- Severe rent burden
- 3292.0
Population outlook (San Joaquin County) Hauer SSP2
- Today (2025)
- 796,965 people
- By 2030
- 828,849 · +4.0%
- By 2040
- 885,611 · +11.1%
- By 2050
- 929,798 · +16.7%
- By 2075
- 994,578 · +24.8%
- By 2100
- 971,291 · +21.9%
Race, ethnicity, and origin ACS 2023
- Neighborhood character
- Highly diverse neighborhood (Simpson 0.73)
- Race & ethnicity
- Hispanic / Latino 43% Two or more races 24% White 23% Black 14% Asian 13%
- Hispanic origin (detail)
- Mexican 38%
- Common ancestry
- Russian 1% Italian 1% Lithuanian 1%
- Foreign-born
- 18% · Canada, China, Vietnam
- Languages at home
- 66% English-only · Spanish 22% Other Asian/Pacific 4% Tagalog/Filipino 2%
Political lean MEDSL · San Joaquin
- 2024 margin
- Toss-up / Even · D 48.0% · R 48.9% · Other 3.0%
- 2008→2024 swing
- -11.6pp toward R · 2008: 10.7pp · 2024: -0.9pp
- All cycles
- 2024: R+0.9 2020: D+13.9 2016: D+12.9 2012: D+8.9 2008: D+10.7
Not yet ingested
- Civics
- —
Market trends
- HPI YoY
- ▼ -454.91%
- Current HPI
- 358.6024
- Rent YoY
- ▲ 2.69%
- Metro
- Stockton, CA
- State GDP YoY
- ▲ 3.21%
- F500 in state
- 116
Industry mix (Fortune 500 HQ in CA)
| Industry | F500 HQs | Revenue |
|---|---|---|
| Technology | 27 | $1,492B |
|
||
| Financial Services | 3 | $174B |
|
||
| Retail | 3 | $44B |
|
||
| Insurance | 3 | $26B |
|
||
| Media / Entertainment | 2 | $115B |
|
||
| Pharmaceuticals / Biotech | 2 | $62B |
|
||
Price history
-82.6% since first listed6 events — show timeline
- 2024-01-11 Rental Removed $1,395 RENTEC
- 2023-11-28 Listed for Rent $1,395 RENTEC
- 2020-11-04 Sold (Public Records) $95,000 Public Records
- 2009-08-19 Sold (Public Records) $22,000 Public Records
- 1999-07-27 Sold (Public Records) $18,000 Public Records
- 1997-11-26 Sold (Public Records) $8,000 Public Records
Property tax history
+8.8%/yrLatest (2025): $1,296 · +1.8% YoY. Source: county tax records.
Cash-flow waterfall
monthlySold comps — $/sqft
last 12 mo · ≤1 miLoading sold comps…