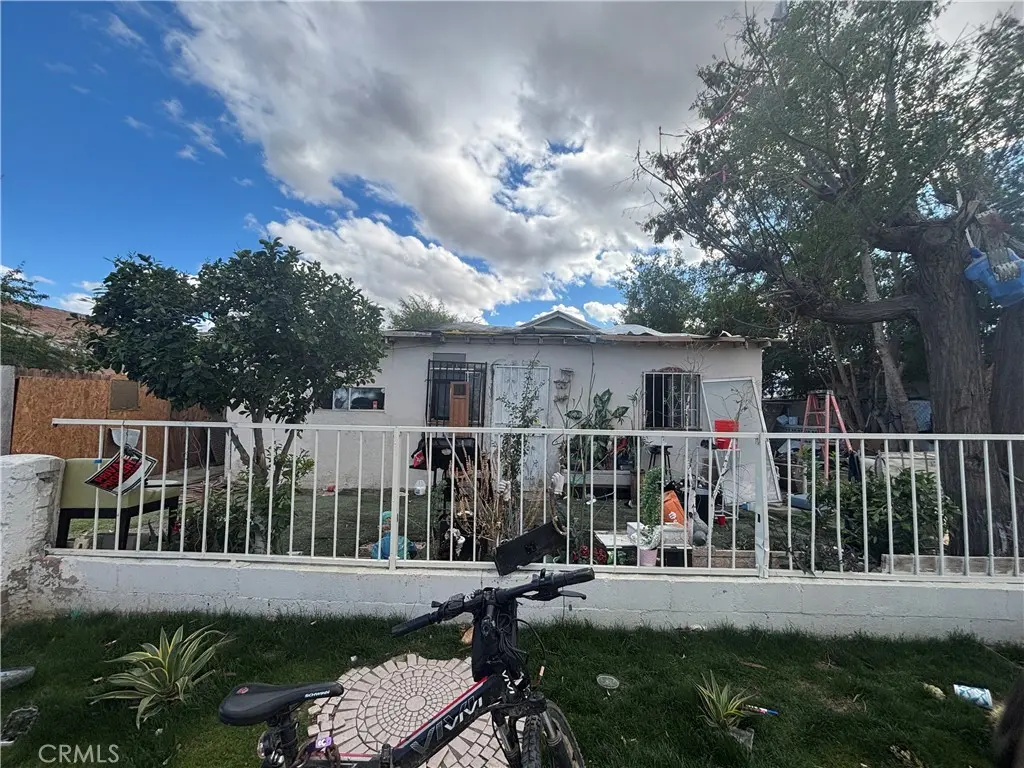
84023 Lingayan Ave · Indio, CA
Flood risk 1/10 · Minimal
- FEMA flood zone
- X (unshaded)
- Chance of flooding over 30 yrs
- 0.0%
- Est. flood insurance / yr
- $507 – $1,088
Fire risk 7/10 · Major
- Est. fire insurance / yr
- $659 – $1,223
Heat risk 10/10 · Severe
- Hot days now (above 115°F)
- 7 days/yr
- Hot days in 30 yrs
- 19 days/yr
Wind risk 1/10 · Minimal
- Chance of severe wind over 30 yrs
- —
Air-quality risk 3/10 · Minor
- Unhealthy air days now
- 3 days/yr
- Unhealthy air days in 30 yrs
- 5 days/yr
Risk factors via First Street. Map © Google.
Why this score? — see what drove the C grade
The composite is a weighted blend of 9 inputs, each scored 0–100. Each bar is that input's sub-score; the figure is the points it added to the 100-point composite (weight × sub-score).
- Cash flow +22.4/30.0
- ARV discount +12.6/15.0
- DSCR +7.2/10.0
- 1% rule +4.9/10.0
- Schools +3.8/10.0
- Rent growth +3.3/5.0
- Livability +2.7/5.0
- Condition / age +2.5/5.0
- Appreciation +0.0/10.0
$280,000
🖨 Deal sheet 📄 Offer letter ✓ Due diligence
Key facts
- 6,970 sq ft lot
- Built 1945
- Listed 13 days
Property features AI
Finance
- HOA & community: Curbs, street lighting, and sidewalks in the neighborhood
Exterior
- Utilities: Public sewer; District/public water
- Home design: Single-family house; Single story; No accessory dwelling unit
- Construction: Year built per assessor
- Exterior features: No pool
Interior
- Kitchen: Kitchen
- Bedrooms: 2 bedrooms on the main level
- Bathrooms: 2 full bathrooms (main level)
- Heating & cooling: Central furnace heating
- Interior features: One-level home; Entry on main level; Has view
- Laundry & utility: Exterior laundry area (outside)
Neighborhood map
What this means for you Summary
Snapshot
- This is a 2-bed/2.0-bath single-family listed at $280k.
Deal economics
- At list price, monthly cash flow is $465 ($6k/yr) — positive.
- The deal already cash-flows at list — no discount required.
- To meet the 1% rule (rent ≥ 1% of price), the offer needs to be $278k (0.9% below list).
- Recommended offer: $278k (0.9% below list) — sets the bar for 1% rule.
- Cap rate 8.3% vs local median 4.3% in Indio — top-decile yield for the area; either an underpriced asset or a hidden risk that comps aren't pricing in. Stress-test before assuming the spread holds.
Location & tenants
- Location reads 53/100 on livability (#927 in CA) — a working-class tenant base; expect higher turnover. Strengths: housing B+; Watch: employment D, schools F, crime F.
- Desert Sands Unified (suburban): math 31% / reading 56% proficiency, ranked #199 of 517 in CA (top 38%) — families likely to look elsewhere, expect single-tenant / working-renter base with shorter leases.
- Market conditions: Rents rising (+3.3%/yr); 514 active listings in the ZIP; 6 comparable units currently listed for rent nearby; rentals at typical pace (median 25d on market — plan ~3-4 weeks tenant-placement turnaround); 9,195 units permitted in Riverside County in 2024 (1,512 in 5+ unit buildings).
- At $2,775/mo this rent would consume 50% of the median local household income ($67k/yr) (locally 2036% of renters already pay >50% of income on rent) — very limited rent-growth headroom before tenants either downsize or default.
Forward outlook
- Local home prices are declining (-3.0%/yr); year-one equity from $2k of loan paydown is wiped out by about $8k of value loss. Plan a longer hold.
- Riverside County population projected at +22% by 2050 — long-run rental-demand tailwind backs the buy-and-hold thesis.
Negotiation context
- Only 13 days on market — expect competitive offers; lowballing is unlikely to land.
- 2 sale attempts since 20y ago with the ask held roughly flat each time — persistent listings suggest the price (not the market) is what's stuck; bring a comps-based counter.
- Current owner paid $59k; list at $280k implies a 375% gain — meaningful room to come down on a strong offer.
Risks & watch-outs
- Watch-outs: built in 1945 — expect roof / HVAC / electrical / plumbing capex.
- Climate carrying-cost: major wildfire risk; extreme-heat days projected 7→19/yr by 2055 (HVAC capex compounding) — expect insurance premiums to compound above CPI over the hold.
Questions for the listing agent
- Built in 1945 — when were the roof, HVAC, electrical panel, plumbing, and water heater last replaced?
- Is there a deadline driving the sale (1031 exchange, divorce, estate, relocation)? That informs how much negotiation room exists.
- Schools are F-rated, which usually means shorter tenancies and higher turnover. Who's the typical renter profile here, and what's been the actual vacancy rate?
- Crime grade is F in this area — have there been break-ins, vandalism, or insurance claims at this property in the last 3 years? What carrier currently insures it and at what premium?
- What's the average days-on-market for RENTAL listings here right now (not sales)? A rising rental-DOM trend means longer vacancies and softer asking-rent achievability than the comps imply.
- What's the recent tenant-quality profile in this submarket — average credit score on applications, eviction rate, late-payment / NSF rate, and stable-employment percentage? A property-management company in the area should have these aggregated.
- How much new for-sale + rental construction is in the pipeline within 1–3 miles? Heavy new supply typically softens prices + rents 12–24 months out; constrained supply supports both.
Investment metrics
- 1% rule
- 0.99% ✗
- Cap rate
- 8.29%
- Cash-on-cash
- 7.12%
- DSCR
- 1.32
- GRM
- 8.4
CMA / ARV
- ARV (on-the-fly)
- $316,160
- Comps found
- 9
Show comp detail 9 sales within ~0.75 mi
| Address | Dist | Beds/Ba | Sqft | Sold | Price | $/sf | Match |
|---|---|---|---|---|---|---|---|
| 84042 Lingayan | 0.03mi | 3/1.0 (+1) | 1,050 (+1%) | 4mo | $195,000 | $186 | 85 |
| 47770 Van Buren St | 0.06mi | 2/1.0 | 1,172 (+13%) | 8mo | $181,000 | $154 | 66 |
| 83651 Cardinal Ave | 0.46mi | 3/1.5 (+1) | 1,110 (+7%) | 0mo | $378,000 | $341 | 60 |
| 84221 Lingayan Ave | 0.18mi | 2/1.0 | 962 (-8%) | 20mo | $280,000 | $291 | 58 |
| 83552 Canary Ct | 0.53mi | 3/1.5 (+1) | 1,120 (+8%) | 1mo | $380,000 | $339 | 55 |
| 83539 Canary Ct | 0.53mi | 3/1.5 (+1) | 1,120 (+8%) | 7mo | $260,000 | $232 | 49 |
| 84359 Margarita Ave | 0.70mi | 3/2.0 (+1) | 1,085 (+4%) | 12mo | $415,000 | $382 | 45 |
| 49199 Sierra St | 0.69mi | 2/2.0 | 1,120 (+8%) | 23mo | $340,000 | $304 | 36 |
| 84360 Rosal Ave | 0.71mi | 3/2.0 (+1) | 1,148 (+10%) | 23mo | $410,000 | $357 | 25 |
Match score weights: distance 35% · size 25% · config 20% · recency 20%. Top-matched comps best support the ARV.
Projected returns pro-forma
-3.0% appreciation · 3.34% rent growth · sell at horizon
- IRR
- -5.1%
- Equity multiple
- 0.81×
- Total profit
- $-14,884
- Equity at exit
- $41,749
- IRR
- 4.9%
- Equity multiple
- 1.37×
- Total profit
- $28,769
- Equity at exit
- $24,209
Cash invested: $78,400 (down + closing). Projections, not guarantees.
Landlord ↔ Tenant lean methodology
- Overall (STATE)
- 18 Strongly Tenant-Friendly
- State California
- 18 Strongly Tenant-Friendly · D+13
- County
- — inherits STATE
- City
- — inherits STATE
ZIP-level market 92201
- Home prices YoY
- -28.4%
- Rents YoY
- 3.3%
- Active inventory
- 514
- Price-to-rent
- 8.4×
Monthly cashflow live
- Estimated rent
- $2,775 high interval (Pro) →
- Mortgage (P&I)
- −$1,468
- Tax from tax record
- −$142 /mo · $1,707/yr
- Insurance
- −$117
- HOA
- −$0
- Vacancy / Maint / Mgmt
- −$583
- Net cashflow
- $465
Break-even live
UW: 25.0% down · 7.5% · 30yr · 1.5% tax · 5.0% vac · 8.0% maint · 8.0% mgmt
Financing live
Cash to close
- Down payment
- $70,000
- Closing costs
- $8,400
- Reserves months
- —
- Total cash needed
- —
Loan-product check · same deal, 3 products live
Conventional
25% down · 7.5% · 30yr
- Down + closing
- —
- Monthly P&I
- —
- Monthly cashflow
- —
- DSCR
- —
- Eligible?
- —
Personal DTI + credit; lowest rate.
DSCR
20% down · 8.5% · 30yr
- Down + closing
- —
- Monthly P&I
- —
- Monthly cashflow
- —
- DSCR
- —
- Eligible?
- —
No personal income docs; deal must DSCR.
Hard money
10% down · 12.0% · 12mo
- Down + closing
- —
- Monthly P&I
- —
- Monthly cashflow
- —
- DSCR
- —
- Eligible?
- —
Short-term bridge; refi at stabilization.
Rent comps 6 comps
| Address | Beds | Baths | Sqft | Rent | $/sqft | DOM | Units | Dist |
|---|---|---|---|---|---|---|---|---|
| 83459 Caribe Ave Indio, CA | 3.0 | 2.0 | 1346 | $3,200 | $2.38 | 24d | 1 | 0.61mi |
| 83459 Caribe Ave Indio, CA | 3.0 | 2.0 | 1346 | $3,000 | $2.23 | 2d | 1 | 0.61mi |
| 83405 Date Ave Apt 8 Indio, CA | 3.0 | 1.0 | 1000 | $1,699 | $1.70 | 43d | 1 | 0.99mi |
| 48380 Garbo Dr Indio, CA | 2.0 | 1.0 | 704 | $1,850 | $2.63 | 24d | 1 | 1.20mi |
| 49058 Wayne St Indio, CA | 2.0 | 2.0 | 1156 | $4,000 | $3.46 | 43d | 1 | 1.29mi |
| 49058 Wayne St Indio, CA | 2.0 | 2.0 | 1156 | $4,000 | $3.46 | 5d | 1 | 1.29mi |
Listing history 7 events
-
2026-06-15days on market $280,000 Active 13 DOM
-
2026-06-13days on market $280,000 Active 11 DOM
-
2026-06-09days on market $280,000 Active 7 DOM
-
2026-06-08days on market $280,000 Active 6 DOM
-
2026-06-07days on market $280,000 Active 5 DOM
-
2026-06-04days on market $280,000 Active 2 DOM
-
2026-06-02$280,000 Active 1 DOM
ⓘ Source: listings_history table (triggers on properties + properties_extension) + one-shot
backfill from property_details.listing_events for pre-trigger history.
Tax reassessment forecast CA · Resets to sale price
- Current annual tax
- $1,707 · $142/mo
- Projected year-2 tax
- $2,128 · $177/mo
- Expected delta
- +$421/yr (+$35/mo · 24.7%)
ⓘ Screening estimate from a state-policy table — verify with the county assessor before closing.
Climate risk First Street
- Flood 1/10 Low FEMA zone X (unshaded) · 0% chance over 30 yrs
- Wildfire 7/10 Severe
- Heat 10/10 Extreme 7 d/yr ≥115°F today · 19 d/yr by 30 yrs out
- Wind 1/10 Low
- Air quality 3/10 Moderate 3 unhealthy d/yr today · 5 by 30 yrs out
Nearby sold comps map
Loading sold comps map…
Walkable amenities ~0.75 mi
Loading nearby amenities…
Taxation est. · year 1
- Rental income
- $33,301
- − Mortgage interest
- −$15,684
- − Property taxes
- −$1,707
- − Insurance
- −$1,400
- − Repairs & maintenance
- −$2,664
- − Management
- −$2,664
- − Depreciation
- −$8,145
- Taxable income
- $1,036
- Est. tax owed @ 24.0%
- −$249
- After-tax cash flow
- $5,332/yr
For passive investors: Depreciation is non-cash, so a rental often shows a tax loss while cash-flowing — sheltering income. Rental losses are passive: they offset passive income freely, and up to $25,000/yr can offset ordinary (W-2) income if you actively participate and your MAGI is under $100k (phasing out to $0 by $150k); unused losses carry forward. On sale, claimed depreciation is recaptured at up to 25%, and gains may owe capital-gains tax (a 1031 exchange can defer both). Figures are a year-1 estimate at your 24.0% rate — not tax advice; consult a CPA.
Schools (NCES district)
- District
- Desert Sands Unified
- NCES district ID
- 0611110
- Math proficiency
- 31% ▼ -4.00%
- Reading proficiency
- 56% ▲ 7.00%
- Median HH income
- $54,957
- Composite
- 37.77/100
- National rank
- #4346
- State rank
- #199 of 517 in CA
Livability — Indio
- Score
- 53/100
- State rank
- #927
- US rank
- #24244
Category grades
Schools grade is shown separately in the Schools card above.
Census & demographics
- County
- Riverside County · 2,287,001 people
- City population
- 100,560
- Metro
- Riverside-San Bernardino-Ontario, CA
- Population (ZIP)
- 65,825
- Household income
- $66,758
- Rent vs Own
- Severe rent burden
- 2036.0
Population outlook (Riverside County) Hauer SSP2
- Today (2025)
- 2,664,475 people
- By 2030
- 2,802,692 · +5.2%
- By 2040
- 3,050,904 · +14.5%
- By 2050
- 3,256,783 · +22.2%
- By 2075
- 3,655,058 · +37.2%
- By 2100
- 3,766,594 · +41.4%
Race, ethnicity, and origin ACS 2023
- Neighborhood character
- Predominantly Hispanic (74%)
- Race & ethnicity
- Hispanic / Latino 74% Two or more races 39% White 19% Black 3% Asian 3% Native American 1%
- Hispanic origin (detail)
- Mexican 69%
- Common ancestry
- Romanian 1% Iranian 1%
- Foreign-born
- 29% · Canada, Vietnam, Jamaica
- Languages at home
- 41% English-only · Spanish 55% Arabic 1% Tagalog/Filipino 1%
Political lean MEDSL · Riverside
- 2024 margin
- Toss-up / Even · D 48.0% · R 49.3% · Other 2.6%
- 2008→2024 swing
- -3.6pp toward R · 2008: 2.3pp · 2024: -1.3pp
- All cycles
- 2024: R+1.3 2020: D+8.0 2016: D+4.3 2012: R+0.4 2008: D+2.3
Not yet ingested
- Civics
- —
Market trends
- HPI YoY
- ▼ -138.46%
- Current HPI
- 348.6605
- Rent YoY
- ▲ 3.34%
- Metro
- Riverside-San Bernardino-Ontario, CA
- State GDP YoY
- ▲ 3.21%
- F500 in state
- 116
Industry mix (Fortune 500 HQ in CA)
| Industry | F500 HQs | Revenue |
|---|---|---|
| Technology | 27 | $1,492B |
|
||
| Financial Services | 3 | $174B |
|
||
| Retail | 3 | $44B |
|
||
| Insurance | 3 | $26B |
|
||
| Media / Entertainment | 2 | $115B |
|
||
| Pharmaceuticals / Biotech | 2 | $62B |
|
||
Price history
+374.6% since first listed4 events — show timeline
- 2026-06-02 Listed $280,000 CRMLS
- 2007-02-16 Listing Removed — GPSMLS
- 2006-10-26 Listed $290,000 GPSMLS
- 1996-12-11 Sold (Public Records) $59,000 Public Records
Property tax history
+2.5%/yrLatest (2025): $1,707 · +2.0% YoY. Source: county tax records.
Cash-flow waterfall
monthlySold comps — $/sqft
last 12 mo · ≤1 miLoading sold comps…