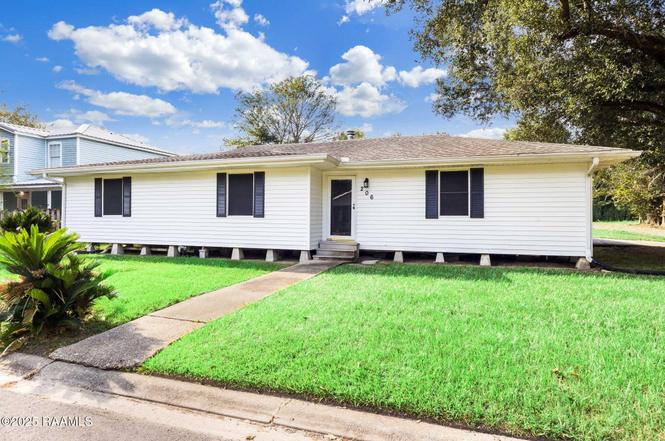
206 Nottingham Cir · Lafayette, LA
Flood risk 1/10 · Minimal
- FEMA flood zone
- X (unshaded)
- Chance of flooding over 30 yrs
- 0.0%
- Est. flood insurance / yr
- $507 – $1,088
Fire risk 3/10 · Minor
- Est. fire insurance / yr
- $1,269 – $2,357
Heat risk 8/10 · Major
- Hot days now (above 108°F)
- 7 days/yr
- Hot days in 30 yrs
- 18 days/yr
Wind risk 9/10 · Severe
- Chance of severe wind over 30 yrs
- 99.0%
Air-quality risk 2/10 · Minimal
- Unhealthy air days now
- 1 days/yr
- Unhealthy air days in 30 yrs
- 1 days/yr
Risk factors via First Street. Map © Google.
Why this score? — see what drove the C+ grade
The composite is a weighted blend of 9 inputs, each scored 0–100. Each bar is that input's sub-score; the figure is the points it added to the 100-point composite (weight × sub-score).
- Cash flow +23.8/30.0
- ARV discount +15.0/15.0
- DSCR +7.7/10.0
- 1% rule +5.2/10.0
- Schools +3.6/10.0
- Livability +3.5/5.0
- Rent growth +2.5/5.0
- Condition / age +2.5/5.0
- Appreciation +0.0/10.0
$175,000
🖨 Deal sheet 📄 Offer letter ✓ Due diligence
Listing remarks
* Seller offering $5,000 towards buyer's closing costs! * Welcome to this beautifully updated 3-bedroom, 2-bath home featuring a modern remodel completed in 2025. The home offers a spacious open-concept living and dining area with updated flooring and fresh paint throughout. The kitchen has been thoughtfully renovated with new cabinets, countertops, and appliances. Both bathrooms have been upgraded with contemporary fixtures and finishes. This home combines move-in ready condition with practical updates for long-term peace of mind!
Key facts
- 0.28 acre lot
- 2 parking spots
- Built 1980
Neighborhood map
What this means for you Summary
Snapshot
- This is a 3-bed/2.0-bath single-family listed at $175k.
Deal economics
- At list price, monthly cash flow is $336 ($4k/yr) — positive.
- The deal already cash-flows at list — no discount required.
- Meets the 1% rule at list price ($2k rent vs $175k).
- Recommended offer: $154k (12.0% below list) — sets the bar for market timing.
- Cap rate 8.6% vs local median 4.7% in Lafayette — top-decile yield for the area; either an underpriced asset or a hidden risk that comps aren't pricing in. Stress-test before assuming the spread holds.
Location & tenants
- Location reads 70/100 on livability (#63 in LA) — a middle-class / working-renter tenant base. Strengths: cost of living A+, housing A+, health & safety A+; Watch: amenities C-, employment C-, crime F.
- Lafayette Parish (urban): math 38% / reading 46% proficiency, ranked #19 of 98 in LA (top 19%) — families likely to look elsewhere, expect single-tenant / working-renter base with shorter leases.
- Zoned schools: Evangeline Elementary School (math 20% / reading 33%, grade F, #372 of 646 statewide, top 58%, 613 students, 84% FRL); Acadian Middle School (math 13% / reading 27%, grade F, #166 of 218 statewide, top 76%, 372 students, 74% FRL); Northside High School (math 17% / reading 22%, grade F, #186 of 265 statewide, top 73%, 655 students, 83% FRL) — zoned schools average 80% FRL vs 56% district-wide (24 pts higher); higher-poverty schools than district average — tighter screening recommended.
- Zoned-school proficiency averages 22% at this address vs 42% district-wide (-20 pts) — the specific schools serving this property underperform the Lafayette Parish average; the district grade overstates school quality for this exact location.
- Market conditions: 324 active listings in the ZIP; 9 comparable units currently listed for rent nearby; rentals lingering (median 44d on market — plan ~5-8 weeks vacancy on turnover, expect pricing pressure); 78% of comp listings sitting > 30 days — soft ceiling on asking rent; 1,585 units permitted in Lafayette Parish in 2024 (10 in 5+ unit buildings).
- This rent runs 34% of the median local income ($64k/yr) — at the standard rent-burdened threshold; future hikes will face affordability resistance.
Forward outlook
- Local home prices are declining (-3.0%/yr); year-one equity from $1k of loan paydown is wiped out by about $5k of value loss. Plan a longer hold.
- Lafayette County population projected at +34% by 2050 — long-run rental-demand tailwind backs the buy-and-hold thesis.
Negotiation context
- It's been on market 219 days — a 12% lower offer ($154k) is reasonable based on typical stale-listing flexibility.
- 2 sale attempts since 18y ago; this cycle's ask has dropped $23k (12%) from the opening price — seller is motivated, your offer sets the floor, not the list.
Risks & watch-outs
- Climate carrying-cost: severe wind risk, 99% chance of damaging wind over 30y; extreme-heat days projected 7→18/yr by 2055 (HVAC capex compounding) — expect insurance premiums to compound above CPI over the hold.
Questions for the listing agent
- It's been on market 219 days. Have you received any prior offers? Is the seller open to a 12% concession, seller financing, or rate buy-down credit?
- Why hasn't it sold? Are there any deal-killer items the seller is aware of (foundation, flood, title, zoning, code violations)?
- Is there a deadline driving the sale (1031 exchange, divorce, estate, relocation)? That informs how much negotiation room exists.
- Schools are B-rated — typically a magnet for longer-tenancy family renters. What's the average tenant stay here, and is there a school-zone premium baked into asking?
- Crime grade is F in this area — have there been break-ins, vandalism, or insurance claims at this property in the last 3 years? What carrier currently insures it and at what premium?
- What's the average days-on-market for RENTAL listings here right now (not sales)? A rising rental-DOM trend means longer vacancies and softer asking-rent achievability than the comps imply.
- What's the recent tenant-quality profile in this submarket — average credit score on applications, eviction rate, late-payment / NSF rate, and stable-employment percentage? A property-management company in the area should have these aggregated.
- How much new for-sale + rental construction is in the pipeline within 1–3 miles? Heavy new supply typically softens prices + rents 12–24 months out; constrained supply supports both.
Investment metrics
- 1% rule
- 1.02% ✓
- Cap rate
- 8.59%
- Cash-on-cash
- 8.22%
- DSCR
- 1.37
- GRM
- 8.1
CMA / ARV
- ARV (on-the-fly)
- $282,220
- Comps found
- 11
Show comp detail 11 sales within ~0.75 mi
| Address | Dist | Beds/Ba | Sqft | Sold | Price | $/sf | Match |
|---|---|---|---|---|---|---|---|
| 206 Nottingham Cir | 0.00mi | 3/2.0 | 1,784 (-13%) | 1mo | $175,000 | $98 | 77 |
| 108 Dupre Rd | 0.47mi | 3/2.5 | 2,140 (+4%) | 16mo | $338,500 | $158 | 56 |
| 205 Park Haven Dr | 0.62mi | 4/2.5 (+1) | 2,011 (-2%) | 6mo | $273,795 | $136 | 55 |
| 139 Oak Haven Dr | 0.62mi | 4/3.0 (+1) | 2,072 (+1%) | 10mo | $263,000 | $127 | 53 |
| 116 Oak Haven Dr | 0.73mi | 4/3.0 (+1) | 1,969 (-4%) | 2mo | $269,560 | $137 | 48 |
| 203 Park Haven Dr | 0.62mi | 3/2.0 | 1,895 (-8%) | 16mo | $263,120 | $139 | 45 |
| 114 Crab Apple Hl | 0.32mi | 4/2.0 (+1) | 2,340 (+14%) | 17mo | $270,000 | $115 | 43 |
| 205 Mark Ln | 0.56mi | 3/2.0 | 1,875 (-9%) | 19mo | $210,000 | $112 | 43 |
| 120 Oak Haven Dr | 0.72mi | 3/2.0 | 1,895 (-8%) | 19mo | $263,130 | $139 | 37 |
| 136 Oak Haven Dr | 0.72mi | 4/3.0 (+1) | 1,969 (-4%) | 17mo | $269,425 | $137 | 36 |
| 118 Oak Haven Dr | 0.72mi | 4/2.5 (+1) | 1,833 (-11%) | 20mo | $259,470 | $142 | 25 |
Match score weights: distance 35% · size 25% · config 20% · recency 20%. Top-matched comps best support the ARV.
Projected returns pro-forma
-3.0% appreciation · 3.0% rent growth · sell at horizon
- IRR
- -3.8%
- Equity multiple
- 0.86×
- Total profit
- $-7,038
- Equity at exit
- $26,093
- IRR
- 5.8%
- Equity multiple
- 1.43×
- Total profit
- $21,178
- Equity at exit
- $15,131
Cash invested: $49,000 (down + closing). Projections, not guarantees.
Landlord ↔ Tenant lean methodology
- Overall (STATE)
- 90 Strongly Landlord-Friendly
- State Louisiana
- 90 Strongly Landlord-Friendly · R+12
- County
- — inherits STATE
- City
- — inherits STATE
ZIP-level market 70507
- Home prices YoY
- -20.6%
- Active inventory
- 324
- Price-to-rent
- 8.1×
Monthly cashflow live
- Estimated rent
- $1,791 high interval (Pro) →
- Mortgage (P&I)
- −$918
- Tax from tax record
- −$89 /mo · $1,068/yr
- Insurance
- −$73
- HOA
- −$0
- Vacancy / Maint / Mgmt
- −$376
- Net cashflow
- $336
Break-even live
UW: 25.0% down · 7.5% · 30yr · 1.5% tax · 5.0% vac · 8.0% maint · 8.0% mgmt
Financing live
Cash to close
- Down payment
- $43,750
- Closing costs
- $5,250
- Reserves months
- —
- Total cash needed
- —
Loan-product check · same deal, 3 products live
Conventional
25% down · 7.5% · 30yr
- Down + closing
- —
- Monthly P&I
- —
- Monthly cashflow
- —
- DSCR
- —
- Eligible?
- —
Personal DTI + credit; lowest rate.
DSCR
20% down · 8.5% · 30yr
- Down + closing
- —
- Monthly P&I
- —
- Monthly cashflow
- —
- DSCR
- —
- Eligible?
- —
No personal income docs; deal must DSCR.
Hard money
10% down · 12.0% · 12mo
- Down + closing
- —
- Monthly P&I
- —
- Monthly cashflow
- —
- DSCR
- —
- Eligible?
- —
Short-term bridge; refi at stabilization.
Rent comps 9 comps
| Address | Beds | Baths | Sqft | Rent | $/sqft | DOM | Units | Dist |
|---|---|---|---|---|---|---|---|---|
| 301 Nottingham Cir Lafayette, LA | 3.0 | 2.5 | 1833 | $1,600 | $0.87 | 43d | 1 | 0.01mi |
| 206 Teddy Ln Lafayette, LA | 4.0 | 2.5 | 1788 | $1,945 | $1.09 | 43d | 1 | 0.77mi |
| 202 Teddy Ln Lafayette, LA | 4.0 | 2.5 | 1788 | $1,945 | $1.09 | 21d | 1 | 0.78mi |
| 111 Salvat Dr Lafayette, LA | 4.0 | 2.5 | 1788 | $1,945 | $1.09 | 43d | 1 | 0.78mi |
| 105 Salvat Dr Lafayette, LA | 3.0 | 2.0 | 1593 | $1,740 | $1.09 | 43d | 1 | 0.78mi |
| 104 Foggy Ln Lafayette, LA | 3.0 | 2.0 | 1564 | $1,735 | $1.11 | 43d | 1 | 0.84mi |
| 237 Beau Bassin Rd Carencro, LA | 4.0 | 3.0 | 2600 | $1,950 | $0.75 | 21d | 1 | 0.92mi |
| 237 Beau Bassin Rd Carencro, LA | 4.0 | 3.0 | 2600 | $1,950 | $0.75 | 43d | 1 | 0.92mi |
| 206 Chestnut Oak Dr Lafayette, LA | 4.0 | 2.0 | 1836 | $2,000 | $1.09 | 43d | 1 | 1.24mi |
Listing history 6 events
-
2026-04-24status Pending
-
2026-03-19price $175,000
-
2026-01-17price $185,000
-
2025-10-28price $193,000
-
2025-09-16$198,000 Active
-
2008-03-27$160,000
ⓘ Source: listings_history table (triggers on properties + properties_extension) + one-shot
backfill from property_details.listing_events for pre-trigger history.
Tax reassessment forecast LA · Resets to sale price
- Current annual tax
- $1,068 · $89/mo
- Projected year-2 tax
- $1,068 · $89/mo
- Expected delta
- $0/yr ($0/mo · 0.0%)
ⓘ Screening estimate from a state-policy table — verify with the county assessor before closing.
Climate risk First Street
- Flood 1/10 Low FEMA zone X (unshaded) · 0% chance over 30 yrs
- Wildfire 3/10 Moderate
- Heat 8/10 Severe 7 d/yr ≥108°F today · 18 d/yr by 30 yrs out
- Wind 9/10 Extreme 99% chance of damaging wind over 30 yrs
- Air quality 2/10 Low 1 unhealthy d/yr today · 1 by 30 yrs out
Nearby sold comps map
Loading sold comps map…
Walkable amenities ~0.75 mi
Loading nearby amenities…
Taxation est. · year 1
- Rental income
- $21,497
- − Mortgage interest
- −$9,803
- − Property taxes
- −$1,068
- − Insurance
- −$875
- − Repairs & maintenance
- −$1,720
- − Management
- −$1,720
- − Depreciation
- −$5,091
- Taxable income
- $1,221
- Est. tax owed @ 24.0%
- −$293
- After-tax cash flow
- $3,734/yr
For passive investors: Depreciation is non-cash, so a rental often shows a tax loss while cash-flowing — sheltering income. Rental losses are passive: they offset passive income freely, and up to $25,000/yr can offset ordinary (W-2) income if you actively participate and your MAGI is under $100k (phasing out to $0 by $150k); unused losses carry forward. On sale, claimed depreciation is recaptured at up to 25%, and gains may owe capital-gains tax (a 1031 exchange can defer both). Figures are a year-1 estimate at your 24.0% rate — not tax advice; consult a CPA.
Schools (NCES district)
- District
- Lafayette Parish
- NCES district ID
- 2200870
- Math proficiency
- 38% ▼ -32.00%
- Reading proficiency
- 46% ▼ -24.00%
- Median HH income
- $50,238
- Composite
- 36.15/100
- National rank
- #4741
- State rank
- #19 of 98 in LA
Livability — Lafayette
- Score
- 70/100
- State rank
- #63
- US rank
- #8133
Category grades
Schools grade is shown separately in the Schools card above.
Census & demographics
- Census place
- Lafayette, LA
- County
- Lafayette Parish · 207,544 people
- City population
- 158,114
- Metro
- Lafayette, LA
- Population (ZIP)
- 20,096
- Household income
- $64,049
- Rent vs Own
- Severe rent burden
- 503.0
Population outlook (Lafayette County) Hauer SSP2
- Today (2025)
- 280,930 people
- By 2030
- 301,092 · +7.2%
- By 2040
- 339,456 · +20.8%
- By 2050
- 375,156 · +33.5%
- By 2075
- 451,672 · +60.8%
- By 2100
- 497,203 · +77.0%
Race, ethnicity, and origin ACS 2023
- Neighborhood character
- Diverse neighborhood (Simpson 0.57)
- Race & ethnicity
- Black 47% White 45% Two or more races 6% Hispanic / Latino 3%
- Common ancestry
- Lithuanian 15%
- Foreign-born
- 2% · Canada
- Languages at home
- 94% English-only · French/Haitian/Cajun 4% Spanish 2%
Political lean MEDSL · Lafayette
- 2024 margin
- Solid R (+31.4) · D 33.5% · R 64.8% · Other 1.7%
- 2008→2024 swing
- -0.1pp no change · 2008: -31.3pp · 2024: -31.4pp
- All cycles
- 2024: R+31.4 2020: R+28.7 2016: R+33.6 2012: R+33.7 2008: R+31.3
Not yet ingested
- Civics
- —
Market trends
- HPI YoY
- ▼ -40.84%
- Current HPI
- 156.889
- Rent YoY
- —
- Metro
- Lafayette, LA
- State GDP YoY
- ▲ 3.29%
- F500 in state
- 10
Industry mix (Fortune 500 HQ in LA)
| Industry | F500 HQs | Revenue |
|---|---|---|
| Telecommunications | 2 | $23B |
|
||
| Utilities | 1 | $12B |
|
||
| Wholesale / Distribution | 1 | $5B |
|
||
| Advertising | 1 | $2B |
|
||
Price history
+9.4% since first listed6 events — show timeline
- 2026-04-24 Pending — AcadianaMLS
- 2026-03-19 Price Changed $175,000 AcadianaMLS
- 2026-01-17 Price Changed $185,000 AcadianaMLS
- 2025-10-28 Price Changed $193,000 AcadianaMLS
- 2025-09-16 Listed $198,000 AcadianaMLS
- 2008-03-27 Listed $160,000 AcadianaMLS
Property tax history
+4.0%/yrLatest (2025): $1,068 · -1.1% YoY. Source: county tax records.
Cash-flow waterfall
monthlySold comps — $/sqft
last 12 mo · ≤1 miLoading sold comps…