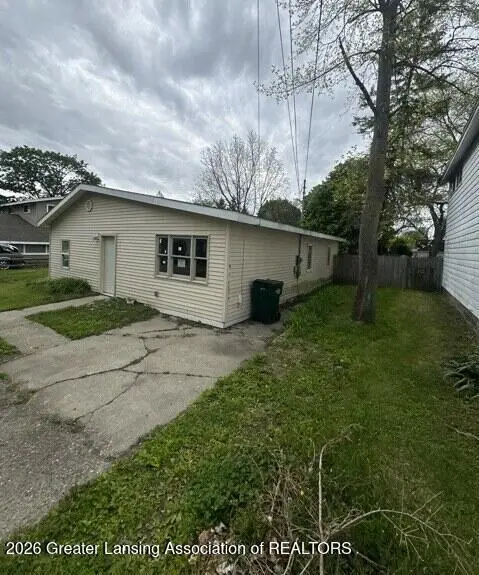
1020 R G Curtiss Ave · Lansing, MI
Flood risk 5/10 · Moderate
- FEMA flood zone
- X (unshaded)
- Chance of flooding over 30 yrs
- 0.52%
- Est. flood insurance / yr
- $507 – $1,088
Fire risk 1/10 · Minimal
- Est. fire insurance / yr
- $784 – $1,456
Heat risk 2/10 · Minimal
- Hot days now (above 97°F)
- 7 days/yr
- Hot days in 30 yrs
- 16 days/yr
Wind risk 2/10 · Minimal
- Chance of severe wind over 30 yrs
- —
Air-quality risk 2/10 · Minimal
- Unhealthy air days now
- 1 days/yr
- Unhealthy air days in 30 yrs
- 2 days/yr
Risk factors via First Street. Map © Google.
Why this score? — see what drove the B- grade
The composite is a weighted blend of 9 inputs, each scored 0–100. Each bar is that input's sub-score; the figure is the points it added to the 100-point composite (weight × sub-score).
- Cash flow +30.0/30.0
- DSCR +10.0/10.0
- 1% rule +9.0/10.0
- ARV discount +7.5/15.0
- Rent growth +5.0/5.0
- Livability +4.0/5.0
- Condition / age +2.5/5.0
- Schools +1.9/10.0
- Appreciation +0.0/10.0
$78,000
🖨 Deal sheet 📄 Offer letter ✓ Due diligence
Listing remarks MLS
Welcome to 1020 R G Curtiss! This ranch style home has a first floor laundry, fenced yard and more! Featuring 3 bedrooms and 1 bathroom and nestled on a dead end street. Seller makes no representations or warranties as to the property condition. EHO (Equal Housing Opportunity). Seller may contribute up to 3% for buyer's closing costs, upon buyer's request. Home will be sold AS IS. HUD Home visit hudhomestore.com and raine.com for more information. ''The Seller is selling this property in ''. As Is'' condition. Seller nor its representatives make any representations or warranties regarding the Property. ''
Key facts
- Fenced yard
- First floor laundry
- Dead end street
Tags
Property features AI
Exterior
- Parking: No attached garage; No designated parking features listed
- Utilities: Public sewer
- Home design: Ranch-style single-story home; Built in 1950
- Construction: Vinyl siding
- Exterior features: Neighborhood view; Lot dimensions approximately 66 x 132
Interior
- Kitchen: Kitchen (10 x 10); No appliances listed
- Bedrooms: 3 bedrooms (Primary bedroom: 10 x 11; Bedroom 2: 12 x 9; Bedroom 3: 10 x 9)
- Bathrooms: 1 full bath
- Heating & cooling: Forced-air heating; No cooling
- Interior features: No fireplace; Basement: none; 6 total rooms
- Laundry & utility: Main-level laundry room
Neighborhood map
What this means for you Summary
Snapshot
- This is a 3-bed/1.0-bath single-family listed at $78k.
Deal economics
- At list price, monthly cash flow is $322 ($4k/yr) — positive.
- The deal already cash-flows at list — no discount required.
- Meets the 1% rule at list price ($1k rent vs $78k).
- Recommended offer: $77k (1.5% below list) — sets the bar for market timing.
- Cap rate 11.2% vs local median 6.0% in Lansing — top-decile yield for the area; either an underpriced asset or a hidden risk that comps aren't pricing in. Stress-test before assuming the spread holds.
Location & tenants
- Location reads 79/100 on livability (#94 in MI, #2,182 nationally) — a middle-class / working-renter tenant base. Strengths: amenities A+, commute A+, cost of living A+; Watch: employment D, schools F, crime F.
- Lansing Public School District (urban): math 14% / reading 23% proficiency, ranked #650 of 760 in MI (top 86%) — low school quality limits family demand, transient renter base, plan for 1-2y turnover; 68% free/reduced lunch — lower-income household profile, screen leases tightly.
- Market conditions: Rents rising fast (+9.9%/yr); 143 active listings in the ZIP; 11 comparable units currently listed for rent nearby; rentals leasing fast (median 14d on market — plan ~1-2 weeks tenant-placement turnaround); 350 units permitted in Ingham County in 2024 (186 in 5+ unit buildings).
Forward outlook
- Local home prices are declining (-3.0%/yr); year-one equity from $539 of loan paydown is wiped out by about $2k of value loss. Plan a longer hold.
- Ingham County population projected at +11% by 2050 — modest demand growth; plan on rents tracking national, not racing it.
- At projected returns (-3.0% appreciation + 8.0% rent growth), your $22k cash investment doubles in ~6 years — after that, you're playing with house money.
Negotiation context
- It's been on market 20 days — a 2% lower offer ($77k) is reasonable based on typical stale-listing flexibility.
- 12 sale attempts since 12y ago with the ask held roughly flat each time — persistent listings suggest the price (not the market) is what's stuck; bring a comps-based counter.
Risks & watch-outs
- Watch-outs: built in 1950 — expect roof / HVAC / electrical / plumbing capex.
- Climate carrying-cost: moderate flood risk — expect insurance premiums to compound above CPI over the hold.
Questions for the listing agent
- Built in 1950 — when were the roof, HVAC, electrical panel, plumbing, and water heater last replaced?
- Is there a deadline driving the sale (1031 exchange, divorce, estate, relocation)? That informs how much negotiation room exists.
- Schools are F-rated, which usually means shorter tenancies and higher turnover. Who's the typical renter profile here, and what's been the actual vacancy rate?
- Crime grade is F in this area — have there been break-ins, vandalism, or insurance claims at this property in the last 3 years? What carrier currently insures it and at what premium?
- What's the average days-on-market for RENTAL listings here right now (not sales)? A rising rental-DOM trend means longer vacancies and softer asking-rent achievability than the comps imply.
- What's the recent tenant-quality profile in this submarket — average credit score on applications, eviction rate, late-payment / NSF rate, and stable-employment percentage? A property-management company in the area should have these aggregated.
- How much new for-sale + rental construction is in the pipeline within 1–3 miles? Heavy new supply typically softens prices + rents 12–24 months out; constrained supply supports both.
Investment metrics
- 1% rule
- 1.40% ✓
- Cap rate
- 11.25%
- Cash-on-cash
- 17.70%
- DSCR
- 1.79
- GRM
- 6.0
CMA / ARV
- ARV (on-the-fly)
- $173,456
- Comps found
- 12
Show comp detail 12 sales within ~0.75 mi
| Address | Dist | Beds/Ba | Sqft | Sold | Price | $/sf | Match |
|---|---|---|---|---|---|---|---|
| 1015 Brad St | 0.07mi | 3/1.0 | 1,212 (+3%) | 3mo | $180,000 | $149 | 89 |
| 5750 Ashley Dr | 0.29mi | 3/1.0 | 1,196 (+2%) | 5mo | $189,000 | $158 | 79 |
| 5723 Taffy Pkwy | 0.38mi | 3/1.0 | 1,094 (-7%) | 3mo | $135,000 | $123 | 69 |
| 5636 Ellendale Dr | 0.59mi | 3/1.0 | 1,140 (-3%) | 6mo | $208,900 | $183 | 63 |
| 5902 Hilliard Rd | 0.44mi | 3/1.0 | 1,060 (-10%) | 4mo | $89,000 | $84 | 60 |
| 6028 Rolfe Rd | 0.52mi | 3/2.0 | 1,217 (+4%) | 8mo | $180,000 | $148 | 58 |
| 6037 Hughes Rd | 0.36mi | 3/1.0 | 1,000 (-15%) | 3mo | $71,500 | $72 | 57 |
| 910 W Northrup St | 0.31mi | 3/1.0 | 1,008 (-14%) | 7mo | $195,700 | $194 | 56 |
| 1211 Ferley St | 0.53mi | 3/1.0 | 1,315 (+12%) | 10mo | $160,000 | $122 | 47 |
| 218 Raritan Rd | 0.62mi | 3/1.5 | 1,307 (+12%) | 4mo | $216,500 | $166 | 46 |
| 5928 Rolfe Rd | 0.51mi | 2/1.0 (-1) | 1,313 (+12%) | 10mo | $166,000 | $126 | 43 |
| 501 Bluebell Dr | 0.67mi | 3/2.0 | 1,325 (+13%) | 7mo | $196,000 | $148 | 37 |
Match score weights: distance 35% · size 25% · config 20% · recency 20%. Top-matched comps best support the ARV.
Projected returns pro-forma
-3.0% appreciation · 8.0% rent growth · sell at horizon
- IRR
- 14.7%
- Equity multiple
- 1.63×
- Total profit
- $13,660
- Equity at exit
- $11,630
- IRR
- 27.0%
- Equity multiple
- 3.96×
- Total profit
- $64,608
- Equity at exit
- $6,744
Cash invested: $21,840 (down + closing). Projections, not guarantees.
Landlord ↔ Tenant lean methodology
- Overall (STATE)
- 62 Landlord-Friendly
- State Michigan
- 62 Landlord-Friendly · EVEN
- County
- — inherits STATE
- City
- — inherits STATE
ZIP-level market 48911
- Rents YoY
- 9.9%
- Active inventory
- 143
- Price-to-rent
- 6.0×
Monthly cashflow live
- Estimated rent
- $1,090 high interval (Pro) →
- Mortgage (P&I)
- −$409
- Tax est. 1.5%
- −$98 /mo · $1,170/yr
- Insurance
- −$32
- HOA
- −$0
- Vacancy / Maint / Mgmt
- −$229
- Net cashflow
- $322
Break-even live
UW: 25.0% down · 7.5% · 30yr · 1.5% tax · 5.0% vac · 8.0% maint · 8.0% mgmt
Financing live
Cash to close
- Down payment
- $19,500
- Closing costs
- $2,340
- Reserves months
- —
- Total cash needed
- —
Loan-product check · same deal, 3 products live
Conventional
25% down · 7.5% · 30yr
- Down + closing
- —
- Monthly P&I
- —
- Monthly cashflow
- —
- DSCR
- —
- Eligible?
- —
Personal DTI + credit; lowest rate.
DSCR
20% down · 8.5% · 30yr
- Down + closing
- —
- Monthly P&I
- —
- Monthly cashflow
- —
- DSCR
- —
- Eligible?
- —
No personal income docs; deal must DSCR.
Hard money
10% down · 12.0% · 12mo
- Down + closing
- —
- Monthly P&I
- —
- Monthly cashflow
- —
- DSCR
- —
- Eligible?
- —
Short-term bridge; refi at stabilization.
Rent comps 11 comps
| Address | Beds | Baths | Sqft | Rent | $/sqft | DOM | Units | Dist |
|---|---|---|---|---|---|---|---|---|
| 2010 Georgetown Blvd Lansing, MI | 1.0–2.0 | 1.0 | 836 | $1,188 | $1.42 | 13d | 8 | 0.81mi |
| 1115 Dorchester Cir Lansing, MI | 2.0 | 1.0 | 850 | $855 | $1.01 | 13d | 5 | 0.92mi |
| 2420 Radford Rd Lansing, MI | 2.0 | 1.0 | 768 | $1,200 | $1.56 | 13d | 1 | 0.97mi |
| 315 E Edgewood Blvd Lansing, MI | 2.0 | 1.0 | 615 | $1,245 | $2.02 | 13d | 14 | 1.00mi |
| 5540 Kaynorth Rd Unit 4 Lansing, MI | 2.0 | 1.0 | 745 | $925 | $1.24 | 43d | 1 | 1.13mi |
| 911 W Cavanaugh Rd Lansing, MI | 1.0–2.0 | 1.0 | 775 | $1,000 | $1.29 | 21d | 1 | 1.21mi |
| 1001 W Cavanaugh Rd Lansing, MI | 1.0–2.0 | 1.0 | 775 | $850 | $1.10 | 13d | 4 | 1.23mi |
| 814 Louisa St Lansing, MI | 2.0 | 1.0 | 850 | $950 | $1.12 | 13d | 2 | 1.36mi |
| 5521 Joshua St Unit ST-102 Lansing, MI | 2.0 | 1.0 | 812 | $975 | $1.20 | 43d | 1 | 1.39mi |
| 4318 Pleasant Grove Rd Lansing, MI | 1.0–3.0 | 1.0–2.0 | 722 | $1,350 | $1.87 | 13d | 1 | 1.39mi |
| 645 E Jolly Rd Lansing, MI | 1.0–2.0 | 1.0 | 775 | $825 | $1.06 | 43d | 1 | 1.40mi |
Listing history 17 events
-
2026-06-18days on market $78,000 Active 20 DOM
-
2026-06-17days on market $78,000 Active 19 DOM
-
2026-06-16days on market $78,000 Active 18 DOM
-
2026-06-15days on market $78,000 Active 17 DOM
-
2026-06-14days on market $78,000 Active 15 DOM
-
2026-06-13days on market $78,000 Active 14 DOM
-
2026-06-10days on market $78,000 Active 12 DOM
-
2026-06-09days on market $78,000 Active 11 DOM
-
2026-06-08days on market $78,000 Active 10 DOM
-
2026-06-07days on market $78,000 Active 9 DOM
-
2026-06-05days on market $78,000 Active 6 DOM
-
2026-06-03days on market $78,000 Active 5 DOM
-
2026-06-02days on market $78,000 Active 4 DOM
-
2026-06-01days on market $78,000 Active 3 DOM
-
2026-05-31days on market $78,000 Active 2 DOM
-
2026-05-30remarks 612-char remark
-
2026-05-30$78,000 Active 1 DOM
ⓘ Source: listings_history table (triggers on properties + properties_extension) + one-shot
backfill from property_details.listing_events for pre-trigger history.
Climate risk First Street
- Flood 5/10 Major FEMA zone X (unshaded) · 52% chance over 30 yrs
- Wildfire 1/10 Low
- Heat 2/10 Low 7 d/yr ≥97°F today · 16 d/yr by 30 yrs out
- Wind 2/10 Low
- Air quality 2/10 Low 1 unhealthy d/yr today · 2 by 30 yrs out
Nearby sold comps map
Loading sold comps map…
Walkable amenities ~0.75 mi
Loading nearby amenities…
Taxation est. · year 1
- Rental income
- $13,082
- − Mortgage interest
- −$4,369
- − Property taxes
- −$1,170
- − Insurance
- −$390
- − Repairs & maintenance
- −$1,047
- − Management
- −$1,047
- − Depreciation
- −$2,269
- Taxable income
- $2,791
- Est. tax owed @ 24.0%
- −$670
- After-tax cash flow
- $3,197/yr
For passive investors: Depreciation is non-cash, so a rental often shows a tax loss while cash-flowing — sheltering income. Rental losses are passive: they offset passive income freely, and up to $25,000/yr can offset ordinary (W-2) income if you actively participate and your MAGI is under $100k (phasing out to $0 by $150k); unused losses carry forward. On sale, claimed depreciation is recaptured at up to 25%, and gains may owe capital-gains tax (a 1031 exchange can defer both). Figures are a year-1 estimate at your 24.0% rate — not tax advice; consult a CPA.
Schools (NCES district)
- District
- Lansing Public School District
- NCES district ID
- 2621150
- Math proficiency
- 14% ▲ 1.00%
- Reading proficiency
- 23% ▲ 3.00%
- Median HH income
- $37,453
- Composite
- 18.76/100
- National rank
- #14002
- State rank
- #650 of 760 in MI
Livability — Lansing
- Score
- 79/100
- State rank
- #94
- US rank
- #2182
Category grades
Schools grade is shown separately in the Schools card above.
Census & demographics
- Census place
- Lansing, MI
- County
- Ingham County · 237,052 people
- City population
- 161,269
- Metro
- Lansing-East Lansing, MI
- Population (ZIP)
- 39,876
- Household income
- $56,631
- Rent vs Own
- Severe rent burden
- 2255.0
Population outlook (Ingham County) Hauer SSP2
- Today (2025)
- 300,362 people
- By 2030
- 307,808 · +2.5%
- By 2040
- 320,492 · +6.7%
- By 2050
- 333,223 · +10.9%
- By 2075
- 373,693 · +24.4%
- By 2100
- 392,021 · +30.5%
Race, ethnicity, and origin ACS 2023
- Neighborhood character
- Diverse neighborhood (Simpson 0.70)
- Race & ethnicity
- White 46% Black 26% Hispanic / Latino 14% Two or more races 10% Asian 8%
- Hispanic origin (detail)
- Mexican 10% Puerto Rican 1%
- Common ancestry
- Romanian 3% Slovak 2% Iranian 2%
- Foreign-born
- 12% · Canada, Vietnam, Philippines
- Languages at home
- 83% English-only · Spanish 5% Other Indo-European 3% Other Asian/Pacific 2%
Political lean MEDSL · Ingham
- 2024 margin
- Strong D (+29.7) · D 63.9% · R 34.2% · Other 2.0%
- 2008→2024 swing
- -3.6pp toward R · 2008: 33.3pp · 2024: 29.7pp
- All cycles
- 2024: D+29.7 2020: D+32.2 2016: D+27.6 2012: D+27.9 2008: D+33.3
Not yet ingested
- Civics
- —
Market trends
- HPI YoY
- ▼ -179.62%
- Current HPI
- 176.0632
- Rent YoY
- ▲ 9.90%
- Metro
- Lansing-East Lansing, MI
- State GDP YoY
- ▲ 1.37%
- F500 in state
- 28
Industry mix (Fortune 500 HQ in MI)
| Industry | F500 HQs | Revenue |
|---|---|---|
| Automotive Parts | 3 | $48B |
|
||
| Automotive | 2 | $372B |
|
||
| Chemicals | 1 | $45B |
|
||
| Automotive Retail | 1 | $29B |
|
||
| Healthcare / Medical Devices | 1 | $23B |
|
||
| Automotive Technology | 1 | $20B |
|
||
Price history
+340.9% since first listed26 events — show timeline
- 2026-05-28 Listed $78,000 REALCOMP
- 2026-05-28 Listed $78,000 Greater Lansing AoR
- 2022-05-06 Sold (Public Records) $99,999 Public Records
- 2022-05-04 Sold (MLS) $99,999 REALCOMP
- 2022-05-04 Sold (MLS) $99,999 Greater Lansing AoR
- 2022-03-30 Pending — Greater Lansing AoR
- 2022-01-08 Listed $99,999 REALCOMP
- 2022-01-08 Listed $99,999 Greater Lansing AoR
- 2022-01-05 Listing Removed — REALCOMP
- 2022-01-05 Listing Removed — Greater Lansing AoR
- 2022-01-04 Relisted — Greater Lansing AoR
- 2022-01-04 Listing Removed — Greater Lansing AoR
- 2021-12-08 Listed $105,900 REALCOMP
- 2021-12-08 Listed $105,900 Greater Lansing AoR
- 2021-12-07 Listing Removed — Greater Lansing AoR
- 2021-12-07 Listing Removed — REALCOMP
- 2021-10-28 Price Changed $105,900 Greater Lansing AoR
- 2021-06-05 Listed $109,900 Greater Lansing AoR
- 2021-06-05 Listed $105,900 REALCOMP
- 2021-01-08 Sold (MLS) $52,000 Greater Lansing AoR
- 2021-01-08 Sold (MLS) $52,000 REALCOMP
- 2020-12-21 Pending — REALCOMP
- 2020-11-19 Listed $59,900 Greater Lansing AoR
- 2020-11-19 Listed $59,900 REALCOMP
- 2014-04-24 Sold (MLS) $18,321 Greater Lansing AoR
- 2014-02-20 Listed $17,690 Greater Lansing AoR
Property tax history
+16.0%/yrLatest (2025): $9,415 · +238.6% YoY. Source: county tax records.
Cash-flow waterfall
monthlySold comps — $/sqft
last 12 mo · ≤1 miLoading sold comps…